
INTRODUCTION
A dental impression is a copy of an oral structure used to make a dental restoration, denture, or dental guide. Surgical (dental) guides are medical fixtures that are used to determine the direction and depth of drilling when placing dental implants[1, 2]. An accurate impression is crucial for making dental guides that fit the patient’s dental anatomy well. Errors in manufacturing the impression can cause mechanical and biological complications due to incorrect implant positioning. In the research[3] it is stated that deviations of all technical parameters in the design of dental guides are not yet known, which ultimately may results in a total deviation of up to ± 2 mm. To ensure consistency, i.e. a good fit between the anatomy of the patient and the dental guide, there are numerous impression techniques today, and the two basic ones are: • Digitalization of oral anatomy is performed by 3D scanning of the patients cast. Although more time consuming and less accurate than direct imaging with an intraoral 3D scanner[4], this procedure still represents the gold standard in dentistry[5], • Direct digitalization of oral cavity with oral 3D scanner. Numerous studies document precision and comparison of precision between the two of the above methods[6-8]. At the same time, one study[6] states the positions on the teeth (premolars and molars) where the largest differences in the acquired data are between the digitization of the casting and the direct intraoral 3D image. Although there are numerous papers investigating the influence of different parameters on the making of the patient’s oral cavity model[5, 6, 8] nowhere is attention paid to the geometry being digitized. There is one study in which it is superficially stated which types of teeth are digitized better than others, i.e. it is stated that the largest errors in 3D scanning occur at the positions of the premolars and molars[6]. Based on the above, it can be concluded that there is a need to obtain such information, i.e. to do a research that would result in specific information on which dental surfaces due to the shape and curvature produce errors (innacuraccy) due to digitization by 3D scanner. From reserach[9] and also from experience we know that the curvature and complexity of the surface affects the accuracy of digitization, i.e. it is directly related to the resolution of the scanner and the size of the object to be digitized. As oral surfaces can be very complex, it is assumed that errors due to digitization occur, i.e. are always grouped at the same places. This may be related to scanner accessibility and the greater likelihood of sulcular and interdental areas containing larger data based on interpolation[10]. This ultimately means that some surfaces are digitized better and some worse (errors occur). In dental implantology, it is essential that the surfaces on which the dental guides rest are accurately digitized to fit well.
HYPOTHESIS FORMULATION
Hypothesis: Digitalization errors occur on the geometry (surfaces) of a higher curvature on the dental anatomy. To confirm this, a comparative analysis of casting measurements was performed for available laboratory scanners and one intraoral 3D scanner. The ATOS CORE industrial 3D scanner was used as a reference device, with which all others were compared. Because dental surfaces are complex, the problem is approached by observing each tooth separately and is further divided into three areas: the occlusal surface (OS), the tooth crown surface on the buccal (CSB), and the tooth crown surface on the palatal side (CSP), (Fig. 1). CSB and CSP areas represent low curvature surfaces, and OS represents the high curvature surface.
In order to determine on which surfaces the errors occur for each tooth, the largest positive and the largest negative deviations were read and one of the already mentioned codes was assigned to it. By observing the frequency of occurrence of the largest deviation (positive and negative), it can be determined in which of the three areas the maximum deviation by position and area of each tooth most often occurs.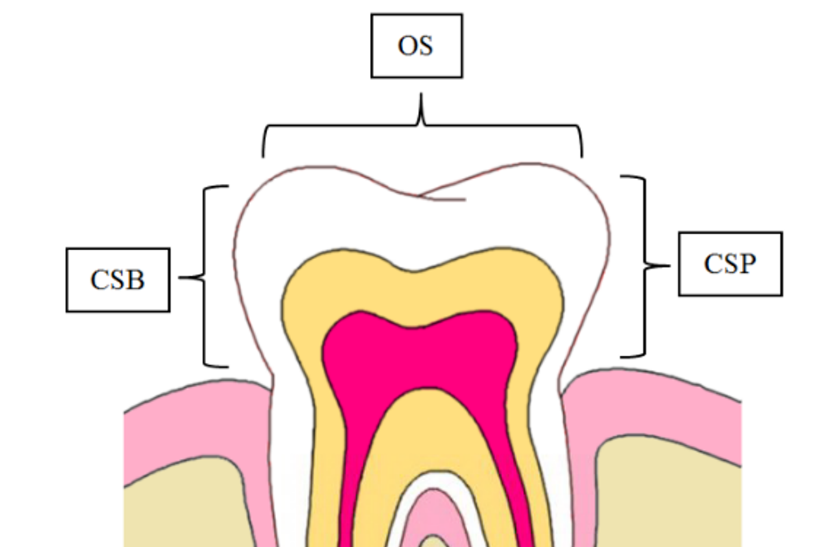
MATERIALS AND METHODS
Ten dental castings with full dentition (five mandibular and five maxillary) made of Class IV (Interstone) dental plaster were made from “dummy” jaws. Dental castings were digitalized with an industrial 3D scanner ATOS CORE, Gom company certified by PTB (The National Metrology Institute of Germany) and NIST (National Institute of Standards and Technology, USA). 3D scanning was performed in the measurement laboratory in controlled temperature conditions 22 ± 1 °C and relative humidity 55 % ± 10 %. Table 1 shows the basic characteristics of the reference device.
| Number of cameras, pcs | Measure area, mm | Work distance, mm | Resolution, mm | Sensor dimensions, mm | Operational temperature, °C |
| 2 | 135 ´ 100 | 170 | 0,01 | 206 ´ 205 ´ 64 | +5°C up to +40°C |
The castings were then digitalized with two dental laboratory scanners, one intraoral and one industrial 3D scanner. The castings were digitalized in standard laboratory conditions under which they are normally used in practice. In Table 2 the basic characteristics of the used 3D devices are listed. After digitalization, all models were saved in .stl file format. For comparison with reference models, the industrial software package GOM Inspect (GOM Gmbh, Germany) was used, which is used for analysis of 3D measurement data from structured light or laser scanners, three-coordinate measuring devices (CMM) and other measuring systems.
GOM software is used in product development, quality control and production. It is certified by NIST and PTB. Reference and controlled 3D models were inserted into GOM Inspect and superimposed with the “best-fit” method. After matching, the dimensions were compared using the “Surface Comparison on CAD” tool. The result of the comparison is a color graphic representation (Fig. 2).
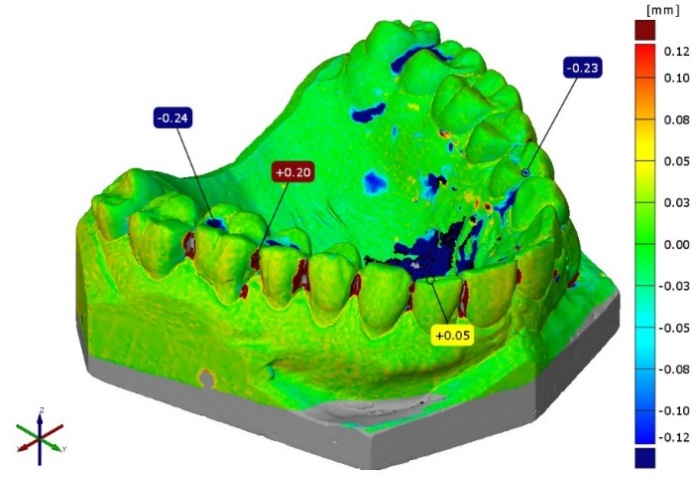
The positive deviation is shown in red and is defined as the geometry that is larger, i.e. located above the reference surface. The negative deviation is shown in blue and is defined as the geometry located below the reference surface. The green colour represents areas without deviations. In addition to the defined surfaces on the teeth (OS, CSP, CSB), the areas where two teeth touch (meet) were also observed. This area is very interesting because due to the narrow interdental spaces, a scanner error occurs when recording it[10]. As for the previous measurement, the largest positive and negative deviation was read for each interdental space, and it was assigned the corresponding code where the deviation occurred. The sign “P” indicates the palatal (lingual) side, and the sign “B” the buccal (cheek) side.
RESULTS
After comparison with the reference model and reading the positive and negative deviations for each casting, the map was obtained which shows in which frequency (percentage) the maximum deviations appear on each tooth and in which area. Also the average positive and negative deviation for each of the areas CSB, CSP, OS was calculated. For each mandibular and maxillary casting digitalized with the same dental scanner, a statistical t-test was performed to see if there was a statistically significant difference in scanner error between the mandible and the maxilla. The assumption is that there should be no difference. The t-test was conducted in the Matlab 2012a software package (Mathworks). The null hypothesis was tested that the deviation frequencies for maxilla and mandible were independent random samples from normal distributions with equal means and equal variances (α = 0,01). The results of all t-tests turned out null (0). This shows that for each 3D scanner there is no statistically significant difference between the mandible and maxilla. Therefore, the results are shown in a summarized table (Table 3) by tooth type for a particular 3D scanner.
 ,mm
,mmFurther in the text are the results of the deviation when imaging the interdental spaces of the teeth for a particular 3D scanner (Table 4 and Table 5).
DISCUSSION
The null hypothesis was accepted. Digitalization errors occur more frequently on the geometry (surfaces) of a higher curvature on the dental anatomy. By analyzing the summarized results for each group of teeth (Table 3, 4 and 5) we can state the following: • Molar – positive and negative deviations for each 3D scanner in more than 65 % of cases deviations are present on the occlusal surfaces (OS) with an amount that greatly exceeds the expected deviation specified by the manufacturer. The amount of 100 % incidence for Comet5 can be explained by the insufficient resolution of the 3D device. The 3D device Trios3 has the lowest incidence of 65,6 % for positive and 62,5 % for negative deviations, which can be explained by the fact that this is the only intraoral scanner, so errors compared to the other devices also occur in a higher percentage on other surfaces (CSB, CSP). • Premolar – similar to the molar for each 3D scanner, deviations are present mostly on the occlusal surfaces (OS). The high incidence rates of 97,5 % for positive and 100 % for negative deviations in Comet5 scanners can also be attributed to the lower resolution of the device. For the other three devices, the percentage for positive deviations is in the range of 52,5 % to 65 % with a mean deviation value that greatly exceeds the accuracy declared by the manufacturer. Negative deviations in the other three devices range from 68,8 % to 95 % on the occlusal surface (OS). It can be concluded that the incidence of the largest negative deviation is higher than the positive one, but the mean value is much lower. • Canine – positive deviations for all observed devices are deposited on the palatal and buccal surfaces (CSP, CSB). The highest frequency is present in Comet5 scanner (80 %) on the palatal side, while the lowest of 56,3 % is present in Trios3 scanner also on the palatal side. The other two scanners have amounts of 70 % (S900) and 85 % (Swing) on the buccal side. Negative deviations are deposited on the occlusal (Comet5 and S900) and palatal surfaces (Swing and Trios3). There is no significant difference in the mean values between the positive and negative deviations. • Incisor – positive deviations in the incisors occur in the highest frequency on the palatal and buccal surfaces (CSB, CSP). Negative deviations are again deposited on the occlusal surfaces, i.e. the incisal edge in all 3D devices, in the range from 40 % to 100 %. The consequence of the accumulation of negative deviation on the incisal edge, as well as the canines, indicates errors in matching and connecting separate images of the 3D scanner, which artificially “shrinks” the final surface, i.e. the geometry is smaller than in reality. This is probably due to sudden changes in the incisor geometry. • Interdental positive deviations – with all 3D devices, positive deviations are noticeable in the interdental spaces, which are many times larger than the nominal resolution of the device. Positive deviations are equally present on both sides (buccal and palatal), except for the Swing 3D scanner where 80 % of the errors are grouped buccally. This may be due to the influence of digitization methods. The casting “swings” during digitalization, so the surfaces on the palatal side are recorded first, and then on the buccal side, which causes errors in matching individual images. • Interdental negative deviations – are present in all 3D devices except Comet5 scanner, which can be explained by lower resolution which causes “filling and closing” of narrow spaces. Weaker resolution is not able to detect such sudden changes in geometry. Considering other devices negative deviations are equally distributed on buccal and palatal area and are of the same order of magnitude as positive ones.
CONCLUSION
In this preliminary study surface curvature influence on 3D scanning accuracy of dental castings was analysed. After comparing digitized dental castings to the reference model it was concluded that for all observed 3D scanners errors occur on various surfaces but most of them are located on surfaces with higher curvature. During 3D scanning special attention should be paid to the digitalization of the occlusal surfaces of the molars and premolars, because the error frequencies are highest there. Also, when supporting dental guides, occlusal surfaces should be avoided if possible in molars and premolars. In canines and incisors, the situation is similar because both positive and negative deviations are similar in values. Negative deviations can be taken as a reference, which, although small in size, also appear to a greater extent on the occlusal surface (incisal edge). The conclusion is that the reliance of dental guides on the incisal edge should be avoided. Interdental spaces, due to their complex geometry, pose a challenge in 3D scanning because they generate errors, so if they are crucial, special attention should be paid to them when digitalization with a 3D scanner. The conclusion is that interdental spaces should be avoided when designing and supporting dental guides. Future work suggests finding a numerical correlation between the accuracy of 3D scanned teeth surface and a surface curvature. Although the 3D scanned objects are represented in .stl file format which is a discrete representation of a continuous surface, mathematical operations like calculating surface curvature are possible. Comparing the 3D scanning deviation to the calculated curvature of the surface could unveil which curvature is hard to 3D scann and generates errors.