
1. Introduction
Elevated atmospheric particulate matter (PM) concentrations are associated with significant adverse health effects (Samet et al., 2000;Peters et al., 2001;Pope et al., 2002;Samoli et al., 2005;Anderson, 2009), affect ecosystems, influ- ence visibility and cloud formation in the atmosphere and play an important role in climate change (e.g.Andrea et al., 2005;Jiang et al., 2013). In most European countries including Croatia air quality standards for particulate matter have been introduced in order to protect human health and environment. Current standards are set for PM10 (total mass concentration of particles smaller than 10 μm) and PM2.5 (total mass concentration of particles smaller than 2.5 μm) (European Air Quality Directive 2008/50/EC, further used as Directive).
PM comes from a variety of natural and anthropogenic sources; they can be directly emitted to the atmosphere or formed as secondary pollutants in atmospheric chemical reactions. As a consequence, PM comprises complex mixture of solid and liquid parcels of organic matter, Earth’s crust elements iron (Fe), calcium (Ca), aluminium (Al), silicon (Si), potassium (K), and chlorine (Cl), secondary inorganic aerosols and trace metals. In addition, wind-blown soil and re-suspend- ed dust contribute largely to the coarse particle fraction (Harrison et al., 1999; Putaud et al., 2004;Luhana et al., 2004;Forsberg et al., 2005; Amato et al., 2009;Jeričević et al., 2012). It has been shown that contribution of PM emissions and their origins can be relevant at spatial scales ranging from local to regional and long-range, transboundary transport scales and can be analysed accordingly (e.g.Querol et al., 2004;Juda-Rezler et al., 2011).
Comprehensive analyses on PM data obtained over the past decade at more than 60 regional backgrounds, rural, suburban, urban and kerbside stations across Europe were conducted.Putaud et al. (2010) found that there is no single ratio between PM2.5 and PM10 mass concentrations for all sites although fairly constant ratios ranging from 0.5 to 0.9 were observed at most individual sites. The main constituents of both PM10 and PM2.5 were generally organic matter, sul- phate and nitrate while mineral dust could be a major constituent of PM10 at kerbside sites in Southern Europe. Source apportionment methods and results of particulate matter in Western Europe were reviewed byViana et al. (2008). Previous European studies mainly did not include data from Eastern and Southeastern (e.g. Croatia, Serbia, Romania, Bulgaria) European countries and generally there is a gap in knowledge on the PM levels and compositions in those areas.
Up to now research on PM in Croatia was mainly focused on urban concen- trations particularly on the mass and chemical analyses of heavy metals and polycyclic aromatic hydrocarbons (PAH) at residential urban background sta- tions in Zagreb area (e.g.Bešlić et al., 2007;Bešlić et al., 2008;Šišović et al., 2008) as well as research on PM and ozone in Rijeka area (Alebić-Juretić et al., 2007). Regional observations obtained with passive samplers during short-term campaigns in Croatia, Serbia and Bosnia and Herzegovina among other coun- tries in Central and Southeastern Europe have been used to analyse PAH levels and conduct the source apportionment analyses based on mass balance tech- nique (Klánová et al., 2007; Dvorská et al., 2011).
This research is focused on the detailed spatial and temporal analyses of ur- ban and rural PM10 and PM2.5 levels as well as on analyses of the corresponding meteorological parameters in Croatia in the period from 2006 to 2014 in order to investigate local air quality characteristics, compare results with studies con- ducted in other areas in Europe and provide basis for future investigations of PM pollution in Croatia. Data from the rural background measurement in the period from 2011–2014 are investigated for the first time in Croatia that is particularly important for the determination of relevant scientific knowledge of background air quality in Croatia regarding the PM and the contribution to the urban PM levels.
2. Data and methods
2.1. Air quality observations and PM emission sources
The PM measurements were acquired with three different observing ap- proaches (Tab. 1): gravimetric method (BS EN12341:2014, Ambient air. Standard gravimetric measurement method for the determination of the PM10 or PM2.5 mass concentration of suspended particulate matter), β-attenuation monitoring (e.g.Willeke and Baron, 1993) and by the optical particle counters of Grimm 180 instrument. The comparison of PM concentration data obtained by different measurement methods is still considered as a difficult problem. Standard, gravimetric method (BS EN1234:2014) is a classic method of weigh- ing of the deposited mass on a filter that is accepted as a standard reference method against which all other measurement methods are validated (Noble et al., 2001;EC, 2010). Although gravimetric method is a standard used for com- pliance reasons in EU there are numerous papers showing reactions going on between air and deposited particles as well as within the aerosol mass compro- mising these measurements too. Temperature and humidity history of the dust loaded onto filter greatly influences the actual mass on the filter (Allen et al., 1997;Eisner and Wiener, 2002;Pang et al., 2002). It is stated that at 50% relative humidity, aerosol particles can contain up to 30% of water (e.g. Putaud et al., 2004). On the other hand, calibration, temperature and humidity issues can create artefacts for β-attenuation monitoring that has to be taken into ac- count (e.g. Allen et al., 1997;Hauck et al., 2004). Demonstration that other methods than gravimetric yield results equivalent to the reference (EC, 2010) is needed. In Croatia the equivalence study was conducted for one station (Zagreb-1, seeTab. 1) between the gravimetric and β-attenuation monitors for three-year period from 2007 to 2010 and a satisfactory agreement based on cor- relation coefficient was found (Davila et al., 2011). However, the highest un- derestimation by the automatic (β-attenuation) measurements was found dur- ing the winter time when PM10 concentrations generally achieve maximum values. Since rural background measurements obtained with optical counters were not compared against gravimetric measurements the possible underestimation of observed concentrations was taken into account during interpretation of data.
*Classification of the stations is UT-urban traffic, UB-urban background, UI-urban industrial, RB-rural background, UBI-urban background industrial. Depending on the monitoring sites, concentrations of PM10 were determined by four methods: (1) a reference gravimetric sampler with quartz filter (Standard EN 12341), (2) β -attenuation method (MP101M), and (3) Grimm 180.
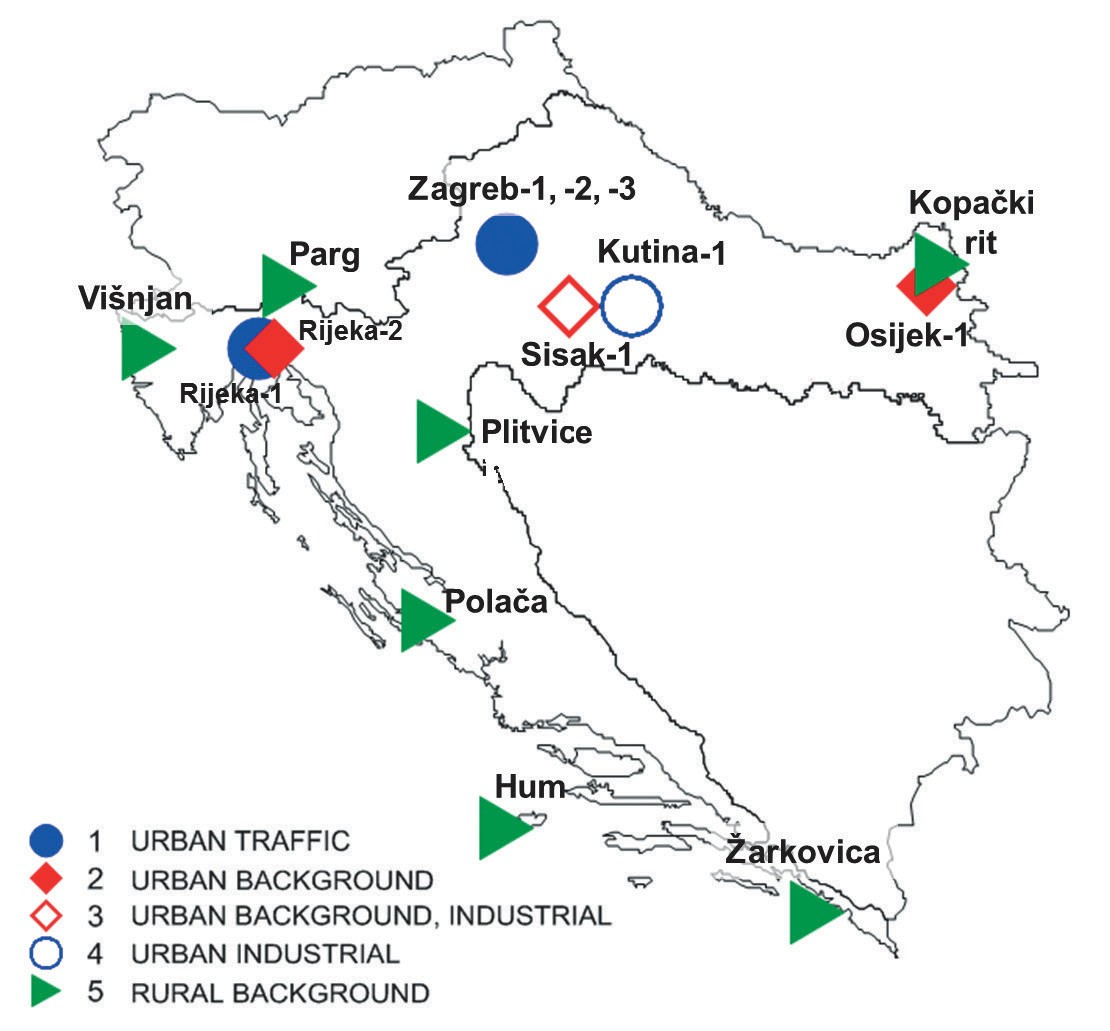
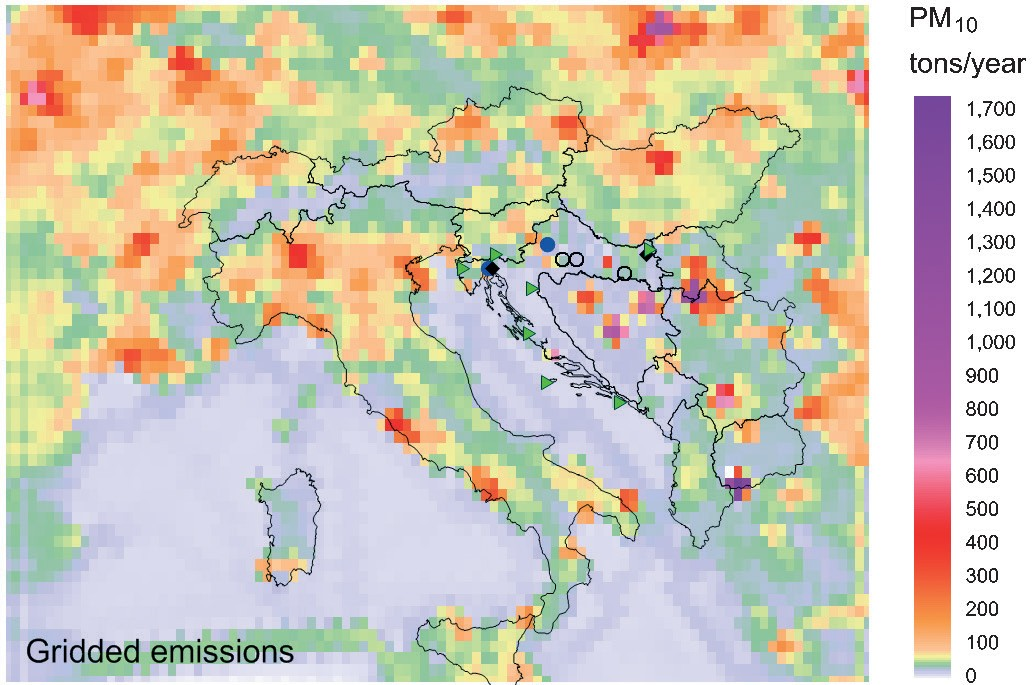
Air quality state network (further called state network) operated and maintained by the Meteorological and Hydrological Service of Croatia (MHSC). Locations of all stations are shown inFig. 1a and details about the stations, classification and measurement programme is given inTab. 1. InFig. 1b spatially distributed PM10 gridded emissions (EMEP4HR, Jeričević et al., 2007) were shown to inspect the location of sites in relation to the emission sources. The largest PM10 source is located in the south of Macedonia with emissions ~ 17 × 105 kg/year, following by the sources in Serbia, near Belgrade where emissions ~ 14 × 105 kg/year are recorded, then in Bosnia and Herzegovina with emissions ~ 9 × 10⁵ kg/year and in Budapest, Hungary with emissions ~ 4 × 10⁵ kg/year. The largest PM source with emissions ~ 300 tons/year in Croatia is located in the centre continental part of Croatia and comprises of the cement industry in the city of Našice.
In Croatia the air quality measurements from 13 (urban and rural) stations from the state network were used. Stations: Rijeka-2 and Osijek-1 are urban background stations, Sisak-1 is urban industrial, Kutina-1 is urban background industrial while Zagreb-1 and Rijeka-1 are urban traffic stations. Kutina-1 is under the influence of petrochemical industry while Sisak-1 is mainly impacted by the emissions of oil refineries. City of Rijeka is situated at the Adriatic coast while all other urban stations are continental. In Croatia 12 rural stations as part of the EU-funded PHARE 2006 project “Establishment of Air Quality Monitoring and Management System” have started with measurements in 2011. For this study observed hourly PM10 and PM2.5 concentrations were available from 7 rural background stations in Croatia distributed over the Croatian territory to capture the spatial and temporal concentration variations of different pollutants (Fig. 1a).
2.2. Limit values and data capture
According to the Directive, daily average PM10 concentrations ( (PM10 )day) should not exceed 50 μg/m3 more than 35 times in a calendar year while annual average concentrations ( (PM10 )year) should be lower than 40 μg/m . For PM2.5 concentrations an average annual limit value amounts 25 μg/m3. In order to determine the baseline of air pollution with PM in Croatia available PM10 and PM2.5 measurements were analysed in the period from 2006 to 2011 in the view of regulated limit values (Directive). Values of c (PM10 )year were calculated only for the urban stations with data capture > 75%. InTab. 2 the data capture of PM10 measurements at urban stations in Croatia in the period from 2006 to 2014 is shown. Also data capture for rural background stations in the period from 2011 to 2014 is given. Adequate data capture was available at almost all stations. The exception was identified for Zagreb-2 during 2009, 2010 and 2011, Rijeka-2 during 2008, 2011 and 2012, Polača 2011, 2014 and Žarkovica 2014. The calculation of the annual average stations with the number of exceedance higher than 35 were taken into the consideration although data capture was lower than 75%.
* Measurements at Zagreb-a_GRAV and Rijeka-1_GRAV are conducted with reference gravimetric methods (Standard EN 12341) while all other measurements are performed with automatic, β-attenuation method (MP101M).
2.3. Measurement and analysis of meteorological parameters
Available observed hourly meteorological parameters: temperature, relative humidity and wind speed and direction in the period from 2006 to 2014 for urban and in the period from 2011 to 2014 for rural stations are analysed using com- puter programming language R. The R is a statistical system, a system for statis- tical computation and graphics, and an environment for data analysis and statis- tics. The Openair software with different functions based on R was applied (Carslaw et al., 2012;Carslaw, 2012). The normalised hourly and monthly temperature, relative humidity and PM values are plotted as well as wind roses. Furthermore, bivariate polar plots (e.g.Carslaw et al., 2006;Westmoreland et al., 2007) of wind speed and direction together with the corresponding concentra- tions are analysed. Plots are shown as a continuous surface calculated through modelling using smoothing techniques. These plots have proved to be useful for quickly gaining a graphical impression of potential sources influences at a location. Bivariate polar plots are constructed by portioning wind speed, wind direction and concentration data into wind speed-direction bins and the mean concentration calculated for each bin. Testing on a wide range of data suggests that wind direction intervals at 10 degrees and 30 m/s wind speed intervals capture sufficient detail of the concentration distribution. The wind direction data typically available are generally rounded to 10 degrees and for typical surface measurements of wind speed in the range 0 to 20 to 30 m/s, intervals greater than 30 m/s would be difficult to justify based on a consideration of the accuracy of the instruments. The bins with fewer than 3 measurements were removed,
3. Results
3.1. The analyses of PM10 and PM2.5 concentrations in Croatia in the period from 2006 to 2014
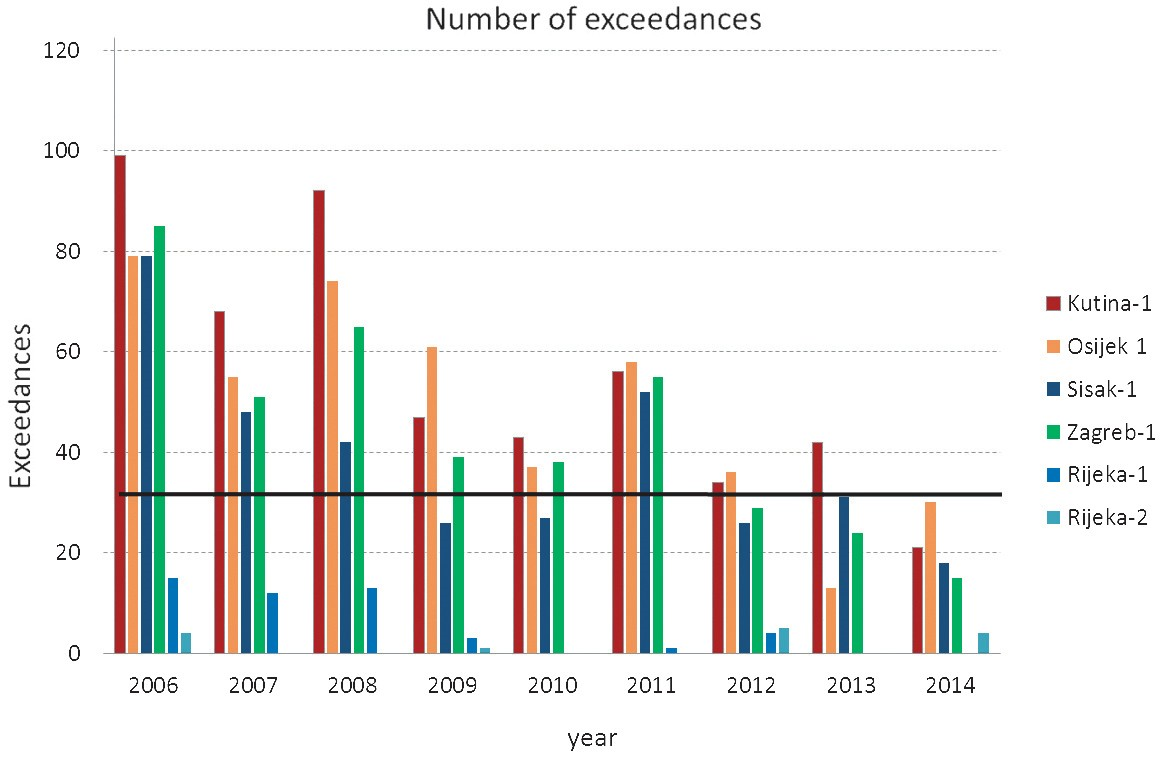
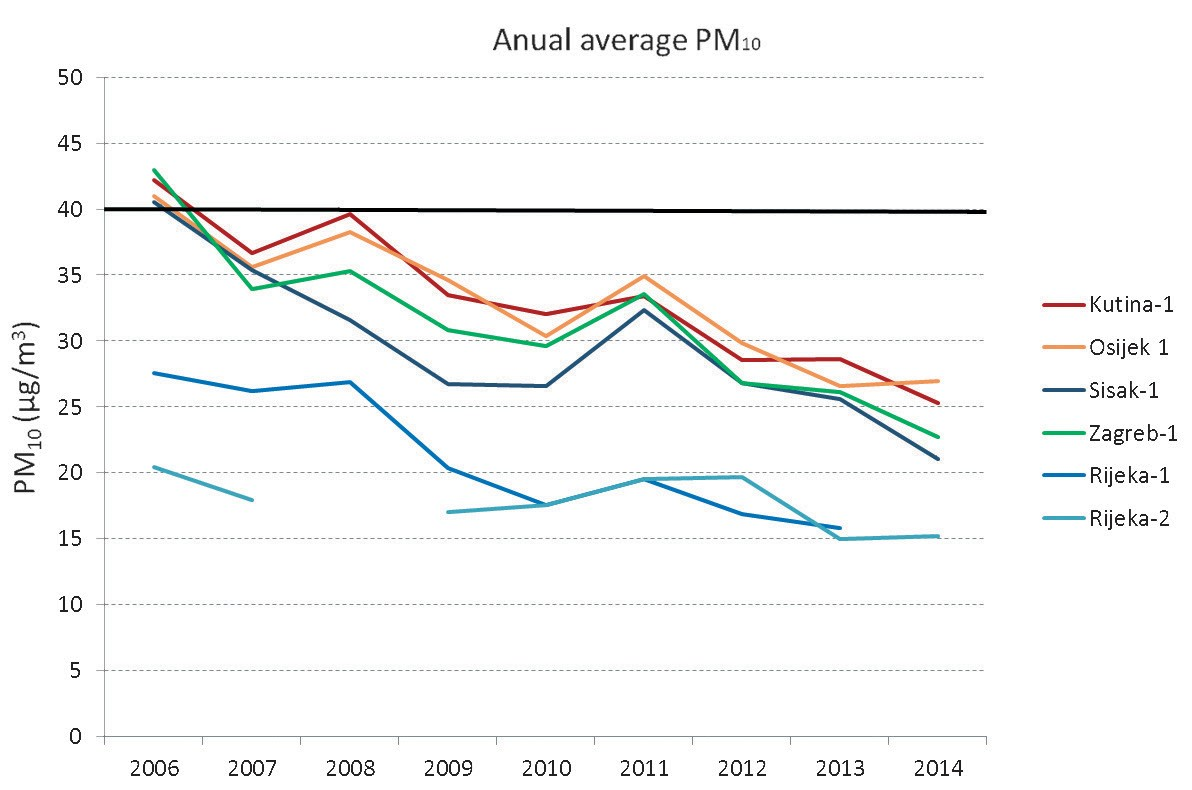
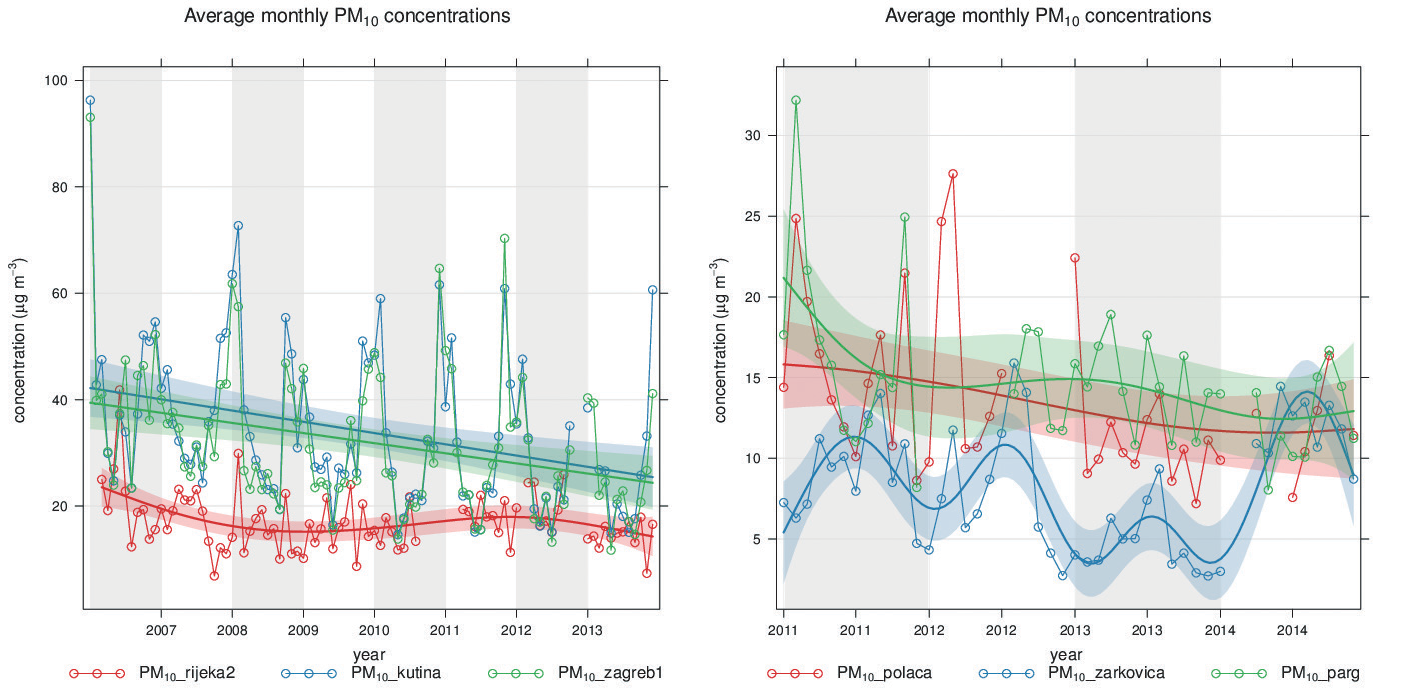
The measurements of urban PM pollutant concentrations in the state network started in 2006 when the annual limit value was exceeded at almost all continental urban sites. In the period from 2007 to 2014 a continuous decreasing trend is found and calculated (PM10 )year were considerably below the annual limit value 40 μg/m3 at all available stations in Croatia (Fig. 2 upper panel). Data are valuable for the analysis although it should be mentioned that non-reference methods were used and the equivalence studies are applied for the reporting pur- 3 poses. Generally (PM10 )year varied between 30 and 35 μg/m at continental urban stations while at coastal urban stations i.e., in the city of Rijeka c (PM10 )year varied between 15 and 28 μg/m3. The number of days (N) with (PM10)day higher than the limit value (50 μg/m3) is shown inFig. 2 (lower panel). It was found that N was well below the allowed number of days per year (NLV = 35) for the coastal stations in urban Rijeka area while at all continental stations N > NLV for almost all years. From 2012 a decrease in N is found and N < NLV for the majority of the continental stations except Kutina-1 in 2013. During 2006, N was ~ 70 at all continental stations and somewhat higher ~ 90 at Zagreb-3 and Kutina-1, while N ~ 30 was found at most continental stations in 2012.
PM10 and PM2.5 measurements from 7 rural background stations in the period from 2011–2014 were used to assess average regional PM levels in Croatia and conduct the comparison with the average urban values. Calculated (PM10 )year for rural background stations are shown inFig. 3. For the background stations in the central part of Croatia comprising stations: Plitvice, Parg, Višnjan and Polača, values (PM ) ~ 15 μg/m3 were found for all analysed years
The annual limit value for PM2.5 was exceeded only at continental rural background station Kopački rit (not shown) that is located at the northeastern part of Croatia on the border with Hungary and Serbia indicating higher regional concentrations which is consistent with the gridded emissions (Fig. 4). The lowest (PM10 )year and (PM 2.5 )year among all analysed PM concentrations were found at coastal rural background stations in the southern part of Croatia with yearly average values between 5 μg/m3 at Hum and 10 μg/m3 at Žarkovica station
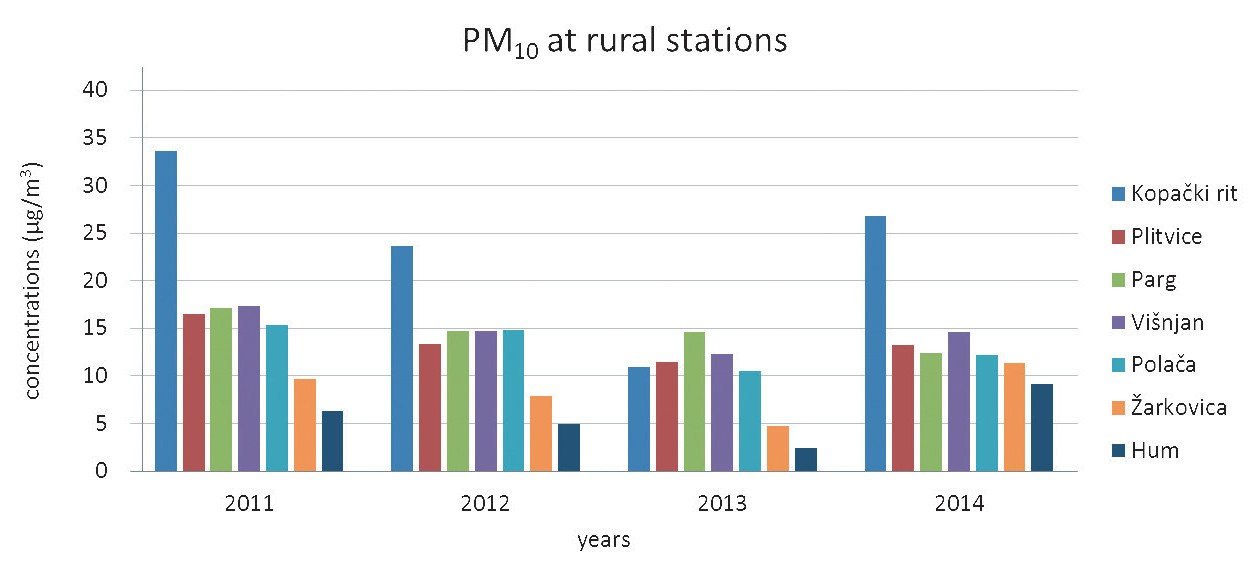
The N > NLV at rural stations was found only at Kopački rit in 2011 with N = 55. Over the Croatia there is a decreasing spatial gradient of rural background PM10 and PM2.5 levels from the continent toward the coast which is a consequence of different climatic and dynamical atmospheric processes that influence PM deposition on the coast. The significant decreasing trend in (PM10 )year found at continental urban stations that is most likely a consequence of the reduction in contribution of local emission sources was not evidenced at rural background stations where contribution in regional PM levels was almost at the constant level during the analysed period. The contribution of the background PM concentrations to the urban levels was determined through the ratio of rural and urban average annual concentrations. The results are shown inTab. 3 for the period from 2011 to 2014. Continental rural background station Kopački rit situated near urban station Osijek-1 has the highest average concentrations and indicates that the contribution to urban PM values at the eastern part of Croatia is extremely high with contributions from 80% to over 100% for all years except for 2013. Other continental rural stations situated in the northern and central part of Croatia contributed to the urban PM concentrations ~ 50%. At the coast rural background stations contributed significantly to the urban values with the share of ~ 80%.
The annual, inter-annual and daily variations of PM concentrations as well as their spatial distribution were further investigated. The yearly course of (PM10 )month exhibited seasonal variations with the highest (PM10 )month values during the winter and late autumn at all continental urban stations (selected stations shown inFig. 3). A decreasing trend in PM concentrations is found in Zagreb-1 and Kutina-1 while at coastal urban station Rijeka-2 trend was not identified. Significant deviations in (PM10 )day yearly course at continental ur- ban stations within analysed years were not identified, although (PM10 )month levels differed substantially among stations depending on the station location and the influence of local emission sources. The (PM ) ~ 60 μg/m3 was present during the colder part of the year while significantly lower 3 (PM10 )month ~ 25 μg/m were present during the warmer part of the year. At 3 Rijeka-2 almost invariable (PM10 )month ~ 20 μg/m was found. Seasonal and inter annual trend in (PM10 )month at both continental and coastal rural stations that are representative of regional and long-range transport was not observed.
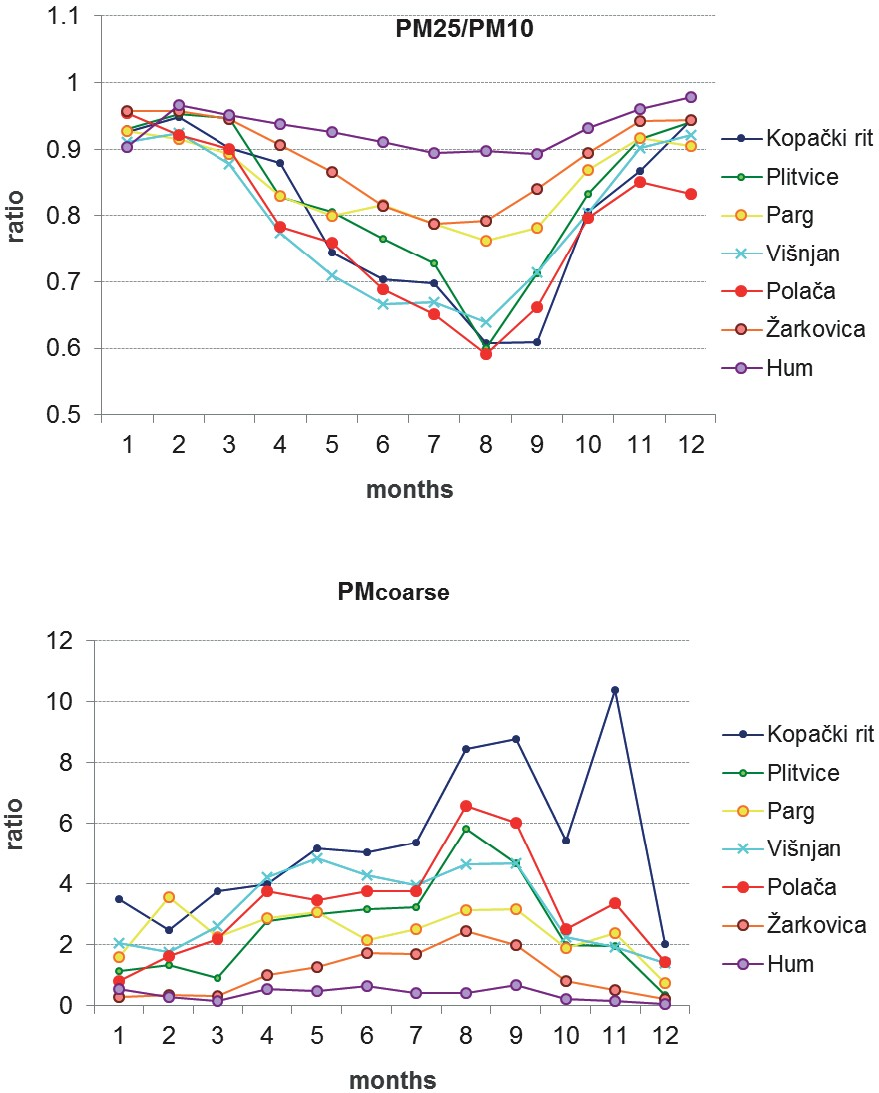
In order to further investigate the portion of PM2.5 in PM10 the monthly PM2.5 / PM10 average ratios and PMcoarse (i.e. PM10 minus PM2.5) concentrations were calculated from the observed hourly concentrations at rural background stations during 2011 (Fig. 5). Calculated yearly PM2.5/PM10 ratio values were ~ 0.7 and 0.8 at all rural background stations indicating that rural PM is mainly consisted of small particles as the contribution of PM2.5 concentrations to PM10 is ~ 80% at all locations. The highest, almost constant, PM2.5 / PM10 ratio ~ 0.9 (Fig. 5 upper panel) was found at Hum where PM concentrations were the lowest indicating that almost all PM is in the form of PM2.5. This is in agreement with the results of other studies that showed generally higher coarse fraction at the urbanized sites compared to the rural background locations (e.g.Querol et al., 2008). Since station Hum is far away from anthropogenic pollution sources and PM levels are mainly influenced by the natural sources such as sea-salt, it is likely that fine particles are formed through secondary aerosol production in the chemical reactions with primary aerosols such as DMS (dimethyl sulphide) (e.g. O’Dowd and De Leeuw, 2007). Seasonal trend in PM2.5 / PM10 ratio was also ascer- tained at other rural background stations in Croatia. During the colder part of the year PM2.5 / PM10 was higher than 0.9 at almost all stations and lower (in the range between ~ 0.8 at Žarkovica and Parg stations to ~ 0.6 at Kopački rit, Polača, Plitvice and Višnjan) during the warmer part of the year with pronounced mini- mum in August 2011. Seasonal trend in PM2.5 / PM10 ratio indicates that during winter the contribution of fine particles in rural background levels is significant while during summer the contribution from coarse particle intensifies. Monthly PMcoarse concentrations (Fig. 5 lower panel) are complementary to the ratios with the lowest PMcoarse values at Hum. Seasonal PMcoarse variations were opposite to PM2.5 / PM10 course with lower during winter and higher PMcoarse during summer. An increase in PM10 coarse concentrations was evident at Kopački rit and Polača during November, 2011 that may be related to the strong northeasterly wind episode when resuspension of crustal material from the ground contributed to the coarse component of the PM mass.
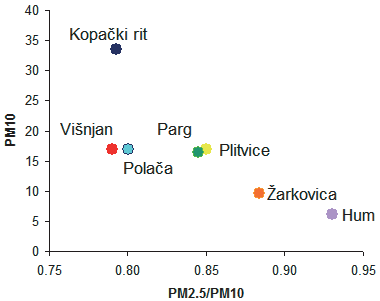
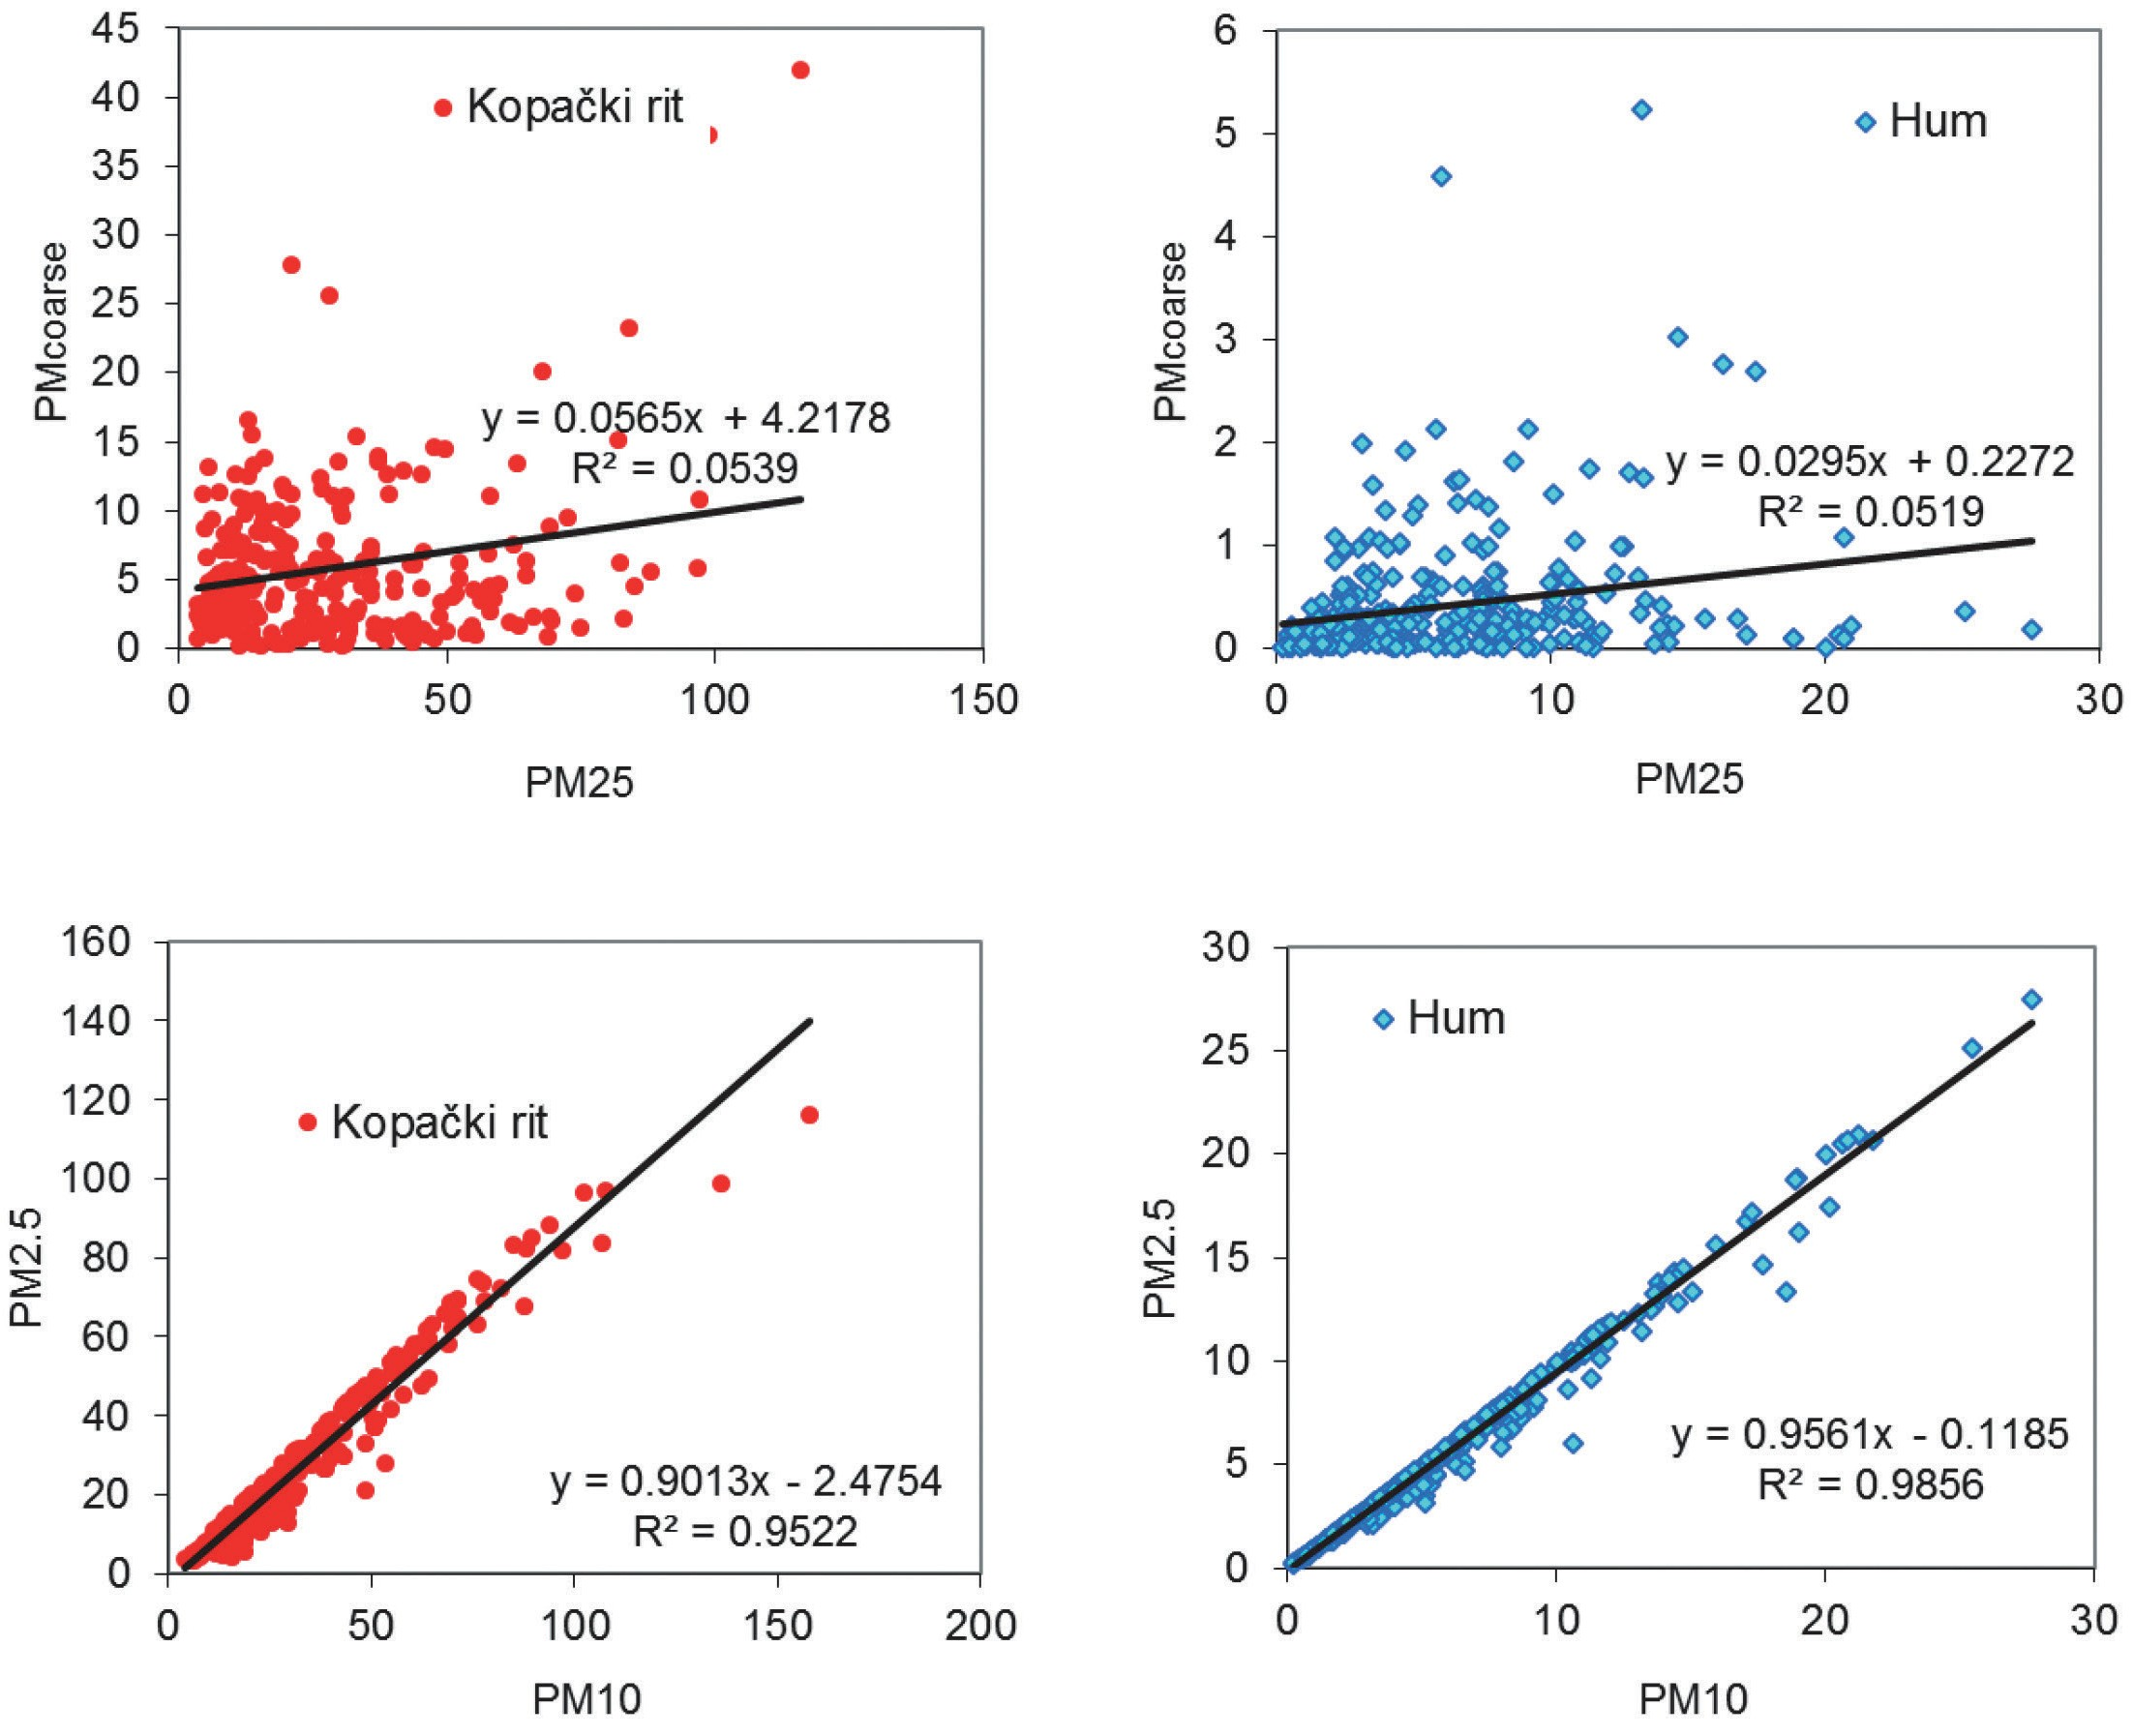
InFig. 6 the relation between annual PM2.5 / PM10 ratio and annual average PM10 concentrations at rural background stations is shown. Ratio of PM2.5 / PM10 is systematically decreasing with the increase in PM10 mass concentrations. The lowest PM10 concentrations with the highest PM2.5 / PM10 ratios were found for Hum. The lowest PM2.5 / PM10 ratio was present at Kopački rit with the highest PM10 concentrations mainly affected by regional transport from anthropogenic sources in the area.
Scatter plots (based onPutaud et al. (2010) but for daily average values) were determined between the daily average PM10 and PM2.5 mass concentrations and PM2.5 and PMcoarse. These are shown for two most distinct stations in rural back- ground network, i.e. Kopački rit and Hum (Fig. 7). Generally, PM10 and PM2.5 concentrations were exceptionally well correlated (R2 > 0.9) at all rural back- ground sites. Correlations between PM2.5 and PM10 concentrations indicate that PM10 and PM2.5 have the significant shared influence of meteorology, dispersion and transport as inPutaud et al. (2010). However, correlation between PM2.5 and PMcoarse was not established showing that there was no relationship between PM2.5 and PMcoarse concentrations which is valid for all background sites. This means that PMcoarse concentrations can generally not be inferred from PM2.5 mea- surements and that PM2.5 and PMcoarse are controlled by different sources and processes.
3.2. The analyses of meteorological parameters in relation to PM10 concentrations in Croatia in the period from 2006 to 2014
3.2.1. Temperature, relative humidity and PM concentrations
InFigs. 8 and9 normalised average hourly and monthly values of tempera- ture, relative humidity and PM concentrations are shown for selected rural and urban coastal and continental stations. Normalising is achieved by dividing the value by its mean value. Also shown on the plots is the 95% confidence interval in the mean. Daily courses in temperatures indicate higher variability at conti- nental stations while at coastal rural and urban stations average hourly temper- ature values exhibited lower variability. The largest differences between daily temperature maximum and night time temperature minimum values was ob- served at Plitvice, Parg and Kopački rit which are surrounded by forest. The smallest differences in hourly values during a day was observed at Hum and Žarkovica. Maximum average hourly temperatures were present in Polača ~ 20 °C while at Parg and Plitvice the lowest average daily temperatures ~ 12 °C were observed. Annual course was similar at all stations with minimum values during the colder part of the year and maximum values in July and August.
Average hourly relative humidity daily course was similar at rural and ur- ban continental stations with minimum values during early afternoon and maxi- mum during night while at Hum (~ 76%) and Žarkovica (~ 65%) humidity was high and almost constant during the day which is a consequence of the sea influence. Similar was observed at urban Rijeka station but with more variability in hourly relative humidity values due to urban influences. Maximum values in hourly humidity was observed at 7 local standard time (LST) at Kopački rit ~ 9% at Plitvice and ~ 90% and at Parg ~ 85%. The lowest hourly humidity was ob- served at Žarkovica. Annual course at Plitvice, Parg and Kopački rit indicate higher values during the colder part of the year a decrease in March, almost con- stant values during the warmer part of the year and an increase in autumn. At other stations average monthly humidity continuously decreased from maximum in February toward a minimum in August and again a sharp increase in autumn occured. Annual course of average monthly relative humidity at urban continen- tal station was similar to those at Plitvice, Parg and Kopački rit stations.
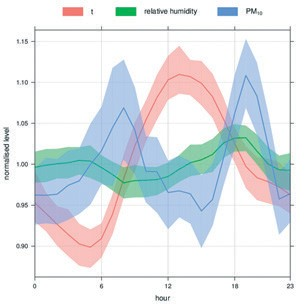
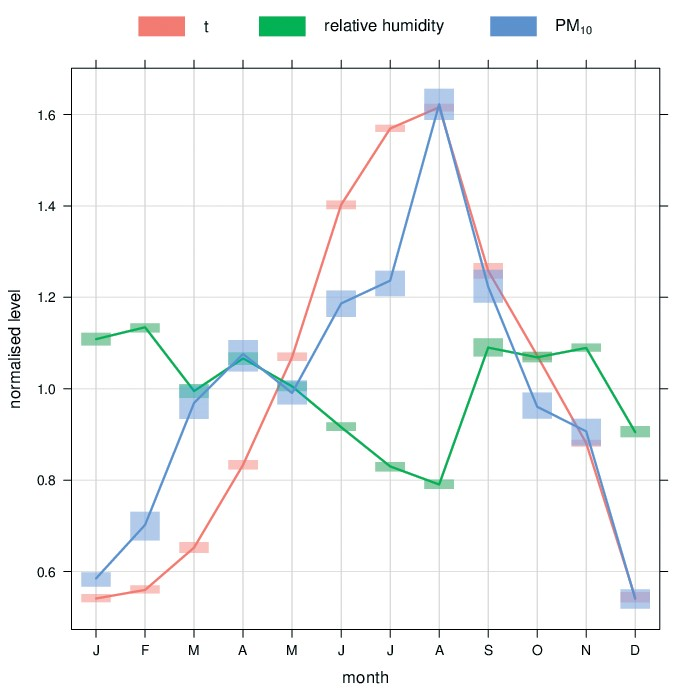
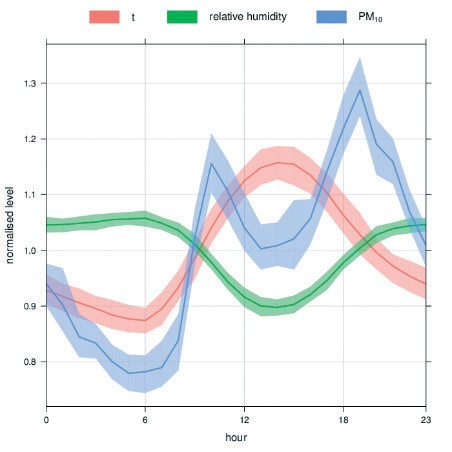
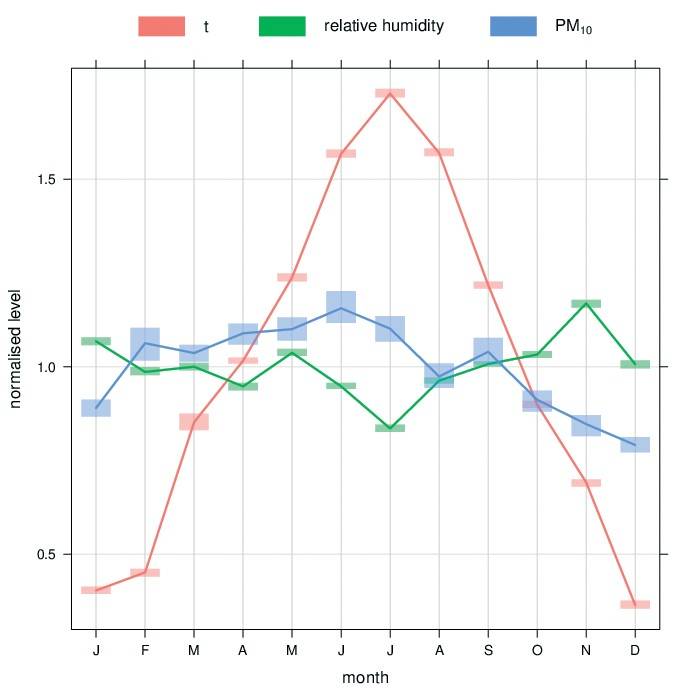
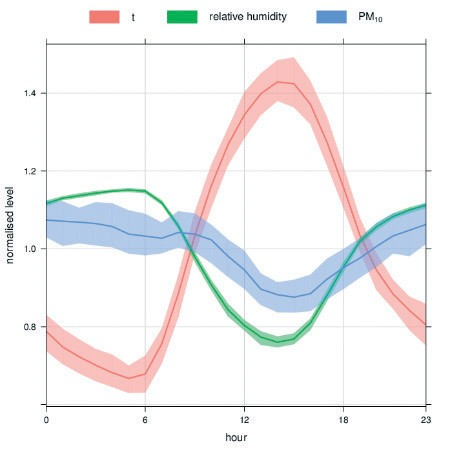
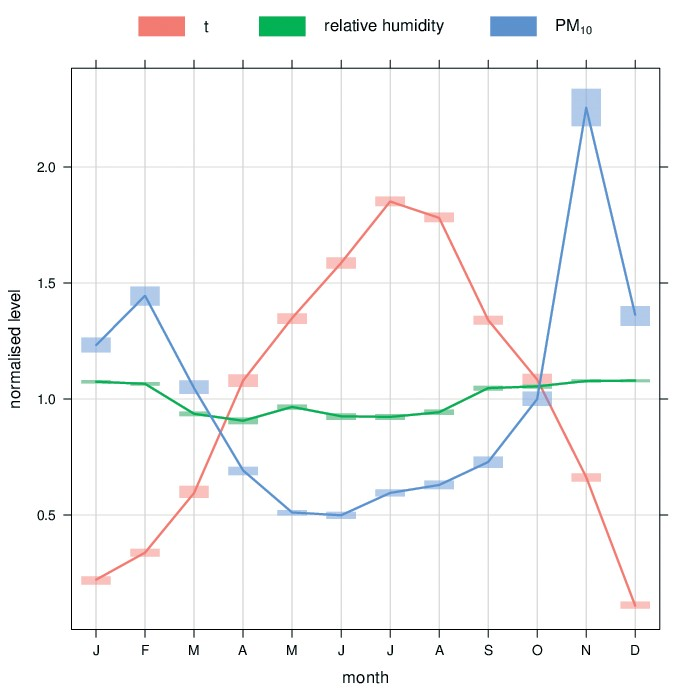
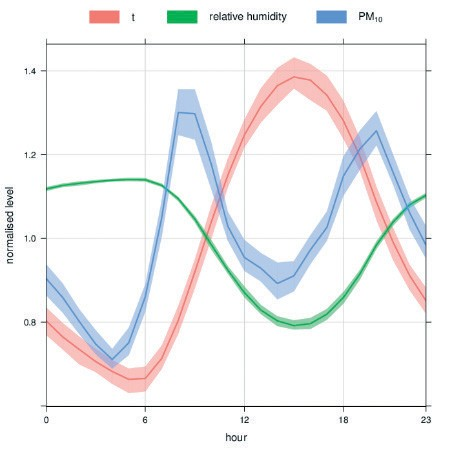
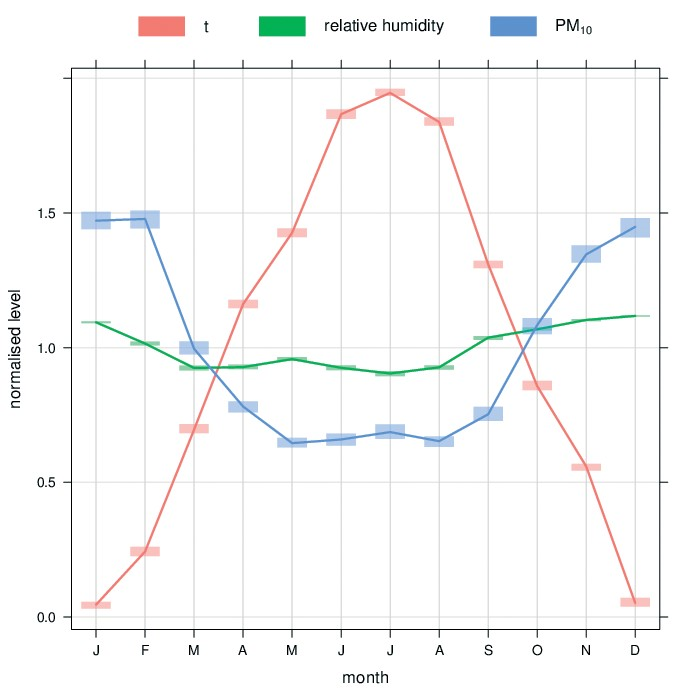
Daily course in hourly PM concentrations indicate two maximums at all urban and at rural Žarkovica and Polača stations one at 7 LST and the second in the afternoon around 6 PM. Hourly maximum values differed significantly between urban and rural stations with the highest values ~ 45 μg/m3 at Kutina-1 while at Polača ~ 16 μg/m3 and at Žarkovica ~ 8 μg/m3 were observed. Different daily course was found at Parg, Plitvice and Višnjan where a continuous increase in hourly PM concentrations was detected staring at 6 LST from minimum val- ues ~ 13 μg/m3 and reaching a maximum value ~ 17 μg/m3 around 18 LST after which a decease started. At Hum and Kopački rit the daily course was opposite with maximum values around 6 LST and minimum in the afternoon around 15 LST. However daily variability at Hum was significantly lower than in Kopački rit. Differences in daily maximum and minimum PM values was ~ 1 μg/m3 at Hum and 16 μg/m3 at Kopački rit. Yearly course was similar at all rural and ur- ban stations with maximum values during the colder part of the year and minimum during the warmer part of the year except for rural coastal station Žarkovica where yearly course was opposite with maximum in July and urban coastal station Rijeka-2 where maximum also during June and July.
3.2.2. Wind roses and bivariate polar plots
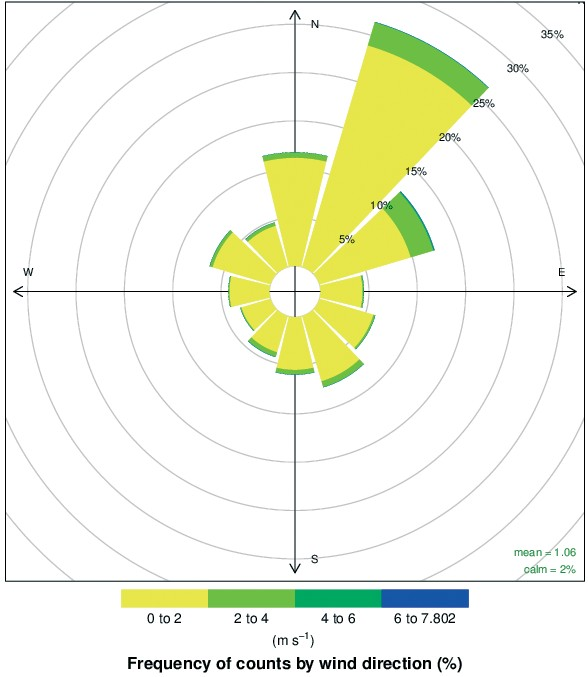
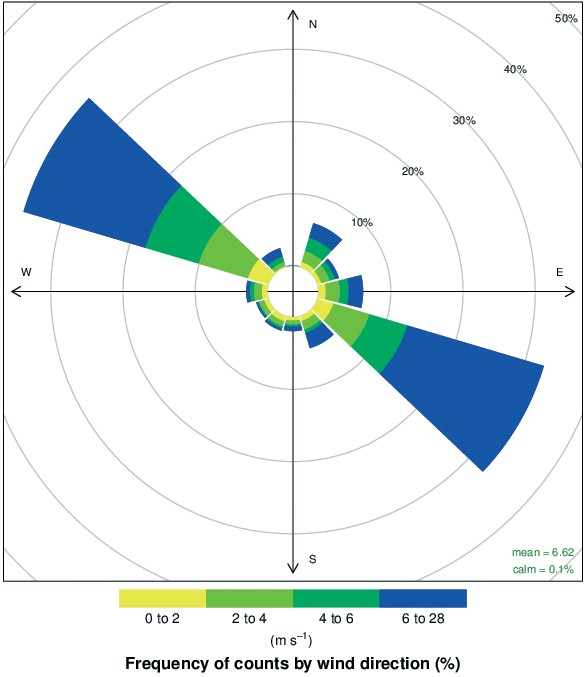
InFig. 10 wind roses for Kutina-1 in the period from 2006–2014 and Hum for the period between 2011-2014 are shown. The city of Kutina-1 is situated in the continental, plain part of Croatia called Slavonija in Pannonian valley that is mainly characterized with lowland and flat horizontal surface. Wind rose indi- cate the prevalence of mainly light north-easterly wind with the wind speeds ranging from 0–2 m/s. Wind rose show that the most frequent wind is from NW and SE directions covering the whole range of wind speed values up to 28 m/s and much stronger than in Kutina. This is expected as coastal station Hum is situated in a complex orography where the impact of strong winds sirocco (SE) and etesian (NW) are present. The wind rose is a very useful way of summarising meteorological data particularly for showing how wind speed and wind direction conditions vary by year.
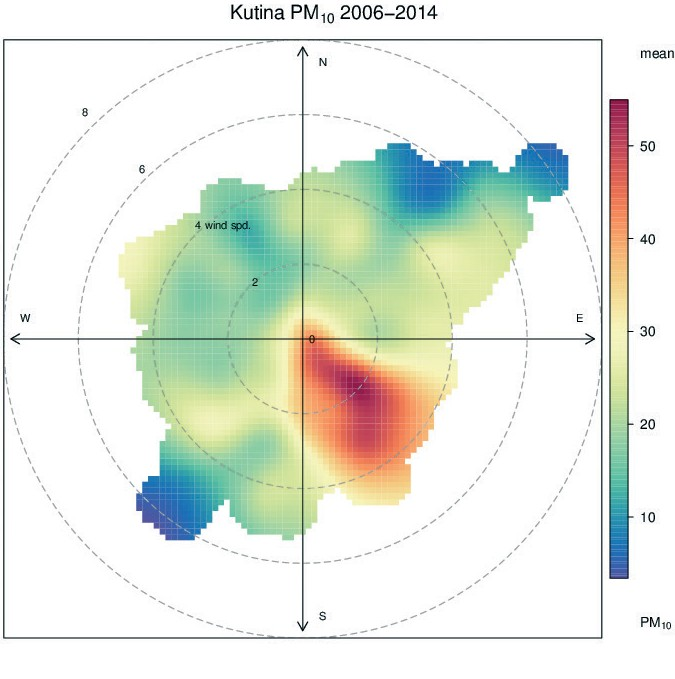
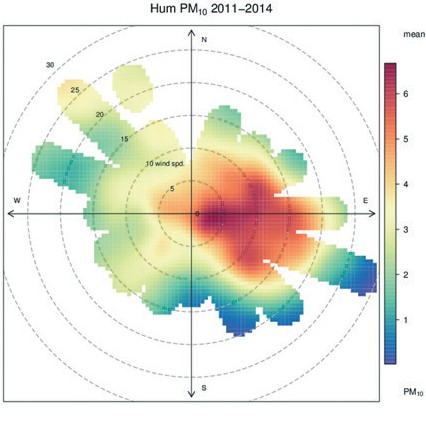
The bivariate polar plots indicating the variation of observed PM concentra- tions by wind speed and wind direction are plotted for Kopački rit and Hum inFig. 11. For Kutina-1 the potential sources of PM concentrations are situated SE from the monitoring site where highway and petrochemical industry are located. In Hum bivariate polar plot indicates eastern wind sector as the most fequent for the occurence of the higher concentrations which are ~ 6 μg/m3 and significantly lower than in Kutina-1. The similar analysis of wind roses and bivariate polar plots at all sites (not shown) indicated that the occuence of higher concentrations is not usually related to the most frequent wind sectors. Similarly as for Hum at Žarkovica the highest PM concentrations are occurring during SE winds with wind speeds ~ 5m/s. At urban coastal station Rijeka-2 the highest concentrations are originating from south, while in urban continental station Osijek-1 two situa- tions with high concentrations are identifiend: one taking place during the low wind speed conditions indicating local influences and another occuring with higher wind speds from N and NE sectors. In Kopački rit, rural station relatively near Osijek-1 higher concentrations occurred during the light wind conditions. However it should be pointed that measurements in Kopački rit indicated signifi- cant underestimation of winds from northern sector which might be the conse- quence of inadequate siting conditions and will be further investigated. At Zagreb-1 station that is dominantly under the influence of traffic, higher mean concentrations are present also during the low wind speeds and winds from NW and E, but the highest concetration are clearly under the influence of local sources i.e. traffic. At Parg low wind speeds < 5 m/s from SE sector and in Plitvice NE winds with speeds in the range between 8 and 10 m/s mostly contributed to the highest observed concentrations while at Polača those were pesent primarely during the calm wind conditions.
4. Discussion and conclusions
The aim of the research was dedicated to the analyses of the urban and rural PM10 and PM2.5 concentrations in Croatia. The analyses of air pollution with PM were conducted due to: high observed PM levels, large regional emission sources and limited regional research studies. Datasets on PM mass concentrations are acquired with different measurement approaches: gravimetric method, β-attenuation and by the optical particle counters of Grimm 180 instrument from 12 sites among which 7 new rural background stations with the measurements of PM10 and PM2.5 in Croatia. Main conclusions are:
Calculated annual average (PM10 )year were considerably below the de- fined limit value of 40 μg/m3 at all available urban and rural stations in Croatia and decreasing trend in average annual values as well as in the number of excess days was observed. High level of PM2.5 up to 80% at con- tinental rural background station comparable to the PM2.5 level at urban background site was found which is in agreement with the research re- sults established for Central Europe (e.g.Juda-Rezler et al., 2011). European aerosol phenomenology studies conducted by several authors (Van Dingenen et al., 2004;Putaud et al., 2004;Putaud et al., 2010) have shown that the annual background PM10 and PM2.5 concentrations for con- tinental Europe are strongly affected by the regional aerosol transport. Significant contribution up to 76% of the long range transport in the urban PM2.5 concentration was found in Finland (Pakkanen et al., 2001; Karppinen et al., 2004).
The pronounced spatial gradient in PM10 and PM2.5 concentrations de- creasing from the north to the south, namely from the continent toward the coast for urban and rural sites in Croatia was revealed both in average concentrations and the number of exceedance. Characteristic geographic and climatological conditions as well as intrinsic atmospheric processes influencing PM concentrations in the air such as: local wind circulation, vertical diffusion and deposition were considerably different at coast than inlands.
As in other parts in Europe, a significant correlation between the PM2.5 and PM10 average mass concentrations calculated at 7 rural background sites in Croatia was found indicating that both concentrations are govern by the same meteorological processes. Also PM2.5 / PM10 ratios at rural sta- tions differ from each other to a larger extent during the warmer part of the year depending on the level of PM concentrations. There is no relation- ship between PM2.5 and PMcoarse at rural background stations meaning that those are controlled by different processes. The content of PM2.5 in PM10 was high at all rural background stations and a gradient of PM2.5 / PM10 oriented from the south to the north, i.e., from the coast to the continent, inverse to the gradient of PM10 and PM2.5 concentration, was identified.
Rural site-specific PM2.5 / PM10 ratios ranged from 0.6 to 0.9 during the warmer part of the year while during the colder part of the year ratios ranged from 0.85 to 0.98 which is in accordance with conclusions ofPutaud et al. (2010). They found that PM2.5 / PM10 ratios increase with the increase of PM10 levels at single station which is generally the case in Europe during the colder part of the year. The seasonal variability in ra- tios is less pronounced for the stations with lower PM concentrations in- dicating the same PM2.5 composition and contributing sources during the year. However, our results lead to conclusion that the contribution of PM2.5 in PM10 is higher and less variable during the year for the lower PM10 concentrations at rural background stations and that ratio is not undependable of PM10 levels. This is reasonable since higher contribu- tion of the PMcoarse is found mainly at kerbside urban traffic stations in Europe.
Daily courses in average hourly temperatures indicated higher variability at continental than at coastal stations while annual course of temperature was similar at all stations with minimum values during the colder part of the year and maximum values in July and August opposite to annual courses of relative humidity and PM. The only exception in yearly PM courses was found at Žarkovica where maximum was present during sum- mer. This might be a consequence of the summer forest fires frequently taking place at coast. Average daily course of hourly relative humidity was similar at rural and urban continental stations with minimum values during early afternoon and maximum during night while at Hum (~ 76%) and Žarkovica (~ 65%) humidity was high and almost constant during the day which is a consequence of the sea influence. Bivariate polar plots indi- cated location of sources which will be further investigated in future studies.