
INTRODUCTION
UVOD
The technique of combining the predictions of many classifiers, for the creation of a single, collective classifier (ensemble classifier), has preoccupied researchers (Breiman 1996,Clemen 1989,Perrone 1993,Wolpert 1992,Opitz and Shavlik 1996). A collective classifier is effective when it is more accurate than any classifier that participates in the formation of a group and consists of classifiers whose errors are at different points in the vector space of input. The two most popular methods of creating collective classifiers are the method of boosting and the method of bagging (Freund and Schapire 1997,Drucker 1997). These techniques are based on data sampling (training data) and result in different training data sets for each classifier of the total classification system (Opitz and Shavlik 1996).
In a typical scenario of supervised learning, a set of samples are available, which are called the training set. The classes of these samples are known and the goal is to construct a model that would classify new samples in classes. The learning algorithm that builds the model is called an inducer. The basic idea of collective classification is the weighting of different classifiers and combining them into one single classifier, which performs better than each of the individual classifiers. When making a decision, people follow the same technique, taking various opinions and then evaluating those views for making the final decision (Rokach 2009).
The productivity of a forest is described as the site’s ability to produce timber or forest biomass (Skovsgaard and Vanclay 2013). Various approaches have been developed to site productivity assessment (Pokharel and Dech 2011). However, the typical approach for site quality assessment is based on the strong correlation between height growth and volume. Hence, the site index has become an important tool in assessing site productivity (Clutter et al. 1983). Heigh-age observations are plotted on a graph and are used in assessing site productivity (Laubhann et al. 2009). Site index curves are developed via three methods: the parameter prediction method, the guide curve method and the difference equation method (Clutter et al. 1983).
The purpose of this paper is to apply the boosting method for creating a collective classifier, which classifies forest stands in site qualities, with input of the altitude, slope, age and canopy density.
MATERIALS AND METHODS
MATERIJALI I METODE
Study area – Data collection
Područje istraživanja – Prikupljanje podataka
Data collection came from the management plan of the forest of Dadia-Lefkimi -Soufli (Consorzio Forestale Del Ticino 2005). Situated at the southeast end of the Rhodope mountain range in northeaster Greece, at the crossroads of two continents, the National Park of Dadia-Lefkimi-Soufli Forest is of exceptional ecological significance at the European level (UNESCO World Heritage Centre 2012-2015). The elevation ranges from 10 to 604 m. Soils are shallow to moderate deep, exhibiting various textures. The mean annual temperature is 14.3 oC and the mean annual precipitation is 652.9 mm (Consorzio Forestale Del Ticino 2005). The main tree species of the forest are Pinus brutia and Quercus spp. These species create pure and mixed formations; there is also Pinus nigra, mainly in reforestations, and as individual trees (Consorzio Forestale Del Ticino 2005).
From 403 description sheets (i.e. 403 records-cases), the minimum and maximum altitude (m), the minimum and maximum slope (%), the minimum and maximum age of trees (in years), the minimum and maximum canopy density and site quality (quality Ι, ΙΙ, ΙΙΙ) were used. Quality III included the stands where, as referred in the description sheets, the site quality was III, IV or V. Consequently, three training sets were selected: one for site quality I (25 stands), one for site quality II (94 stands), and one for site quality III (284 stands).
In the description sheets of each stand, more than one site quality categories appear. These categories are not referred to different species. The determination of these categories was based on the composition of each stand and on the degree of species mixture. The initial site characterization for each species was made using site index curves. These site index curves were developed for each of these species in forests of other Greek areas (Consorzio Forestale Del Ticino 2005).
The altitudes and slopes were replaced by one variable, named “topography”, applying theAnderson-Rubin (1956) method. This method adjusts regression least squares formula to produce factor scores, uncorrelated with other factors, and uncorrelated with each other. The vector of observed variables, i.e. altitudes and slopes, is multiplied by the inverse of a diagonal matrix of their variances. The resulting new variable has an average of 0 and a standard deviation of 1. Using the same method, the ages were replaced with one variable, named “age” and the canopy densities with the variable “canopy density”'. The new variables "topography", "age" and "canopy density" were used as predictors, i.e. as input, while the site quality was used as the target variable.
As canopy density is considered the ratio of the sum of the areas of canopy projections (if we put one projection next to the other) divided by the area that these trees occupy (Dafis 1992). Canopy density can take values from 0 to over 1. The more the crowns are tangled, the higher the canopy density becomes. Canopy density is different than ground cover, since ground cover can take values up to 1.
In this study, different site classification predictions could have been developed for pine, oak and pine – oak formations. Unfortunately, even though the area of the mixtures and the species are given in the description sheets, parameters used for site classification were presented for the total stand area. This is the reason why one site classification, regardless of the species, was developed. Moreover, for the same reason, the dominant site quality (occupying the largest forested area of the stand) was used for the site productivity characterization of the stand. There weren't any different topographic features or canopy density data for different site qualities in each description sheet.
Boosting algorithm
Algoritam jačanja klasifikatora
For the creation of a single collective classifier (ensemble classifier), that will classify sample trees and/or sample surfaces in site qualities, with the input of the topographical features (altitude and slope), age and canopy density, we implemented the boosting algorithm (Freund and Schapire 1997,Drucker 1997). The application of the algorithm was done with the statistical package SPSS v. 21.0 (IBM 2012).
The boosting method can be used with any type of model and can reduce variance and bias in the forecast, i.e. to increase the accuracy of the model. Boosting produces a sequence of components, namely the main (base) models, each of which shall be drawn up by the entire set of data. Before drawing each successive component, records-cases are weighted based on the errors (residuals) of the previous component. The cases with large residuals relatively weight more, so the next component focuses on better predictions of these cases. All together the components-models compose a single model (ensemble model). The single model provides values for new records using a combination rule, depending on the scale of measurement of the target variable, i.e. the dependent variable (analog or categorical).
Boosting model measures
Mjere modela jačanja klasifikatora
Accuracy is calculated for the naïve model, the reference model, i.e. the simple linear model, without application of boosting and bagging, for the ensemble model and for the basic models.
For categorical target variables, the accuracy is (IBM 2012):
where:
NTotal number of records.
KNumber of records-cases in the training dataset.
II(π) For any condition π, II(π) is 1 if π hold, and 0 otherwise.
fkFrequency for the k-th record.
ykTarget value for the k-th record.
Predicted target value of the k-th record of the m-th bootstrap sample.
Tm Model for the m-th bootstrap sample.
XkPredictions for the k-th record.
For the naïve model, is the mode for categorical target variables (IBM 2012).
RESULTS
REZULTATI
ExploratoryDataAnalysis
Istraživačka analiza podataka
Intable 1 the basic descriptive statistics of the variables of all data are given.
Importance of the estimators
Važnost procjenitelja
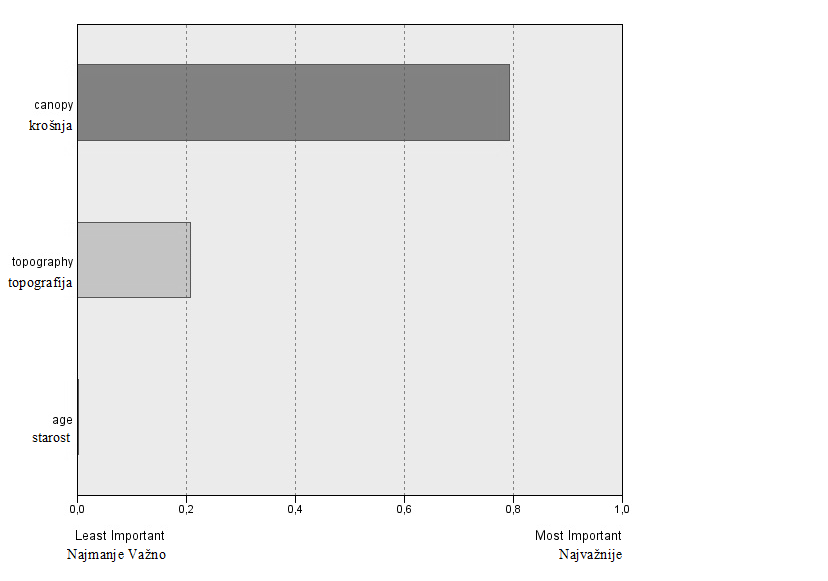
The term "importance" refers to the relative importance of each estimator in the forecasting model for the given accuracy of the model. The importance can take values from 0 and 1. The rank of estimators (the predictors) as to their relative importance is given infigure 1. If we focus on the accuracy of the classification of the stands in site qualities (the meaning of the boosting algorithm), most important, with importance equal to 0.79 is the canopy density, followed by the topography (importance = 0.21) and age (materiality < 0.01) (Figure 1).
The correct classification rate reached 98.59%, in site quality III (properly classified the 280 of the 284 stands). The correct classification of stand in site qualities I and II was 4% and 77%, respectively. For a more analytical presentation of classification, one can refer toTable 2, which is derived from the confusion matrix (Table 3).
DISCUSSION
RASPRAVA
The main tool for the evaluation of site productivity or site quality is site index (Van Laar and Akca 2007). In site index models, the height growth of dominant, codominant or of trees having certain characteristics are used (Van Laar and Akca 2007). There is a huge number of publications regarding site index models (Huang 1997;Krumland and Eng 2005). However, site quality is related to topographic features (seeDafis 1986;Vanclay 1992;Barnes et al. 1998;Papalexandris and Milios 2010;Milios et al. 2012) as well as to other environmental indicators like understory vegetation, soil physical and chemical properties, foliar nutrients, climatic data, soil properties etc. (seeKayahara et al. 1995, McKenney and Pedlar 2003,Bontemps and Bouriaud 2014,Watt et al. 2015). In Greece, soil depth is strongly related to site productivity, since it acts as a water storing reservoir during dry period (Dafis 1986;Hatzistathis & Dafis 1989) and it has been used in research studies for the site quality determination (Papalexandris and Milios 2010;Stamboulidis et al 2013).Adamopoulos et al. (2009) andAdamopoulos et al. (2012) have used soil depth in combination to several other parameters, for the site quality distinction in reforestations found in the study area of the present study.
Similarly, topography is the second more important variable (importance = 0.21) in the classification of the stands in site qualities using boosting method. Topography incorporates slope, and slope is related to soil depth. Usually higher slope leads to lower soil depth (seeDafis 1986). In the present study, low productivity sites (site quality III) exhibit greater lowest and highest slope, compared to productive and medium productivity sites (site qualities I and II).
The most important variable (importance = 0.79) in the classification of the stands in site qualities is canopy density. A higher value of canopy density implies higher amount of photosynthetic tissues for a given area, being an indication of greater production ability. Canopy photosynthetic capacity is related to site productivity (Coops et al. 1998). According toDafis (1986), in productive sites plants can endure heavier shade. As a result, in productive areas a higher canopy density is expected, compared to that of medium and low productive locations, since under the crowns of overstory more trees can survive. Moreover, in poor sites trees' crowns are small, as a result of slow or lack of differentiation (Oliver and Larson 1996). In the present study, low productivity sites (site quality III) exhibit lower lowest canopy density, compared to sites of high and medium productivity (site qualities I and II). However, canopy density is influenced by many factors, such as silvicultural treatments or other disturbances, stand development stage and species ecology. In particular, in the present study cuttings from the local residents and grazing strongly affected vegetation structure in the past, while silvicultural interventions in the frame of forest management are taking place (Consorzio Forestale Del Ticino 2005). Moreover, as it is referred in the description sheets of the stands, pine formations (mainly) of Pinus brutia, oak formations as well as mixed formations of pines and oaks occur in the study area (Consorzio Forestale Del Ticino 2005). The different shade tolerance of the species, with their different position in the stand stories (overstory, middlestorey or understory) undoubtedly determines canopy density.
Even though canopy density is estimated in the form of lowest and highest values, and the influence of species mixture and stand vertical structure are not weighted up in the model, the correct classification of stand in site qualities I and II was 4% and 77%, respectively, while in site quality III was 99%. If we consider that the initial site classification comprised over 70% of the Dadia-Lefkimi –Soufli forest area in site quality III (Consorzio Forestale Del Ticino 2005), then the usage of the boosting method for creating a collective classifier for site qualities in the studied forest can be characterized as fully successful.
The development of alternative methods of site classification, using topographic features instead of growth of trees having certain characteristics, will be notably useful in bare and intensively degraded areas with sparse distribution of plants (seeSmith et al. 1997). In this case, the usage of three site productivity categories (site qualities) instead of five or six is more practical and feasible in restoration of former forest lands. Furthermore, in areas were microtopography is highly variable, resulting in chances of site condition in rather small spatial scales (see also Papalexandris and Milios 2010), topographic features in combination with canopy density estimations can be used for site classification. In this case, two or three site productivity categories are preferable, since the frequent changes of site conditions make difficult to apply a more complex system. On the other hand, the adoption of canopy density as a variable for site classification models is very efficient, in cases where the vegetation is disturbed and the growth of most trees has been affected by these disturbances. Site index models based on dominant and codominant trees assume that these trees where always in that status and their growth did not retarded from disturbance factors (Smith et al. 1997,Raulier et al. 2003). Highest and lowest canopy density seems to be affected in a lower degree than the growth of dominant and codominant trees by disturbances (including silvicultural treatments). Only in extreme cases where trees' density in the whole area has been determined by intense disturbances, then the two extreme values of canopy density is affected. On the other hand, mean canopy density is a parameter that is more sensitive to disturbances that influence trees' density in any area of the stand.
In this study, site classification is not based on soil analysis (Bravo and Montero 2001;McKenney and Pedlar 2003) or phytosociological surveys and (or) other vegetation analysis approaches that are strongly affected by disturbances (Barnes et al. 1998). Apart other deficits, the collection of this kind of data and analysis are expensive (seeSmith et al. 1997), compared to the parameters used in the present study, since no background information regarding the tree age or other difficult to access information are needed. Moreover, in a quite high degree, the site classification using these parameters is not influenced by disturbances.
The boosting method for creating a collective classifier for site qualities, obviously will give far more accurate classifications of site productivity if a more sophisticated scheme of data collection is used. Since site productivity may present significant spatial variation (Skovsgaard and Vanclay 2013), a stand can exhibit more than one site productivity categories. Consequently, stand area must be divided in parts, regarding some characteristics that strongly influence productivity. Topography is such a factor. Thus, in the first step, a stand is divided in rather homogenous areas regarding the shape of the terrain (conceive, convex, inclined plane and other), the exposure or another characteristic that is considered crucial for site productivity determination. In a second step, inside these areas, easily measured or estimated parameters for the site classification, as in the present case, can be used for the estimation of site productivity, such as highest, lowest and mean slope, highest and lowest canopy density. The mean canopy density can be used in areas that are not strongly influenced by disturbances. Moreover, other parameters can be used for the estimation of site productivity; thickness or other characteristics of organic layer of forest floor are some of them (seeLaamrani et al. 2014).
Some of the above - mentioned parameters can be easily measured using remote sensing data, but for others like canopy density, field observations are obligatory for their estimation.Pinno et al. (2009) refer that field measurements are needed in order to have precision in the prediction of site productivity within a forest management unit for Populus tremuloides in the Boreal Shield of Quebec.
In the case of mixed stands, either in groups or in a tree to tree basis site productivity, classification has to be conducted for each species and tree to tree mixture (Aertsen et al. 2012; Skovsgaard and Vanclay 2013). So, for each species or mixture, the above mentioned two-step process have to be applied.
CONCLUSIONS
ZAKLJUČCI
The usage of boosting method for creating a collective classifier for site qualities in the studied forest can be characterized as fully successful. The application of this method using altitude, slope, age and canopy density as input, do not need background information regarding the tree age and (or) other information that is difficult to access. Moreover, in a quite high degree, this site classification is not influenced by disturbances. The boosting method for creating a collective classifier for site qualities, obviously will give far more accurate classifications of site productivity, if a more sophisticated scheme of data collection is used.