
INTRODUCTION
This paper presents tourist attitudes regarding the tourism offerings of Rijeka and the Opatija Riviera in 2014 and 2016. Both cities have been investing a lot of effort in the enrichment and improvement of their tourism offerings in order to provide more appealing and satisfactory experiences for their tourists. Additionally, in 2016 a new strategic tourism planning document has been developed for the Primorje-Gorski Kotar County that included definition of the tourism strategic orientation and goals for the two mentioned destinations. Monitoring tourist satisfaction is of great importance for destination management aiming to ensure long-term sustainable tourism development and gain loyal and satisfied tourists. Therefore, the main purpose of this study is to find out whether there are any differences in attitudes towards the destination tourism offering between tourists visiting these destinations during the summer of 2014 and those visiting them during the summer of 2016. Although, it might not be reasonable to expect significant changes within three years, the results of this study could be also a basis upon which future research results could be compared, i.e. it will be possible to track if developing a tourism strategy and actions plans resulted with higher tourist satisfaction level or not. Findings prove that tourists of 2016 were more satisfied with all offering elements. The relationship between the importance of various offering elements and the satisfaction with the same elements was tested separately for 2014 and 2016. The results were evaluated by using Importance-Performance Analysis (IPA), a useful technique that can provide managers with information on possible problems and shortcomings of the offering. In that way, asGriffin and Edwards (2012) underline, destination managers can assign priorities to measures that are designed to further improve tourists’ experiences. Thus, the results of this study should lead to recommendations for destination management concerning the way in which they can use tourist attitudes as an additional tool to improve parts of their offering in order to generate higher overall tourist satisfaction rates. Hence, the study results could serve as a guide for future planning and successful destination management.
1. TOURIST SATISFACTION – THEORETICAL BACKGROUND
The success, competitiveness and sustainable development of a destination greatly depend on the level of satisfaction evoked in tourists who are visiting it. Satisfaction could be defined as the outcome of the consumer’s evaluation of a service/product based on a comparison of their perceptions of it deliver with their prior expectations (Aktaş et al., 2009). The more detailed the knowledge on tourists’ attitudes towards the destination’s offering, the better destination marketers can customise their offering in order to make it more appealing and satisfactory for their visitors. Failure to achieve such an understanding of tourists’ attitudes is likely to lead to their lower levels of satisfaction, loyalty, and intention to repeat the experience (Deng and Pei 2009;Kim et al. 2008). On the other hand, a high level of satisfaction leads to a positive attitude towards the product, service or experience that has been purchased and can positively influence future behaviour (Esbjerg et al. 2012). Therefore, it can be stated that a high level of satisfaction leads to greater customer loyalty to certain a product, service or destination (Andriotis et al. 2008;Hui et al. 2007;Matzler et al. 2004;Naidoo et al. 2010;Yoon and Uysal 2005) and is very important for repeat business and word-of-mouth advertising (Matzler et al., 2004;Meyer 2006). In addition,Deng (2007) underlined that, among other things, customer satisfaction can also be a driver of financial performance. Service quality and satisfaction have been in the focus of both tourism and marketing because, asSellick (2004) pointed out, they may be used as indicators of profitability as well. AsAguilo Perez and Juaneda Sampol (2000),Craggs and Schofield (2009) andSerra et al. (2015) found, satisfaction with the holiday also has a positive effect on visitor spending. Due to the fact that a high level of tourist satisfaction is of great importance to a destination’s future development and competitiveness, destination management, among other activities, involves carefully monitoring tourist satisfaction levels and using these as basis in future decisions processes.
As many authors have underlined (i.e.Alegre and Garau 2010;Chi and Qu 2008;Yoon and Uysal 2005), overall satisfaction with a destination is seen as a result of tourists’ perceptions of different attributes of the destination. Tourists’ satisfaction with a destination’s offering is very complex since, asWang (2016) points out, their overall destination experience is a sum of the large number of individual experiences that occur during their stay at the destination. Hence, when it comes to the measurement of complex constructs, such as satisfaction, it is recommended to apply a multi-item approach, since the measurement of satisfaction with only one indicator (i.e. overall satisfaction) does not ensure optimal results (Bruhn and Grund 2000,Alegre and Garau Taberner 2011;Fuchs and Weiermair 2003). In other words, in order to gain higher-quality information on tourists’ satisfaction with a destination offering, it is necessary to investigate the extent to which tourists are satisfied with each attribute of the destination offering. Therefore, following previous research, this study measured tourist satisfaction with 22 different offering attributes (in addition to overall satisfaction). In that way detailed information was obtained on tourist attitudes towards the destination offering.
As tourist satisfaction is seen as one of the most important sources of a destination’s competitive advantage (Bieger 1998;Ritchie and Crouch 2000), it is that more important to monitor it on a regular basis.Bernini and Cagnone (2012) also underline that regular satisfaction monitoring will ensure more efficient policies and destination management, aimed at meeting tourist needs and preferences.
2. METHODOLOGY AND DATA COLLECTION
Two tourist on-site-surveys were carried out, one during the summer months of 2014 and the other during the same months of 2016. The analyses were carried out on a sample of 1198 respondents, of which 523 were tourists who visited Rijeka and the Opatija Riviera during 2014 and 675 were tourists visiting in 2016. The present study was conducted with the use of a questionnaire provided in four languages (Croatian, English, Italian and German). The survey was conducted in order to examine the tourists’ satisfaction regarding various offering elements, such as hospitability of residents and employees, environment characteristics, accommodation facilities, and all other facilities and features important for tourists. In addition to measuring the satisfaction level, the questionnaire also measured how important each tourism-offering element was to tourists. The other parts of the questionnaire covered the socio-economic and demographic characteristics of respondents as well as their vacation characteristics.
The relevant data was processed using the statistical package SPSS for Windows 24.0. Data analysis included descriptive statistics for sample profiling, paired sample t-tests, independent t-tests and Importance–Performance Analysis (IPA).
In order to obtain a representative sample, data on arrivals, month of the visit, destination where respondents were staying (Rijeka or Opatija), tourist origin, and type of accommodation were obtained from the Croatian Bureau of Statistics. As expected, the data obtained revealed that the majority of respondents are foreign tourists (presenting 83.9% of the sample) and that the majority of these foreign tourists are from Germany (15.3% of the whole sample). Females account for 47.2% of the sample, while the majority of the respondents hold college or university degrees (64%). It can also be noted that the majority (37.5%) of respondents have an average monthly family income between 1001 and 2000€, while only 19.3% of respondents have an average income of more than 3000€. The respondents are on average 42.1 years old (Table 1). When comparing the 2014 and 2016 sample, a statistical significant difference was found when country of origin and educational level was concerned.
Table 2 summarises the trip characteristics of the respondents. It can be noted that the vast majority of them individually organized their trip (80.8%) and stayed in a hotel (52.0%). In addition, 61.0% of the respondents came to the destination by car and 25.0% by bus. Most of the respondents came to the destination with a partner (34.6%) or with family members (28.8%). The respondents on average stayed 5.5 days in the area. It can be noted that statistically significant differences were found in trip organisation, intention to return and recommend between tourists visiting these destinations during summer 2014 and those visiting in 2016. Nevertheless, given that the vast majority of respondents are planning to return and have an intention to recommend these destinations in both years, it can be concluded that they are satisfied with their stay. However, in order to stay competitive in the tourism market, the destination’s managers have to be aware of the attitudes of their tourists and to obtain information on which elements could be improved to provide a better tourist experience. Therefore, detailed analysis was performed on the respondents’ satisfaction and importance ratings of the elements of the tourism offerings.
3. ANALYSIS AND FINDINGS
The first part of the questionnaire asked tourists to rate their level of satisfaction with the elements of the destination offering (1 = unsatisfied and 5 = very satisfied). The second section of the questionnaire focused on importance ratings (1 = unimportant and 5 = very important) regarding the same offering elements. As can be seen from the previousTable 2, sample was divided into two subgroups, the first referring to the respondents who visited these destinations in summer 2014 and the second, to those who visited in summer 2016. This was done to compare the attitudes of those two groups of respondents and to find out whether there are any significant differences between them.Mikulić and Ryan (2018) advised to critically examine the elementary descriptive statistics and that will indicate what respondents perceive as important or highly ranked, and opposite.
In order to gain much more detail and thus a better picture with a higher managerial value, independent t-tests were conducted to determine significant differences between tourists who visited the destinations during summer 2014 and those visiting in 2016, regarding their attitudes towards the destination offerings (Table 3). Findings confirmed that only in five (friendly and hospitable residents, feeling of personal safety and security, quality of information on the destination’s website, quality of accommodation and catering facilities), out of 22 elements, no statistically significant differences were found between the two groups. In all cases, satisfaction levels increased in 2016 in comparison with 2014. This indicates that the offerings in these destinations have been improved, resulting in higher tourist satisfaction. The largest positive gap scores, indicating the quality enhancement in 2016, were recorded for the following elements: facilities for children (+0.69), sports facilities (+0.56), diversity of cultural events (+0.56) and entertainment opportunities (+0.4).
Additionally, the importance ratings were also found to be significantly different across the two groups. The results revealed that the importance ratings of all offering dimensions were higher in 2016 in comparison with 2014 (Table 3). The highest positive gap score, when importance ratings are concerned, were recorded for the facilities for children (+1.08) and sports facilities (+0.87), as well as for cultural and historic heritage (+0.79) and diversity of cultural events (+0.78). These results could be reflection of certain differences in the sample (i.e. larger share of the respondents coming with family with children in 2016). They can also indicate that the motives for coming in these destinations could be changing (i.e. Rijeka was awarded the title of European Capital of Culture 2020 and therefore is targeting new markets).
Higher importance ratings in 2016 confirm that tourists are now more discerning and expect a high-quality experience in a preserved and, above all, safe destination. In that respect, paired sample t-tests were performed separately for each group of respondents (2014 and 2016) in order to find out whether there are any significant differences between the importance and satisfaction levels of each offering element. For that reason, to calculate gap scores, the respective mean importance scores were subtracted from the satisfaction ratings of each dimension. When the gap score (difference between satisfaction and importance) is greater than zero, it is regarded as a positive gap and is considered to be a strength of the destination (Kozak 2002). On the other hand, when the score is less than zero, the gap score is negative, and when the negative gap is large it could be an indicator that significant change is required (Kozak 2002). As presented inTable 4, in 2014, five out of fourteen elements with significant differences had a significant negative score (clearly signposted tourist directions in the destination, transportation links, quality of local transport, entertainment opportunities and value for money), indicating that respondents are less satisfied with these elements in comparison with the importance that they relate to the same elements. For the eight elements no significant differences were found.
Note: Gap score= mean satisfaction score for each element - respective mean importance score.
When it comes to the respondents staying in Opatija and Rijeka during summer 2016, t- test results confirm that twenty-one out of twenty-two offering elements have statistically significant negative gap scores, indicating that satisfaction with all those elements is less than their importance to the respondents. Hence, despite the fact that tourists were more satisfied in 2016, improvements to the offering attributes are nevertheless needed, especially when it was found that for almost all elements respondents gave higher importance than satisfaction ratings. Therefore, importance-performance analysis (IPA) was performed. IPA was first introduced byMartilla and James (1977) aiming to identify which product or service attributes need to be improved in order to enhance customer satisfaction. IPA was originally designed for marketing purposes, however its application extends to a wide range of fields, including travel and tourism (Dwyer et al., 2012;Enright and Newton, 2004;Griffin and Edwards, 2012;Oh, 2001;Wade and Eagles, 2003;Zhang and Chow, 2004) and has gained popularity in the wider management research in recent years since the technique has significant practical appeal (Mikulić et al., 2016). When tourism is concerned, IPA can provide an information base for formulating policies and implementing a strategy in order for a destination to maintain a competitive advantage (Dwyer et al., 2012). AsFrauman and Banks (2011) underlined, the IPA recognizes satisfaction as a function of two components: the importance of an offering attribute to a customer, and the attribute’s performance. The main characteristic of IPA is diagnostic, as it allows destination managers and marketers to identify critical offering attributes that are less satisfactory, or are under- or over-performing (Abalo et al 2007;Griffin and Edwards 2012). Based on the value of importance and the value of performance (satisfaction), the offering elements were placed in the importance-performance grid. The four quadrants of the importance–performance grid consist of Concentrate here, Keep up the good work, Low priority, and Possible overkill. There are some issues associated with the positioning of the grid lines in the IPA matrix (Griffin and Edwards, 2012), since their placement is a matter of judgement and reflects the destination management goals (Griffin and Edwards, 2012;Wade and Eagles, 2003) and determines in which quadrant a certain dimension will appear. Therefore, if the gridline is positioned on the satisfaction scale above the mid-point, destination managers are setting high standards (Hudson and Shephard 1998). If the position of gridline is adjusted on the importance scale it allows priorities to be more narrowly defined (Bruyere et al., 2002). Given the aspiration for a high-quality and competitive destination, the satisfaction grid lines in this study are placed at a high value of 4.2, while the importance threshold were set at the grand mean value of importance scores.
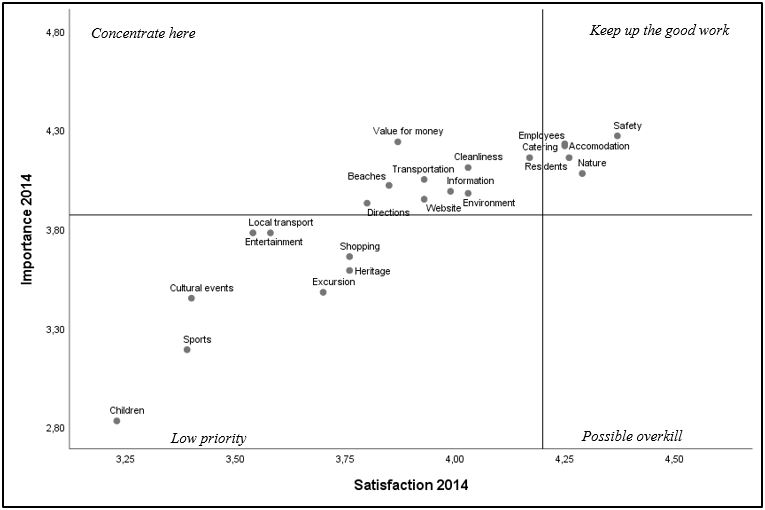
As can be seen inFigure 1, eight elements from 2014 (quality of the local transport, presentation of the cultural and historic heritage, diversity of cultural events, excursion offering, entertainment and shopping opportunities, sports facilities and facilities for children) appear in the Low priority quadrant, indicating that they have lower importance and lower satisfaction ratings. Further, only five elements, friendly and hospitable residents, cordiality of employees in tourism, feeling of personal safety and security, the beauty of nature and landscapes and quality of catering facilities, appear in the Keep up the good work quadrant, indicating that respondents perceive these elements as being very important and show a high level of satisfaction. In 2014 following nine offering elements were placed in the Concentrate here quadrant: preserved environment, cleanliness of the destination, equipment and maintenance of the beaches, quality of information on the destination’s website, availability of information in the destination, clearly signposted tourist directions in the destination, transportation links, quality of accommodation facilities and value for money. These offering elements are very important to respondents but their performance levels are not seen as being satisfactory.
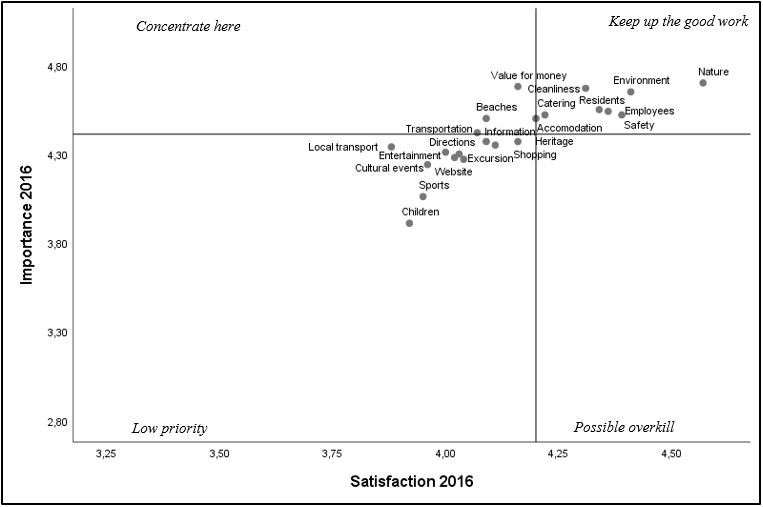
The situation has significantly changed in 2016 (Figure 1) given the higher importance and satisfaction ratings. Three offering elements (information on the destination’s website, availability of information and clearly signposted tourist directions in the destination) moved from Concentrate here to Low priority quadrant. Further, another three elements moved from Concentrate here to Keep up the good work quadrant (preserved environment, cleanliness of the destination and quality of accommodation facilities) leaving the Concentrate here quadrant with only three offering elements: value for money, transportation links and equipment and maintenance of the beaches. These elements remain to be very important to respondents but their performance levels are not seen as being satisfactory and therefore, require greater attention from destination management.
The new positions of the elements in 2016 indicate a significant positive shift in the tourists’ attitudes towards them, but also underline the need for improving certain attributes in the future. These results confirm that all the efforts made to enhance and enrich the tourism offerings of Opatija and Rijeka in the last couple of years have resulted in higher tourist satisfaction. Nevertheless, in order to be more competitive and strive for excellence, these destinations still need to focus their attention and resources on providing more innovative features and activity opportunities to enable their tourists to take part in an unforgettable experience. In 2016, tourists found elements referring to the environment, safety and hospitability to be the most important and, at the same time, the most satisfactory elements (Figure 1). This is also a very important finding, since a preserved environment and a feeling of safety and security are among the most important factors involved in choosing a destination (Kim et al. 2005;Reisinger and Mavondo 2006).
CONCLUSION
This study aimed to detect shifts in tourists’ attitudes towards the tourism offerings of Rijeka and Opatija, by comparing them in time. For that purpose, data obtained from two surveys conducted during summer 2014 and summer 2016 were used. The key finding of this study lies in the confirmation of the existence of statistically significant differences in overall satisfaction, as well as in seventeen offering elements (out of 22) between tourists visiting these destinations during summer 2014 and those visiting in 2016. Respondents visiting these towns in 2016 were more satisfied that those who visited them in 2014. These results indicate that the destinations’ offerings have improved in quality and diversity in the last couple of years. However, findings also indicate that value for money, transportation links and equipment and maintenance of the beaches still need management attention. In addition, certain offering attributes – like sports facilities, excursion offering, entertainment and shopping opportunities, facilities for children and diversity of cultural events as well as the availability of information inside and outside of the destination also require the further attention of destination management in order to achieve higher tourist satisfaction. Hence, the conclusions obtained in this study can be used as an information base for destination management in two ways. The first way refers to the feedback that the destination management gets as a response to (result of) their policies and activities focused on developing the tourism offering that were carried out in previous years. The second information base that destination management gets from this study refers to current tourist attitudes that have obviously changed over two years, suggesting that a different approach is needed in the future. Therefore, findings from this study can provide valuable information for destination managers to develop adequate plans for improving their offering elements and responding to the expectations of their customers.
Just like others, this study is not free of limitations. The first limitation is seen in the geographic area in which the research was conducted (only in two towns). Additionally, data collection was conducted only during the summer periods of 2014 and 2016 and, because of this, the sample may not well represent the whole population. Hence, it would be worthwhile to conduct similar research in other destinations and throughout the whole year so that the results could be compared.