1. INTRODUCTION
Stock price movements are commonly known to respond to economic news. The relationship between macroeconomic variables and stock returns has been in the focus of many researchers for years: Chen Roll, Ross, 1986 ; Kwon, Shin, 1999 ; Rapach, et al., 2004 ; Flannery, Protopapadakis, 2002 ; Birz, Lot, 2008 ; Humpe, Macmillan, 2009 ; Rahman, et al., 2009 ; Sing Mehta, Varsha, 2011; Pal, Mittal, 2011 ; Tiryaki, et al., 2018 ; Chang, Rajput, 2018 ; Lee, Ryu, 2018 are just some of many written research papers. A respectable amount of research work explained that a great deal of the fluctuation in stock returns can be explained by macroeconomic variables.
Among all sectors in the world, tourism is one of the largest economic sectors and, accordingly, has a large impact on global development. Creation of jobs, exports and prosperity are just some of the numerous benefits driven by tourism. In 2017 it accounted for 10.4% of global GDP and 9.9% of total employment (World Travel & Tourism Council, 2018). Currently, tourism is one of the most important sectors for Croatian economic growth since it plays an important role in offering employment opportunities and generating income and foreign exchange revenues. It tends to combine the large surplus in services with large deficits in merchandise trade (Ivanovic, et al., 2018:150) . Croatia is a country that is highly dependent upon tourism. According to the World Travel and Tourism Council, the total contribution of tourism to GDP in 2017 was 25%, while the total contribution to employment was 23.5%. Tourism in Croatia is a well-developed industry, and can look back on more than 150 years of history (Ivanovic et al., 2011) . According to the data from UNWTO (2018) , Croatia has achieved the fifth place among 17 1 Southern European Mediterranean countries, ranked according to the number of international tourist arrivals, just after Spain, Italy, Turkey and Greece. In the same publication, Croatia attained the sixth place among Southern European Mediterranean countries based on the international tourism receipts and was ranked after the aforementioned group of countries and Portugal. According to the world ranking, Croatia placed 27 out of 185 countries, based on the total contribution to GDP by the travel and tourism industry by relative size. Croatia is ranked 22nd in the world according to the travel & tourism industry's direct contribution to GDP. In 2017 travel and tourism directly supported 138,000 jobs, which earned Croatia the 23rd ranking in the world according to direct contribution of travel and tourism to employment by relative size. The aim of this research was to examine whether the macroeconomic variables have an impact on stock returns in the Croatian hospitality industry by using the vector autoregression methodology. The remainder of this paper is structured as follows: Section 2 introduces related studies, while Section 3 describes the data and methodology which is used in this empirical research. Section 4 outlines the results and discussion. Section 5 contains the conclusion, limitations of this study and future research directions.
2. LITERATURE REVIEW
One of the first studies about the macroeconomic impact on hospitality stock returns was conducted by Barrows and Naka (1994) . They studied the relationship between five macroeconomic variables (expected inflation rate, money supply, domestic consumption, term structure of interest rate and industrial production) and U.S. hospitality stock returns over a 27-year period. Their research results revealed a negative relationship that exists between stock returns and expected inflation, and a positive relationship between stock returns and growth rates of money supply and domestic consumption.
Chen et al. (2005) tested a set of macroeconomic variables, such as money supply, the growth rate of industrial production, expected inflation, the change of unemployment rate and the yield spread. Among all the variables, only money supply and the unemployment rate significantly explained the movement of hotel stock returns. This research highlights the role of monetary policy, proxied by changes in the discount rate, which was later applied by numerous research papers. Wong and Song (2006) used a vector autoregressive model to test the relationship between hospitality stock returns and macro-economic variables in the USA by using the monthly data in the period from January 1983 to August 1999. Among several different macro-variables, they found that interest rates explain a substantial proportion of the forecast error variance in the hospitality stock returns, while other variables like consumer price index, money supply, and industrial production had a minor role in explaining the variance.
Chen (2007a) investigated the performance of Taiwanese hotel stocks in two different monetary policy environments (expansive and restrictive). Research results suggest that hotel stocks exhibited a higher mean return and reward-to-risk ratio during expansive monetary periods. Besides monetary policy, the unemployment rate can also significantly explain hotel returns during the observed period. In another study, Chen (2007b) investigates the link between macro and non-macro explanatory factors and Chinese hotel stock returns. Among all the macroeconomic factors, Chinese hotel stock returns were significantly related to growth rates of industrial production and imports, changes in discount rates and yield spread.
Chen et al., (2010) investigated the effects of changes in monetary policy on the stock performance of hospitality firms (airlines, hotels, restaurants and tourism firms) in Hong Kong. Regression results indicate that changes in monetary policy have a strong impact on hotel and tourism stock performance. In the same year, Chen (2010) tested the impact of different FED monetary policy regimes on hospitality stock returns in the U.S. Empirical test results suggest that there is no strong impact on U.S. hospitality stock returns.
Demir et al. (2017) examined the relationship between Turkish tourism stock returns and macro-economic variables. During the period from 2005 to 2013, they tested eight macro-economic variables: consumer price index, imports, exchange rate, consumer confidence index, oil price, money supply, foreign tourist arrivals, and monthly stock market return using VAR methodology. It was found that the consumer confidence index and imports could Granger-cause companies’ stock returns. Considering the fact, that most of the previous studies were focused on Asian 2 and USA hospitality stock prices, this paper contributes to the existing literature on the topic of the impact of macro-economic variables on hospitality stock returns by extending the scope to one of the most popular countries on the Mediterranean: Croatia. Currently there are some research papers which investigate macroeconomic impact on Croatian stock returns, but none of them investigate impact on hospitality stock returns.
Among all papers, it is also important to highlight the research written by Benaković and Posedel (2010) . Their analysis included fourteen stocks (various sectors) and five macroeconomic factors: inflation, industrial production, interest rate, market index and oil prices. Their results showed that the stock market index (Crobex), has the largest statistical significance for all stocks and a positive relation to stock returns. All other factors marked also positive relation to stock returns except inflation.
3. DATA AND METHODOLOGY
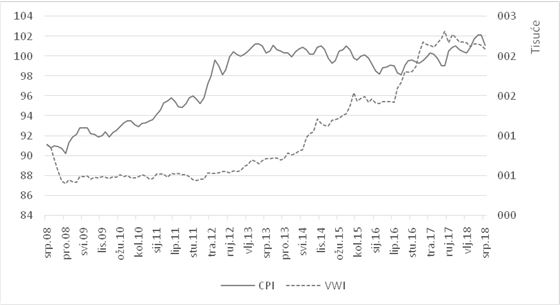
The data for this research were drawn from the Zagreb Stock Exchange. Stock price data of five companies with the largest market capitalization in the Croatian hospitality sector were employed: Valamar Riviera (RIVP), Arena Hospitality Group (ARNT), HUP-ZAGREB (HUPZ), MAISTRA (MAIS) and Liburnia Riviera Hoteli (LRH) 3 . Considering the fact that the Croatian capital market has low level of liquidity, which was confirmed by many authors ( Benić, Franić, 2009 ; Bogdan et al., 2012 ; Minovic 2015 ; Vidović et al., 2014 ), monthly data were used in the observed time period from July 2008 to July 2018. Based on the data (five hospitality stock companies), a value-weighted stock price index (VWI) was made.
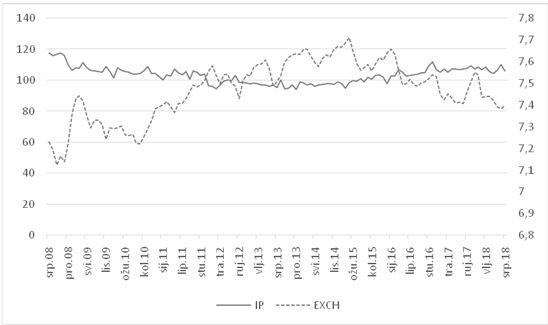
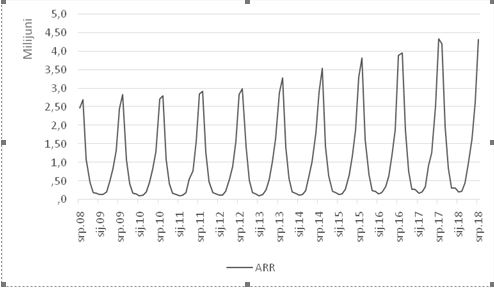
This paper investigates the relationship between four macro-variables and stock returns in the hospitality industry. Macro-variables included in this research: CPI (consumer price index), IP (industrial production), EXCH (EUR-HRK exchange rate) and ARR (number of tourist arrivals). Data were collected from: Croatian Bureau of Statistics, Croatian National Bank and European Central Bank. The aim of this research was to examine the impact of four macro-variables on the stock returns in the Croatian hospitality industry.
Numerous studies have researched the impact of inflation on stock returns. Most of the empirical evidence suggests that the relationship between stock returns and inflation is negative ( Fama 1981 ; Groenewold et al., 1997 ; Barrows, Naka 1994 ; Adrangi et al., 2002 ), but some empirical findings claim the opposite ( Choudhry, 2001, Spyrou, 2004 ). In this research, the relationship between inflation (CPI) and stock returns is expected to be negative.
H1 : changes in CPI will have a significant and negative effect on hotel stock returns.
Industrial production can be chosen as an appropriate proxy variable for economic activity. If industrial production is growing, most of the firms have increased profitability, which would be reflected in stock market prices. Previous empirical research also suggested a positive relation between stock returns and industrial production ( Barrows, Naka 1994 , Chen et al., 2005 , Chen et al., 2012 ).
H2 : changes in IP will have a significant and positive effect on hotel stock returns.
Granger et al. (2000) claimed in their research that the inclusion of exchange rate variations (within a week) was found to have improved the predictable portion of stock price changes in eight Asian markets. According to Luehrman (1991) , changing exchange rates affect the competitiveness of firms engaged in international competition. A weakening of the exchange rate has a positive boost for the tourism industry ( Chadee, Mieczkowski, 1987 ). A strengthening of the HRK (Croatian kuna) makes Croatia a less favorable destination, and tourists’ interest in traveling to Croatia will be diverted to other destinations. Since Croatia is a tourism-oriented country, the growth of the exchange rate EUR/HRK will have a positive impact on Croatian hospitality stocks.
H3 : changes in EXCH will have a significant and positive effect on hotel stock returns.
Previous papers have mostly used tourist arrivals as a proxy for tourism expansion ( Chen, 2007 and 2011 ; Demir et al., 2017 ). A higher number of tourist arrivals implies the higher tourist consumption, which consequently affects the profits of companies in the hospitality industry.
H4 : changes in ARR will have a significant and positive effect on hotel stock returns.
Next step was to graphically present all data in levels, which are shown in the appendix. Simple “eyeball metrics” suggest that all variables have a unit root, so formal tests were conducted:
The Augmented Dickey-Fuller — ADF ( Dickey, Fuller, 1979) and Phillips-Perron — PP (Phillips, Perron, 1988) tests were performed (trend and intercept were included). The lag length in the ADF test equation was selected using the Schwartz Information Criterion (for a maximum of 12 lags). In the Phillips-Perron test, the Bartlett Kernel estimation method was applied.
| Variable | VWI | CPI | IP | EXCH | ARR |
|---|---|---|---|---|---|
| ADF | -3.42 | -1.17 | -2.69 | -2.42 | -0.89 |
| PP | -3.32 | -0.68 | -3.06 | -1.08 | -2.04 |
Source: Author Notes: MacKinnon (1996) critical values for rejection of null hypothesis at 1% and 5% levels are -4.04, and -3.45.
Since it is obvious that all variables have a unit root (Table 1), next step was to calculate the difference in natural log for the period from July 2008 to July 2018 on monthly or yearly basis. Variables are displayed in Table 2:
| Symbol | Variable | Equation |
|---|---|---|
| VWI | Value weighted index | |
| CPI | Consumer price index | |
| IP | Industrial production | |
| EXCH | Exchange rate | |
| ARR | Tourist arrivals |
Source: Author
After deriving series, the next step was to check the stationarity of the variables. The Augmented Dickey-Fuller — ADF (Dickey, Fuller, 1979) and Phillips-Perron — PP (Phillips, Perron, 1988) tests were performed (intercept included). The lag length in the ADF test equation was selected using the Schwartz Information Criterion (for a maximum of 12 lags). In the Phillips-Perron test, the Bartlett Kernel estimation method were applied.
| Variable | VWI | CPI | IP | EXCH | ARR |
|---|---|---|---|---|---|
| ADF | -8.60 | -3.27 | -8.56 | -8.15 | -4.02 |
| PP | -8.83 | -3.64 | -16.44 | -7.86 | -10.14 |
Source: Author notes: MacKinnon (1996) critical values for rejection of null hypothesis at 5% levels is -3.48, and -2.89.
The results of the both tests reject the null hypothesis and indicate that all variables are stationary at 5%. In order to describe observations Table 4 provides the summary statistics of the stock returns and four macro variables after differencing.
Source: Author
The Monthly Value-Weighted Index in the hospitality industry ranges from -25.7% to 17.4%, with a mean of 0.6%. Among all the macro-variables, the largest standard deviation appears regarding tourist arrivals (10%), while the variable with the lowest volatility is the exchange rate (0.05%).
4. FINDINGS
In this section, a sequence of tests was performed to check the model adequacy. After checking the quality of model, multivariate causality tests were applied in a vector autoregression model. In other words, Granger-causality tests will be used to test the relationship between the Value-Weighted Index (VWI) and four macro-variables to investigate the causal relation.
First, it was necessary to find an optimal lag length. There are several criteria for choosing the optimal lag length. In this research, the optimal lag length suggested by the Akaike information criterion — AIC, LR test statistics and final prediction error was two 4 since suggested lag rejects the null hypothesis of no serial correlation in LM test, lag three was tested. The results are reported in Table 5.
| Lags | LM-Stat | Probability |
|---|---|---|
| 1 | 35.56478 | 0.0785 |
| 2 | 48.31311 | 0.0034 |
| 3 | 38.76593 | 0.0389 |
Source: Author
According to the results from LM test, null hypothesis can be accepted, since there is no serial correlation, it is continued with further checking. Next test was to check whether the VAR model is stable (Figure 1).
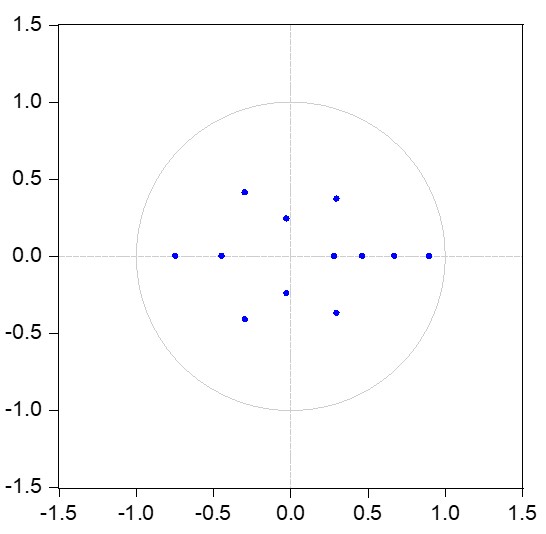
The estimated VAR is stable (stationary) because all roots have modulus less than one and lie inside the unit circle. If the VAR is not stable, certain results (such as impulse response standard errors) are not valid. In order to check the correlation among macro-variables and VWI, correlation coefficient matrix where each cell outputs correlation between variables is presented in Table 6.
| ΔVWI | ΔCPI | ΔIP | ΔEXCH | ΔARR | |
|---|---|---|---|---|---|
| ΔVWI | 1,00 | ||||
| ΔCPI | -0,31 | 1,00 | |||
| ΔIP | 0,13 | -0,11 | 1,00 | ||
| ΔEXCH | -0,01 | 0,06 | -0,04 | 1,00 | |
| ΔARR | 0,16 | -0,28 | 0,05 | -0,10 | 1,00 |
Source: Author
According to the results from Table 6, it can be noted that all correlation coefficients are low, thus the problem with multicollinearity can be avoided. Therefore, it was continued with the checking normality of the series. Residual normality test supported by Jarque-Bera test was performed in Table 7 (orthogonalization method: Cholesky).
| Component | Jarque-Bera | df | Prob. | |
|---|---|---|---|---|
| 1 | 3.480970 | 2 | 0.1754 | |
| 2 | 2.180321 | 2 | 0.3362 | |
| 3 | 0.036171 | 2 | 0.9821 | |
| 4 | 3.691586 | 2 | 0.1579 | |
| 5 | 1.676664 | 2 | 0.4324 | |
| Joint | 11.06571 | 10 | 0.3524 |
Source: Author
Table 7 reports the multivariate extensions of the Jarque-Bera residual normality test, which compares the third and fourth moments of the residuals to those from normal distribution. Large probability values lead to the acceptance of the null hypothesis which suggests that all residuals are normally distributed. According to all conducted tests, it can be confirmed that the VAR model is adequate, and in further research it can be continued with the causality testing.
The following equation was used to test all the hypotheses:
According to Equation 2, the null hypotheses states that changes in macroeconomic variables cause changes in the value-weighted stock price index comprised of Croatian hospitality stock companies. For example, H1— changes in CPI (consumer price index) can Granger cause VWI (value-weighted index) if β11= β12=0 is rejected, and if Changes in IP (industrial production) can Granger cause VWI (value-weighted index) if β21= β22=0 is rejected, and if Before running the Granger-causality test, a Bai-Perron test was performed to check if there were any multiple unknown breakpoints. Bai (1997) describes an intuitive approach for detecting more than one break. Later Bai and Perron (1998) describe a modified Bai (1997) approach in which, during each test step, the breakpoints under the null are obtained by global minimization of the sum-of-squared residuals. After performing this test, it was determined that there were no structural breaks, so it was continued with hypothesis testing.
All four hypotheses were tested by using a Granger-causality test, results are reported in Table 8.
Source: Author
As shown in Table 8., among the four macro-variables, only ΔCPI Granger-cause ΔVWI. It can be concluded that, of the four hypotheses, only H1 can be confirmed. After analyzing the one-way Granger-causality of the variable, an impulse response function is estimated, which traces the response to a one-time shock in the innovation for the variable ΔCPI.
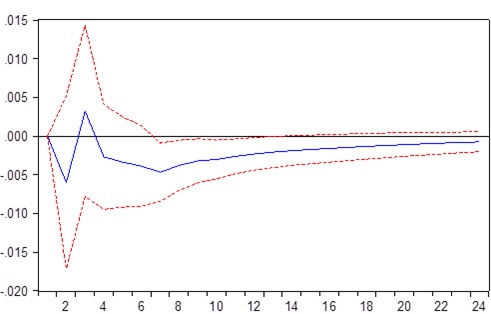
Figure 2 shows the response of stock returns in the Croatian hospitality industry to ΔCPI. In the second month, stock prices react negatively to shock, implying that higher inflation causes negative stock price returns, but the relationship becomes positive in the third month, just shortly trend reverses and moves down till the seventh month when it reverses again and starts to move towards zero, which is characteristic of stationary VAR models. In this research analysis, variance decomposition was also applied in order to present the significance of ΔCPI in the explanation of ΔVWI variability.
Source: Author
Table 9. shows the percentage of the forecast error variance of stock returns in the hospitality industry explained by macro-variable which Granger-cause ΔVWI. After two periods, CPI explains just 0.16% of the variability in VWI, and after the third period that proportion rises more than 2,5% which is still negligible. In the last observed period that percentage is slightly higher 3,56%, so it can be concluded that in later periods ΔCPI still has a minor impact on variance of stock returns in the hospitality industry.
5. CONCLUSION
The current studies have examined links between macroeconomic variables with hospitality stock returns in China, Japan, Taiwan, Turkey and the USA. This paper contributes to the existing literature on the topic of the impact of macro-economic variables on hospitality stock returns by extending the scope to one of the most popular countries on the Mediterranean: Croatia. According to the 2018 UNWTO World tourism organization report, among a total of 17 countries in Southern Mediterranean Europe, Croatia ranks fifth according to the number of arrivals, just behind Spain, Italy, Turkey and Greece. The aim of this paper was to test the relationship between four macroeconomic variables and stock returns of companies which are part of Croatian hospitality industry.
For the purpose of the research, four macro-variables were tested: ΔCPI (consumer price index), ΔIP (industrial production), ΔEXCH (EUR-HRK exchange rate) and ΔARR (number of tourist arrivals). Causality test results reveal that, among all the macro-variables, only ΔCPI Granger-cause stock returns in the hospitality industry in the period from July 2008 to July 2018. This finding is in line with Wong and Song (2006) , Chen, et al. (1986) and Wasserfallen (1989) . In further testing, it is also revealed that variance decomposition methods support the low explanatory power of macroeconomic variable (ΔCPI) in contributing to the forecast variance of stock prices.
Despite its insights and accomplishments, this research has some limitations, for example number of variables which could have impact on hospitality stock returns should be extended. Therefore, it is advised to include in future research: other macroeconomic variables for example Croatian GDP and its components, employment, investment in travel and tourism, tourism revenues, or even to complement with microeconomic variables such as the ones related to financial performance of hospitality companies and the ones related to tourist behaviour. Future research should also try to focus on the periods that are more than 10 years long and to include a larger number of hospitality companies in order to increase significance of results.