
INTRODUCTION
The purpose of this article is to examine the spending behaviour of tourists with regard to both the means of transport used to arrive in Italy and the type of destination chosen. In particular, we aim to investigate the differences in tourist expenditures between those who fly and those who drive (the two main forms of transport to Italy) and to identify the most requested means of transport with respect to different tourist destinations. To discover the link between the way of travel and the nature of the specific destination is essential for creating efficacious transport policies, ones that are efficient for tourists and sustainable for the destinations.
In Italy, ISTAT (Istituto Nazionale di Statistica) is the government agency responsible for producing statistics on tourist flows. Its complete study, entitled Movimento dei turisti italiani ed esteri negli esercizi ricettivi del Paese (‘Occupancy in collective accommodation establishments’, compiled in accordance with EU Regulation no. 692/2011), shows the number of arrivals and tourist presences, without, however, providing details on these trips. ISTAT also publishes a sample survey, Viaggi e vacanze (‘Trips and holidays survey’), to provide information on trips made by Italians both within the national borders and abroad: this, however, does not indicate holidays taken by foreigners in Italy.
Information about the means of transport used by Italians when they travel abroad and by foreigners who visit Italy can be found in the survey which the Banca d’Italia regularly conducts on border crossings to calculate the balance of tourism. These data in turn are used for the computation of the ‘travel’ item of the balance of payments, in accordance with the methodological conventions set out in the sixth edition of the IMF’s Balance of Payments and International Investment Position Manual (BPM6).
In Italy, the ‘travel’ item of the balance of payments has been the subject of methodological considerations for some years, from the study of theUfficio Italiano dei Cambi (1995) to the execution of a sample survey on tourism; it allows the so-called ‘tourism balance of payments’ (also referred to as the ‘balance of payments on tourism’ or the ‘balance of payments on the tourism account’) to be calculated.
Italy is the first country among the current members of the eurozone (with the exception of Ireland, which, like the United Kingdom, has been using sample surveys to estimate tourist expenditures since as early as the 1960s) to have foregone calculation of the tourism balance of payments on the basis of indications of purchases and sales of foreign currency banknotes by banks. Since 1996, Italy has indeed used a broad sample survey at border crossings. Other countries opting for this type of data source for inbound flows are Ireland, France, Cyprus, Finland, Greece and Malta (Alivernini et al. 2014, 33).
With these premises in mind, we have structured this paper according to the following research scheme: the first section contextualises these themes within the relevant literature, while the second explains the computation of the tourism balance. The third section describes the methodological approach used. The fourth and fifth sections analyse the main characteristics of the trips (number and expenditures of tourists by means of transport) with respect to the different Italian regions that represent the destinations. The sixth section shows the connection between means of transport and type of destination, using both the methods of stated and revealed preferences. The results show that the nature of the destination and the means of transport used to enter the country are closely linked, but are also connected to the weight of the country of origin (section 7). The discussion section explicitly attempts to integrate the findings of this work into existing contributions of the relevant literature and provides suggestions for future strategies. The conclusion (section 7) reiterates the findings and relevance of this paper.
1. LITERATURE REVIEW
As we have stated, the aim of this study is to examine the spending behaviour of foreign tourists with respect to both the means of travel and the nature of their destinations, in the context of a particular unit of observation, namely, the item ‘travel’ in the balance of payments. We have therefore deemed it necessary to rely on a number of disciplinary areas in order to situate this work in the framework of the relevant literature. To highlight the specific areas which are pertinent to our project, we have structured our review of previous contributions according to a four-step organizational plan based on the categories of transportation research, planning and destination research, tourism management and balance of payments.
Studies on transportation research seemed to us to be the most suitable for understanding the factors behind the movement of tourists; yet our approach in this case had to be filtered from the specific perspective of spatial planning in order to conceptualize the essential aspects of the trips. From here, the step to the literature on tourism management occurred naturally, such that it is impossible to clearly see the dividing line between studies on local planning (supply side) and those on tourism management (demand side). Finally, we perused the literature for studies on balance of payments in order to identify research on the topic of ‘travel’, referred to above.
The purpose of this review is obviously not so much to conduct exhaustive criticism as to provide the pivotal concepts on which this study is built.
1.1. Principal Models for Travel in Transport Planning
Demand for travel in transport planning is summarized in the economic literature by means of models, which analyse the phenomenon from the perspectives of trip generation, trip distribution, modal split and traffic assignment (Acheampong and Silva 2015;Del Viscovo 1990;Li Donni 1991;Mill and Morrison 1992;Safwat and Magnanti 1988;Tsekeris and Tsekeris 2011). In trip generation models, the need to move is manifested (and hence generated) before the mode of transport to satisfy it is chosen; it must therefore be explained without reference to the latter. In trip distribution models, by contrast, travellers’ choices are considered to be more variable, as they are explained in function of the probability of comprehending both the characteristics of the decision-maker and those regarding the destination, which is not always possible. The modal split model is used to distribute total demand for travel into two or more categories of travel modes, for example public transport and private vehicles. In the traffic assignment model, finally, travellers choose their route on the basis of the least time involved, which in turn depends on the volume of traffic.
In tourism specifically, the trip is defined as the chain of movements that begin and end at home (Primerano et al. 2008), while its components include not only a series of travel routes but also the activities that motivate each of these segments of the trip (Chen and Peng 2018;Eugenio-Martin and Inchausti-Sintes 2016;Hensher and Reyes 2000;Ho and Mulley 2013;Nicolau 2011;Xia et al. 2010).
1.2. Supply Side - Destination Management with Respect to Transport
The many types of travel models previously identified byGunn (1994) andLue et al. (1993) provide the starting points for the development ofDredge's (1999) model: this consists of destination regions (with a single node, multiple nodes and chain nodes), circulation routes and transit gateways. The spatial configuration of destinations (Yang et al. 2013) and the spatial and temporal interactions between tourist attractions (Matthews et al. 2018;Xia et al. 2011) also are included. In addition, studies on the effects of transport systems in urban tourism – in which, that is, cities are considered the most significant tourist destinations (Edwards et al. 2008;Li et al. 2015) – can, in our opinion, be integrated into this context of spatial planning. In particular,Fang et al. (2019) find that traffic factors do not affect hotel location choice in urban destinations.
Regarding the topic of tourist offerings,Mandić et al. (2018) explore the connection between tourism facilities and the level of development of the tourist destination. Established destinations aim to maintain their level of consumption (that is, of attracting tourists) by improving the quality of their services (which, in the case of Italy, seems to be the recommendation ofGrassini et al. 2017); these often require large-scale infrastructure projects, which are complex and costly (Slocum and Everett 2014). In this sense, the work ofRolfe and Flint (2018) can be understood as a logical continuation of this theme, showing how to conduct an economic analysis before investing resources in new roads destined for tourism.
1.3. Demand Side - Tourism Management with Respect to Transport
Distinguishing between intrastate, interstate and international tourism,Prideaux (2000) has shown that tourists who vacation within their own countries are more likely to travel by car (which provides greater flexibility for the timetable and itinerary of the trip: seeTaplin and Qiu 1997;Tideswell and Faulkner 1999), while those who travel abroad tend to go by air.Masiero and Zoltan (2013) maintain that the choice of the means of travel can be considered a factor that plays a role in the decision-making process in selecting the trip itself, rather than a mere consideration of the best way to reach a destination (Ding et al. 2017;Wilson and Hannam 2017).Wang et al. (2015) claim that the more information obtained by tourists (through IMTI – Integrated Multimodal Travel Information) before setting off, the simpler will become spatial-temporal and structural considerations pertaining to the segments of the trip.
Morley et al. (2014) expand the concept of travel costs in a gravity model integrated with the theory of individual utility. (On this point, see alsoKhadaroo and Seetanah 2008;Sussmann and Rashcovsky 1997). More recently, the research ofKim et al. (2019) on travel behaviour investigates whether potential tourists substitute overseas travel with other leisure activities, such as domestic travel or day trips, whileLosada et al. (2019) consider the spatial dimension a key element in understanding the relevance of the senior segment for the travel industry in Spain.
The use of mobile telephones equipped with GPS has given rise to interesting empirical experiments on the study of real tourist routes (Dattilo et al. 2016;Raun et al. 2016;Zheng et al. 2017): these, unfortunately, have come up against limits in the form of problems of access (costly agreements with providers that guarantee the right of anonymity of telephone users) and of the representativeness of the sample. At the same time, the use of smart tourism technologies in travel planning increases travel satisfaction (Huang et al. 2017).
1.4. Balance of Payments
In the context of balance of payments, it is necessary to recall two concepts that are inherently linked to it, namely, the elasticity of tourist demand (Gallet and Doucouliagos 2014;Krygsman et al. 2007;Yang et al. 2016;Ye et al. 2007) and the real exchange rate (Chao et al. 2013;Cheng et al. 2013;Manente 2000;Müller-Plantenberg 2010;Song and Li 2008, cited inSeetaram et al. 2016). In light of these economic indicators, the Tourism Balance of Payments (BOT) has been the focus of an interesting scholarly debate.
With specific regard to the concept of ‘balance of payments for tourism’,Cardoso and Ferreira (2000), citingBaretje (1982), claim that this measurement only gauges final payments of tourists for goods and services in the destination countries; to truly understand what tourism means for a particular destination, they affirm, we must include not only final payments and travel costs, but also international transfers for goods and services used for investments and intermediate operations in the tourism industry. To achieve adequate policy formulation at the government level, balance of payments should be replaced by the broader concept of ‘an external account of tourism’, which includes expenses and revenues for tourists, together with international transactions indirectly connected to tourism.
Since then, BOT computations have been increasingly incorporated into more wide-ranging and comprehensive approaches in analysing the economic effects of tourism (Dwyer2015,2016;Martins et al. 2017;Tohmo 2018;Van Truong and Shimizu 2017). In particular, these developments have led to the emergence of ‘Tourism Satellite Accounts’ (TSAs), of which the BOT forms an integral part for many countries (UNWTO et al. 2010). The pioneer study in this regard is that ofHenry and Deane (1997), which defined four levels of economic impact of tourist expenditures. As a result, in recent years very few contributions to the literature on tourism have focused only on BOT (Dogru et al. 2019;Jelušić 2017;Loh 2014;Thano 2015). Nonetheless, economic growth and tourism development are strongly correlated (Çelik et al. 2013;Dogru and Bulut 2018;Li et al. 2018;Sokhanvar et al. 2018), and transportation costs are among the most commonly used explanatory variables in this context (Edgell 1995;Lim 1997;Martín et al. 2017;Rashidi and Koo 2016).
2. THE TOURISM BALANCE COMPUTATION
The tourism balance represents an item in the current account balance in the balance of payments; it best expresses the economic situation of a country in its relations with others, in that it records international transactions of goods and service, income and unilateral current transfers.
The balance of travel, better known as the ‘tourism balance’, is obtained from the sum of the balance of expenditures between – in this case – Italian and foreign travellers for internal transport, accommodation, meals, goods and services. The tourism balance is structurally positive for Italy: in 2017 it totalled €14.6 billion (compared to a current account balance of €47.8 billion).Table 1 shows how this amount corresponds to 0.9% of gross domestic product (the current account balance for 2017 was 2.8% of GDP), which results from the difference between 2.3% of GDP of revenues (or €39 billion of expenditure by foreign travellers) and 1.4% of GDP of tourist expenditures abroad (or nearly €25 billion of outlays by Italian travellers).
Source:Banca d’Italia (2018a) Table 1, p. 10.
From the analytical breakdown of these sums,Table 2 shows that the greatest expense – both for Italians (expenditures) and for foreigners (receipts) – regards accommodation; this item is followed by meals, shopping, internal transport and other expenses. Transport costs, then, are a structural component of the tourism balance when considered as an expense that is effectively incurred for a holiday.
Source: extract from (Banca d’Italia2017,2018a), Table 12, p.14, and Table 21, p.18.
i For foreign travellers: expenditures exclusively for passenger transport provided by residents within the national borders. For Italian travellers abroad: expenditures exclusively for passenger transport provided to residents in the foreign countries visited.
3. DATA COLLECTION
In order to observe trends in tourism regarding the international demand for trips to Italy (foreign tourists in Italy), we have made use of the microdata of the border surveys periodically conducted by the Banca d’Italia to calculate the ‘tourism balance’, which in turn are employed for the computation of the ‘balance of payments’.
The method adopted for data collection for the tourism balance (known in the literature as the ‘inbound-outbound frontier survey’) involves interviews of a representative sample of travellers –– residents and non-residents – as they cross Italy’s borders. The sample is made independently at each type of border crossing (international roads, railroads, airports and ports) at frontier points that were selected as representative (Banca d’Italia 2016).
The Banca d’Italia survey requires the presence of interviewers at a sample of border crossings during the entire year. Two types of sampling are carried out at border points: qualified counts (of both the means of transport used by travellers and the number and nationalities of travellers en route) and interviews (which are particular to the nature of each border crossing). In 2017, in structured questionnaires conducted in person with 115,844 foreign travellers, 97,385 were ‘tourists’. Extrapolation of these data was performed using expansion factors specifically developed by the Banca d’Italia in collaboration with ISTAT and with state agencies working at the individual border crossings. The field survey data obtained from these studies are available at the Banca d’Italia website (https://www.bancaditalia.it).
It is important to note that in the methodological stage of constructing the tourism balance, the means of transport used by travellers are indicated at the ‘border points’, thereby producing different results with respect to the ‘transport’ variable understood as a structural economic component of the tourism balance.
4. DESTINATION ITALY: THE TYPES OF TRIPS
The ‘main destination’ variable from the microdata differentiates travellers according to whether Italy represented for them their main or secondary destination, where the former denotes the place in which the tourist spent the most nights during his/her holiday. Identifying the principal destination is critical, as it allows us to distinguish the means of transport to reach, first of all, Italy and, secondly, the individual regions and cities. It enables us to control the influence of other factors and other means of transport, when these are required to arrive at the successive destinations of a trip involving more than one foreign country (a tour).
4.1. Numbers of Tourists by Means of Transport
Table 3 takes these distinctions into account by showing the distribution of foreign travellers in Italy by type of border. From the total of all foreign travellers, we have extracted the numbers of tourists, who according to the current definition consist of those persons outside their usual environment that effectively spent ‘at least one night’ in the place under examination. These data in turn allow us to create the distribution by type of border crossing used by foreign tourists in Italy (58,746 thousand) as well as the subgroup of tourists for whom Italy was the ‘main’ destination of their holiday (52,072 thousand, equal to 88.6% of the total). For the most recent year, 2017, the types of means of transport used by tourists at the borders remained essentially the same for ‘main destination’ and ‘main and secondary destination’: travel by air was slightly higher than by road in terms of numbers of users (with respective differences of 6.8% and 8.0%), while travel by rail and sea together made up less than 4% of the market. Nonetheless, it is important to note that over the last five years this classification has seen notable changes. Indeed until 2014, travel by road was by far the most used means of transport to arrive in Italy, both for all travellers and for tourists. In 2016 as well, travel by road occurred nearly as often as by air (48.2% and 47.7%, respectively).
4.2. Expenditure by Means of Transport
Expenditure in Italy by means of transport for tourists further confirms the leading economic role played by those who travelled by air (Table 3): tourists arriving by aeroplane spent more than double (€24,487 million, equal to 66.2% of the total expenditure) with respect to those travelling by car (€11,264 million). Tourists reaching the country by air therefore tend to represent the ‘heavy users’ in the market, given that they account for two thirds of total expenditures (€24,487 million of a total of €36,977 million).
4.3. Expenditure by Country of Origin
Table 4 presents the first ten countries of origin, which together in 2017 comprised 68.6% of total foreign tourism expenditure in Italy.
Those travelling by road (from, that is, Germany, France, Austria and Switzerland) spent a sum greater than that laid out by their co-nationals who preferred to travel by air (€13,035 million and €12,318 million, respectively).
This statistic is by no means insignificant, as it forces us to reassess the economic impact of important market segments which arrive in Italy by road and to integrate this finding into the results that we have seen thus far. (In this regard, see the ‘tourism income multiplier’ inArcher and Fletcher 1996, and the ‘country specific coefficients’ inDogru et al. 2017).
5. ANALYSIS OF TOURISM FLOWS WITH RESPECT TO DESTINATION REGIONS
5.1. Means of Transport and Geographical Position of Destination
A look at the numbers of travellers who visited Italy as their main destination inTable 5 reveals that the geographic position of the destination is correlated to the choice of the means of transport: foreign tourists headed to regions of the North show a clear preference for travel by road, while those destined to the regions of the Centre and South and to the Islands tend to arrive in Italy by air.
Graph 1 specifies the distribution by region of tourists who used the two main forms of travel (road and air).
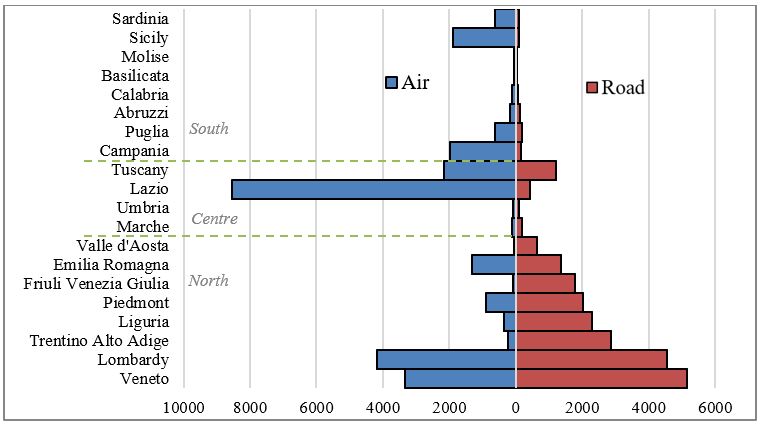
| Regions | Air | Road | Rail | Sea | Total |
| North | 10,423 | 20,658 | 930 | 235 | 32,246 |
| Centre | 10,912 | 1,897 | 182 | 248 | 13,239 |
| South | 2,953 | 556 | 35 | 283 | 3,827 |
| Islands | 2,527 | 187 | 8 | 26 | 2,748 |
| Unassigned | 6 | 5 | 1 | - | 12 |
| Total | 26,821 | 23,303 | 1,156 | 792 | 52,072 |
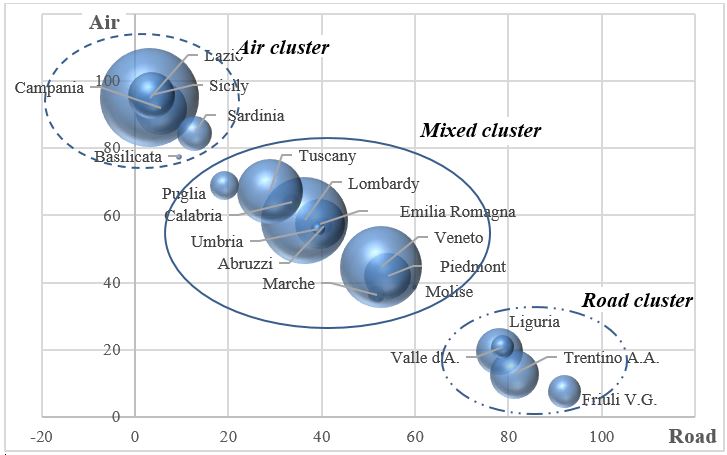
5.2. Expenditure Clusters by Destination Region and Mode of Entry
Graph 2 (which is based on the data inTable 6) shows the percentages of tourist expenditures by main destination region with respect to the two principal modes of entry into Italy – air and road – which account for 96.8% of the foreign tourist market. The regions are positioned on a negatively inclined diagonal axis (inverse relationship between the two modes of entry): the graph indeed reveals a clear clustering with respect to the geographical location of the destination regions and the means of transport.
6. DETERMINANTS OF THE MIXED CLUSTER
6.1. Stated Preferences Method
The analysis of the previous section has already shown that geography is correlated to the means of transport used. Given the concentration of more than half of the regions in the mixed cluster, we must focus our analysis on this section. To this end we introduce another variable into the analysis, namely the ‘holiday description’. This variable is not observed directly by the interviewer (in contrast to the means of transport) but is given by the person interviewed (by means of the ‘stated preferences method’).
Of the nearly €12 million produced in the mixed cluster for the northern regions, 50% of the expenditure essentially concerns two holiday destinations, namely seaside locations and the cities with cultural offerings (Table 7). Regarding these types, most of the expense pertains to foreign tourists arriving by car destined for the seaside (€2,334.9 million) and those arriving by aeroplane en route to the artistic cities (€1,690.3 million).
The ‘Seaside’ category includes both seas and lakes; ‘Nature’ indicates holidays centred on food and wine tasting, mountains, sporting activities, natural sites and rural tourism; ‘Culture’ denotes holidays based on artistic and cultural consumption; ‘Other’ includes any purposes other than these.
The respective tourist preferences for travel by road to seaside destinations and by air for artistic cities are also evident for the other subgroups of the central and southern regions.
Table 7 allows us to calculate average expenditure and therefore to confirm the assertion that geographic distance to the destinations of central and southern Italy favour travel by air. Indeed average expenditure increases proportionately for those arriving by road to seaside destinations (€534 to the North, €715 to the Centre and €792 to the South) and decreases for those flying to Italy en route to an artistic city (€821, €746 and €698, respectively for the three geographic regions).
6.2. Revealed Preferences Method
To verify our hypothesis of the respective associations of ‘seaside destinations by road’ and ‘artistic cities by air’, we must take a closer look at the mixed cluster. In part, this more detailed analysis involves filtering the effect of distance of the country of origin, so as not to assume a ‘logical correlation’ between greater distance of the country of origin and travel by aeroplane. The analysis must therefore focus on tourists coming from the area of the 28-member European Union (with the obvious exception of Italy, the destination country). To some extent this is a forced selection, as it implies excluding nearby Switzerland and including island countries such as the United Kingdom. As the aim, however, is to develop pragmatic proposals for strategic purposes, this selection criterion seems justified. Indeed in pursuing our analysis, we have filtered out two factors correlated to the means of transport: distance to the destination region (with regard to the mixed cluster) and distance from the country of origin (with regard to the EU-28 countries).
Here we adopt the ‘revealed preferences’ method, which allows us to eliminate the influence of those travellers who did not respond to the Banca d’Italia survey. (InTable 5 above, which regards all countries of origin, those who did not respond are included in the category ‘other’, which accounts for one-third of the total.
Revealed preferences is a method of inferring the behaviour of individuals on the basis of observed choices. It contrasts with attempts to directly measure choices through stated preferences. The choices that individuals make constitute one of the empirical bases of economics and management: what the tourist does reveals what he/she wants.To apply this method, each observation represented in the microdata was incorporated into the tourism category of the main town or city visited. The definitions of these categories were based on the ISTAT database entitled Municipalities’ classification by touristic area and type of tourist interest localities. Each observation from the Banca d’Italia survey was connected to a tourist destination category (following the ISTAT definitions) according to the name of the municipality of the main destination. The analysis was thus strengthened in terms of the objectivity of the results and of the completeness of the data.
The consistency of the different sources (Banca d’Italia and ISTAT) is guaranteed by the fact that the latter institute collaborates in building the sample and the weighting factors in the Banca d’Italia survey, thus assuring correspondence of the categories in the two statistical sets. In addition, the tourist industry at the local level is a substantially objective phenomenon, one whose data can be taken as reliable. The extrapolated results are given in Tables8 and9: these show the effect of the relative weight of each origin country in the propensity to travel by car or by aeroplane. The overall results here confirm what we have already seen.
* For purposes of consistency withTable 5, here the category ‘seaside’ includes ‘seaside localities’ and ‘lake localities’, while the category ‘culture’ includes ‘towns of historical and artistic interest’ and ‘provincial capitals’.
Others: Slovak Republic, Portugal, Greece, Hungary, Finland, Bulgaria, Luxembourg, Croatia, Estonia, Latvia, Lithuania, Malta, Slovenia and Cyprus.
7. RESULTS
The classification of foreign tourist expenditures with regard to the means of transport used to enter the country has undergone variations over the last five years (Table 3). The question of distance by itself is not sufficient to explain the choice of one means of arrival over another. The two most used ways of travel, by road and by air, are indeed correlated to geographic distance (with a clear preference for the former for northern destinations and for the latter for the South,Table 5), which is in line with the affirmations ofPrideaux (2000) on the impact of distance. Nonetheless, the close competition between these two modes of travel leads us to conclude that the specific tourist offerings of the main destinations are a determining factor. The validity of this conclusion is independent of the geographical location of the destination (mixed cluster ofGraph 2); it is in line with whatMasiero and Zoltan (2013) have affirmed regarding the fact that the means of transport is a contributing factor in making decisions about trips. Indeed preference for travel by road seems to be better explained by the characteristics of a seaside holiday, which demands convenience and ease of movement even after tourists have reached their destination, a condition which makes the car the obvious choice (Taplin and Qiu 1997;Tideswell and Faulkner 1999).
Our analysis therefore focuses on tourist expenditure (within the framework of balance of payments); it has been further refined by eliminating the effect of distance to the destination region, as the analysis takes only the regions of the mixed cluster into account. The cluster-based model compensates for the weakness of the data mining approach, which cannot interpret the marginal effects of influencing factors (Li et al. 2016); in addition, the former is directed at expenses. The data was processed according to the two methods of analysis. The stated preferences method (Table 7) looked at the expenditures of foreign tourists from all countries of the world in the mixed cluster of destinations; it showed greater expenditure by those arriving by car en route to seaside destinations in Italy, with respect to those arriving by air. The opposite result emerged for those headed to artistic and cultural cities.
The revealed preferences method (Table 8) allowed us to further eliminate the effect of the distance of the country of origin without compromising the representativeness of the sample; it therefore permitted us to focus on the results regarding the EU-28 countries. Although these results confirmed the overall trends (greater expenditure on the part of those arriving by air in the artistic cities and of those travelling by car to the seaside), the distribution of tourists by country of origin suggests that the use of one or the other means of transport is certainly influenced by the relative weight of the countries of origin (Table 9).
8. DISCUSSION
The nearly 59 million foreign tourists arriving in Italy in 2017 brought the country revenues of €37,000 million, which produced a positive tourism balance of €14,597 million, equivalent to 0.9% of GDP. Nonetheless, today we find ourselves in an age in which the competitiveness of each country as an economic system depends on the contribution of all its sectors to provide it with a modicum of financial stability in the face of unexpected events (such as economic crises and the recent social and environmental disasters). In a world in which distance evidently no longer constitutes an additional cost for tourists but rather an opportunity for new experiences, competition presents the risk that positions gained thus far may be lost. In light of these changed circumstances, it becomes crucial to expand our vision of a such a strategic sector as tourism in the Italian economy to include analyses of means of transport, in addition to more basic and traditional considerations of accommodation facilities. Even more crucial in this regard (noted, indeed, byGrassini et al. 2017) is the need to comprehend the repercussions on the tourism sector of the efficiency of the transport systems that bring visitors to Italy, in which large-scale strategic errors can have a devastating economic impact on small-scale operators in the field.
The unit of analysis in this research is the means of transport used to cross the national borders, whose importance is understood when we consider that the various gateways into Italy influence further movements within the country (Dredge 1999). The complexity of the routes that tourists may follow once inside the country has given rise to models which analyse the structure of internal movements by different means of transport (such as those presented byLi et al. 2015,Edwards 2008,Ho and Mulley 2013, andTsekeris and Tsekeris 2011). To synthesize these phenomena, researchers have developed the concept of ‘main destination’ to indicate the place where a tourist spends most nights: on the curve of individual utility (Morley et al. 2014), this notion reflects and summarizes that which we might call ‘the relative maximum point with respect to the destination of Italy’.
8.1. Recommendations for Policy Makers
Even if the category with the greatest overall expenditure in the foreign tourist market for Italy is made up of visitors arriving by aeroplane, those from Europe who reach the country by car spend more money than their co-nationals who travel by air (Tables4,8 and9). As a result, it is necessary to meet the expectations of these visitors by means of functional investments.
Indeed many Italian localities are in an advanced stage of the lifecycle of tourist destinations, a stage in which, according toMandić et al. (2018), a repositioning of these destinations may be useful: in light of this circumstance, it is worth reflecting on what today’s technological possibilities may be able to contribute.
Current technological innovations in the field of transport constitute a rich source of new ideas (Maas Alliance 2017); indeed management studies should be able to channel these developments into more efficient directions. The analysis conducted in this study demonstrates the priorities of tourism and could therefore facilitate public policy discussion with regard to innovations in transport, bringing technological advances in line with the needs of the tourist market. Clearly the input of the hospitality sector on this topic would be required in order to ensure the security of investments in the entire system. Indeed in Italy in the last few years leasing management has made strong gains. This model presupposes a long-term investment strategy, which is undoubtedly more prudent than the traditional approach of the independently-owned hotel, and in this sense completely in line with other emerging schemes of contract management and franchising (Gai et al. 2017). The approach of inter-sectorial structural cooperation, in which all players share the aim of maximising profits by way of maximising customer utility and satisfaction, can contribute to recreating an overall expansive vision for multiple sectors of the economy – in this case the hospitality industry and the transport system – through a reciprocal exchange of intents in meeting the demands of the target segments of the market. This suggests that comprehending the preferences shown by foreign tourists in their choice of means of transport can lead to a diversification of infrastructural spending, together with the services connected with these: certain investments might be channelled toward airport facilities and the interconnections between them (Wang et al. 2015); others could be earmarked for the improvement of roads and related services that go beyond mere travel – to include, for example, access to parking at the destinations – to the end of avoiding traffic congestion while ensuring the sustainability of development. Undoubtedly these recommendations pose an enormous challenge for policymakers.
In addition, improvements to road infrastructure, more easily realized than those to airports, could also take into account the promotion of new, lesser known seaside destinations. This type of approach indeed closely connects the transport system to the strategic marketing of accommodation facilities.
In particular, while the item ‘travel’ shows a positive sign in the balance of payments, ‘transport’ has a conspicuously negative one (-€9.3 million in 2017,Banca d’Italia 2018b, 128); this deficit in turn has an effect on the overall value of ‘services’. The role of the public sector becomes crucial for guiding strategic funding of infrastructural improvements by guaranteeing the soundness of the investments, specifically through stimulating the growth of both the tourism and transport sectors, such that the financial outcome is less onerous and contributes more efficiently to sustaining GDP. The task of management research, which we have sought to trace, is indeed to highlight strategic inter-sectorial connections – in this case between transport and travel – to the end of developing structural models, which are critical on both macroeconomic and microeconomic levels.
8.2. Limitations
The main limitation of the present study is that it does not demonstrate any causal effect between the choice of the type of destination and the preference for the main means of transport. Both variables are part of the same decision-making process on the part of the tourist and are therefore closely connected. This consideration, however, does not exclude the possibility that other motivations are involved which can explain the pairing of the destination type and the greater probability of choosing one means of transport over another; in any case, identifying these motivations is not one of the aims of this paper.
Another limitation results from the use of Banca d’Italia microdata. Although on one hand this source represents a strongpoint of the present study (as it constitutes a novel methodological approach), on the other hand dependence on this databank allows us to only analyse choices that are conditional on the decision to visit Italy. In other words, relying on this source does not allow us to make substitution models regarding alternative destination countries.
8.3. Future Studies
The use of the microdata collected to calculate the tourism balance suggests further applications for the study of the direct effect of tourism expenditure, which was analysed here in correlation with the means of transport. A useful contribution to the theme could be provided by other studies that focus on the means of transport used by tourists to move within the national borders; one could, for example, research the ease or difficulty of tourist transport between different sites, such as the connections between destinations of primary and secondary importance.
It is further important to ascertain the replicability of the method of analysis by attempting to use the tourism balance microdata of other countries, above all those which use a methodology similar to that of Italy. This type of research would allow us to compare and integrate tourism policies over larger areas, such as on a European level.
9. CONCLUSIONS
The analysis of primary variables, which determine the aggregate components of the tourism balance (namely, transport, accommodation, food and drink, shopping, and other), has for the most part been neglected in the recent literature, even if these primary variables affect the economic result of this balance. By applying an empirical method to the analysis of the relationship between modes of transport and tourism trade balances, we hope that the current study will begin to address these voids. This study goes beyond previous research by looking at the mode of transport within the methodological components of the balance of tourism, therefore providing a relevant contribution to the literature on tourism management.
It is important to note that even if the item ‘internal transport’ amounts to only 10% of the overall expenditure of foreign travellers in Italy, microdata provided by the Banca d’Italia indicates additional avenues for studies on tourist transport. Obviously such research should not exclude further macroeconomic analyses: we should examine, for example, imports used to produce the goods and services consumed by tourists, as suggested byBaretje (1982) and byCardoso and Ferreira (2000), or the overall calculations of ‘Tourism Satellite Accounts (TSAs)’, with the aim, once again, of constructively adding other elements for reflecting on and conceptualising systematic ideas that are useful for the country’s real economy. In any case, the present writer believes that a deliberate analysis of the ‘direct’ effect of tourist expenditures (Henry and Deane 1997) produces invaluable information for local services and infrastructural decision-making, to the end of both strengthening sustainable development policies at the local level and of integrating the dynamics of the entrepreneurial sector.