
INTRODUCTION
Coastal destinations are the most visited parts of Croatia in the summer season, and therefore the most important product is "sun, sand and sea". From year to year, the number of arrivals and overnight stays in the coastal destinations increases. The number of arrivals is one of the indicators that tell us that increased pressure has been placed on the destination. Popular and competitive destinations every year try to improve their offer and tourist demand for a better quality of tourist offer is growing. Therefore, tourist destinations must follow new trends and keep up with competing destinations. Beaches are one of the main products of a coastal tourist destination. So it is essential to develop and manage beaches in a sustainable way. One of the known threats to beaches is overcrowding but also pollution that is known to happen due to the overwhelming number of users. For detecting the potential problem of the beaches it is essential to follow the perceptions and satisfaction of tourists and use their suggestions in order to maintain and to improve conditions on the beach.
Managing consumer satisfaction is very important because it has an essential impact on the future of consumer behaviour. Based on the analysis of different studies,Wang (2016) indicated that the outcomes of consumer satisfaction are: “word-of-mouth referral, consumers’ complaint behaviour, brand loyalty, continuance, recommendation and repurchase intention/repeat visitation”. There is also broader literature that deals with different aspects of consumer satisfaction in tourism. Management of tourist satisfaction is crucial because it influences on the choice of destination, the decision to return and the consumption of products and services in the destination (Yoon and Uysal 2005;Kozak and Rimmington 2000). Measuring tourist satisfaction is one of the most important and used indicators in planning of tourism destination management. Over time, monitoring of tourist satisfaction has become a tool for policy decisions makers. Planning according to tourists’ needs and preferences is the basis for strategic planning in a tourism destination (Bernini and Cagnone 2014;Brščić, Šugar and Ružić 2018). Some authors suggest that tourist satisfaction should be monitored on a regular basis (Soldić Frleta 2018) because it is one of the most important indicators of a destination’s success. Measuring overall tourist satisfaction with a destination is also recommended by the European Commission as one of the indicators in European Tourism Indicator System - management tool for sustainable management of the destination - (ETIS 2016).
1. LITERATURE REVIEW
Beaches are an important part of the “sun, sand and sea” tourism product because they bring great economic benefits to destinations which develop their tourism sector based on “sun and beach“ (Cabezas-Rabadán et al. 2019;Roca, Villares and Ortego 2009). In previous years, there have been many studies which have evaluated tourist satisfaction in “sun, sea and sand” destinations (Alegre and Garau 2010;Alegre and Garau 2011;Dodds and Holmes 2019;Peña-Alonsoa et al. 2018;Roca, Villares and Ortego 2009;Ariza et al. 2012), “sun and sand” tourism model (Aguilὀ, Alegre and Sard 2005;Alegre and Cladera 2006) and beach users’ preferences and behaviour at the beach (Botero 2013;Roca and Villares 2008;Chen and Teng 2016;Breton et al. 1996;Mohgan, Jones and Williams 1993).Alegre and Cladera (2006) emphasised how the main attractions for these destinations are namely the scenery, beaches in the destination, and “the urban and environmental backdrop”. So management strategies must focus on guaranteeing the quality of those aspects.Chen and Teng (2016) concluded that information about tourists’ perceptions of the beach give managers useful information for the pursuit of sustainable beach tourism. In managing the beaches, as a tourism product of the destination, it is vital to preserving the environmental values of the area. According toRoca, Villares and Ortego (2009), information obtained from beach users, such as how they perceive beach quality, can be effectively used to plan environmental management and help in developing sustainable tourism. AsCabezas-Rabadán et al. (2019) concluded in their research carried out among beach users, interests of beach users’ are not homogeneous and therefore it is necessary for management to get to know their opinions. They also reveal that education is essential for increasing environmental awareness and changing users’ expectations when the recreational interests conflict with natural values (Cabezas-Rabadán et al. 2019).Roca, Villares and Ortego (2009) recommended that beach users’ opinions and requirements should be used as a guide for development of beach management strategies. In their researchPeña-Alonsoa et al. (2018) suggested evaluation of the heritage of beaches and their surroundings by users, managers, academics and other stakeholders in the beaches as an initiative for a diagnosis of the conditions of the area.Dodds and Holmes (2019) confirmed in their research that understanding the factors that influence overall satisfaction (including satisfaction with beach and facilities) can help destinations in future planning. They proved that satisfaction with beach facilities and with beach characteristics has positive impacts on overall satisfaction (Dodds and Holmes 2019).
Popular tools in beach managementare certifications like beach awards and eco-labels (Klein and Dodds 2018). In previous years, there were studies that evaluated the perception of visitors and residents towards these certifications (Dodds and Holmes 2018;Lucrezi, Saayman and Van der Merwe 2015;Marin et al. 2009) and the perceptions of beach users towards the different attributes of beaches (Lozoyaa, Sardáa and Jiménez 2014;Cervantes et al. 2008). While beach users maybe don’t have great awareness about the certificationDodds and Holmes (2018) indicated that there is evidence that visitors support municipalities who strive to achieve certification. On the other hand,Blackman et al. (2014) have been indicated that certification can be useful for attracting new tourist but increase number of tourist can cause increased pressure on the environment.
From the mentioned studies it can be seen that there is a need to evaluate beach users’ perceptions and satisfaction in the context that they can be used for future strategic planning, or in the case of new investment. AsRoca, Villares and Ortego (2009) indicated, the idea is not to create a beach on demand but to use beach users’ information to improve beach facilities and offer and to identify high-priority issues. Also, this information is important in development of new strategies and, when the beach environment is considered, it is necessary to include components like participation, planning, integration, responsibility and quality assurance, because beaches need to be “functional” as well as “beautiful” (Valls et al. 2017).
The aim of the research presented in the paper was the determination of beach users’ satisfaction with the various aspects of the beach. The reason for the study was the development and testing of the Green Beach Model. Green Beach Model is a self-assessment tool for sustainable management of beaches developed under the Interreg MED project MITOMED+. Within the framework of the project, 12 beaches in Europe were chosen on which were tested implementation of the Green Beach Model: 3 in Tuscany, 3 in Cyprus, 3 in Catalonia and 3 in Istria County. The beaches in Istria County were Gradsko kupalište in Poreč, Girandella in Rabac and Karpinjan in Novigrad. The results of the implementation of the Green Beach Model on Karpinjan beach in Novigrad are presented in the paper from the beach users’ perspective. Green Beach Model is developed as a tool for helping beach managers to plan future activities on beaches by reducing negative environmental, cultural and social impacts on the area.
2. METHODOLOGY
The main objective of the paper was to determine the perceptions and satisfaction of tourists with Karpinjan beach in Novigrad before and after the implementation of the Green Beach Model. The main goal of the research was to develop a useful questionnaire for future evaluations that can be easy to use by local stakeholders as a tool for making informed decisions. The idea was to indicate the group of questions that can be gathered together in order to reduce the number of questions but still get valuable information from the beach users. For this purpose, the questionnaires were developed based on the previous studies of different researches. The goal was to see what questions are relevant for the long term monitoring of the beach users satisfaction as an indicator of sustainable beach management. Since there are many questions regarding different attributes and facilities of the beach, the aim was to determine if these elements for evaluation can be reduced.
Also, prior to implementation of the model in 2017, we wanted to find out the critical points that should be addressed and what should be changed, based on the responses received from beach users. The second survey was performed to see if tourists are more satisfied with the beach facilities and generally with the beach.
For the empirical field research, conducted on Karpinjan beach in the town of Novigrad, a questionnaire was created. The questionnaire was developed according to the previous studies with integrated questions from “Visitor survey” suggested by the European Tourism Indicators System (ETIS). The questions regarding to satisfaction with different facilities were used previously in numerous studies in various countries (Marin et al. 2009;Cervantes et al. 2008;Vaz et al. 2009;Lozoyaa, Sardáa and Jiménez 2014;Roca and Villares 2008) and Croatia (Magaš et al. 2013;Brščić et al. 2016).
The surveys were carried out among beach users, tourists and residents on Karpinjan beach. The first round of the research was carried out in the year 2017 before the investment in the beach and, in the year 2018, the similar questionnaire was used for the research after the implementation of the Green Beach Model. The field research was conducted by students who were trained in how to perform research. Every respondent on the beach was asked to fulfil the questionnaire and they could get help from the interviewer. In 2017, the survey was conducted in July, August and September and in year 2018, in the same months. Interviewers went on the field periodically, every seven to ten days because the average length of stay in the destination was on average six days. The most common period of interviewing tourists on the beach was from 10 am to 3 pm. The respondents had the possibility to complete the survey in seven languages: Croatian, Czech, English, German, Italian, Russian and Slovenian.
The respondents had to mark whether they were satisfied with the listed aspects/elements of Karpinjan beach. For that purpose, five-point Likert scale was used. In evaluation grade 1 means complete dissatisfaction, while grade 5 means complete satisfaction with the mentioned aspect. The questionnaire consisted of more closed and open-ended type questions, but only the ones related to the beach conditions, state, content and users’ satisfaction were presented in this paper. Aspects of the beach were divided into three main categories: facilities, beach conditions and nature. In 2017, 23 aspects were evaluated and, in 2018, some new aspects of the beach were added and in total, it was possible to evaluate 27 aspects. The first part of the questionnaire contained questions about the destination which were not used in this paper, while, in the second part the questions were about the beach. The third part questions were related to the sociodemographic characteristics of the respondents.
In the two different years, in total, 547 beach users were interviewed on Karpinjan beach. More precisely, in 2017, 245 surveys were collected and, in 2018, in total 302 surveys. The data was analysed with the SPSS (22) software and the obtained results were presented with descriptive statistics. Also, for the presentation of the results, Principal Components Analysis (PCA) was performed and reliability analysis of each component was conducted.
The secondary data was requested via e-mail by the e-Visitor (Croatian national tourist information system) and we received statistical data about the destination of Novigrad for the years 2017 and 2018.
3. TOURISM IN THE DESTINATION OF NOVIGRAD
The City of Novigrad-Cittanova is located on the north-western side of Istria County and the city area extends over 27 km2. According to the last census of 2011, the number of inhabitants was 4,345. Development of tourism in Novigrad began in 1970. Today, tourism is one of the most developed activities on which the economic development of the city is based. According to the official data of e-Visitor, the number of tourist arrivals in 2017 was 222,744 and the number of overnights 1,271,303. In 2018 there was an increase in the number of arrivals to 223,709 and the number of overnight stays to 1,310,187. The average length of tourist stay in the destination was from 5.7 days in 2017 to 5.9 days in 2018. Comparing the two years, the number of facilities increased by 218 (2,519 in 2018), the number of accommodation units by 181 (6,275 in 2018) and the number of beds by 723 (21,080 in 2018). Due to the fact that more and more tourists come to the destination, stakeholders in tourism are continually working to extend the accommodation capacities and continuously invest in improving the quality of the tourist offer in all segments.
The occupancy rate of commercial accommodation in 2017 was 23.1% and in 2018 the rate was 26.7%. The lowest occupancy rate was in December (0.8%) and January (0.8%) and the highest in July (77.2%) and August (80%). In 2018, the lowest rate was in January (0.9%) and the highest the same as in 2017, in July (88.8%) and August (92.3%). The highest occupancy of commercial accommodation was recorded in the peak season, which indicates a high seasonality and a significant difference between the summer and winter periods. Seasonality is also a characteristic of coastal destinations. According to the number of overnight stays, the most significant number of tourists in 2017 and 2018 came from Slovenia, Germany, Austria, Italy, Netherlands, Czech Republic and Croatia.
The Karpinjan beach in Novigrad encompasses approx. 500 m of the seashore and is just one kilometre from the centre of Novigrad. A large part of this coastal area is covered with pebbles with some rocky sections. At the end of the beach is a high pine belt and on the beach are offered additional facilities.
4. RESULTS
In the research carried out among beach users, there were more women, in 2017 (56.56%) and 2018 (58.11%), than men. It is apparent that, in both years, representatives of all age groups had participated in the study. In 2017, most of the respondents were between 25 and 54 years old (62.4%) and in 2018 the results were almost the same; most of the respondents belonged to the age category from 25 to 54 years old (62.47%). According to the type of residence, most of them were tourists, 72.54% in 2017 and 67% in 2018. In the year 2017, according to thetype of accommodation, they stayed in hotels (19.72%) and private accommodation (45.41%). In the year 2018, tourists mostly used private accommodation (62.9%) (Table 1). Most frequently, they came to the destination of Novigrad with their family (52.26% in 2017, and 50.17% in 2018).
In 2017, most of the visitors to Karpinjan beach already had previous experience of the beach (47.9%) or got the information from friends and family (20.59%), followed by information obtained in hotel/camp/private accommodation (11.76%) and via Internet (11.34%). In 2018, the results were very similar; most of the tourists had already visited the beach in the past (44.67%), came by recommendation of friends and family (22.34%) or obtained information from the Internet (15.81%).
4.1. Beach users’ satisfaction with the beach
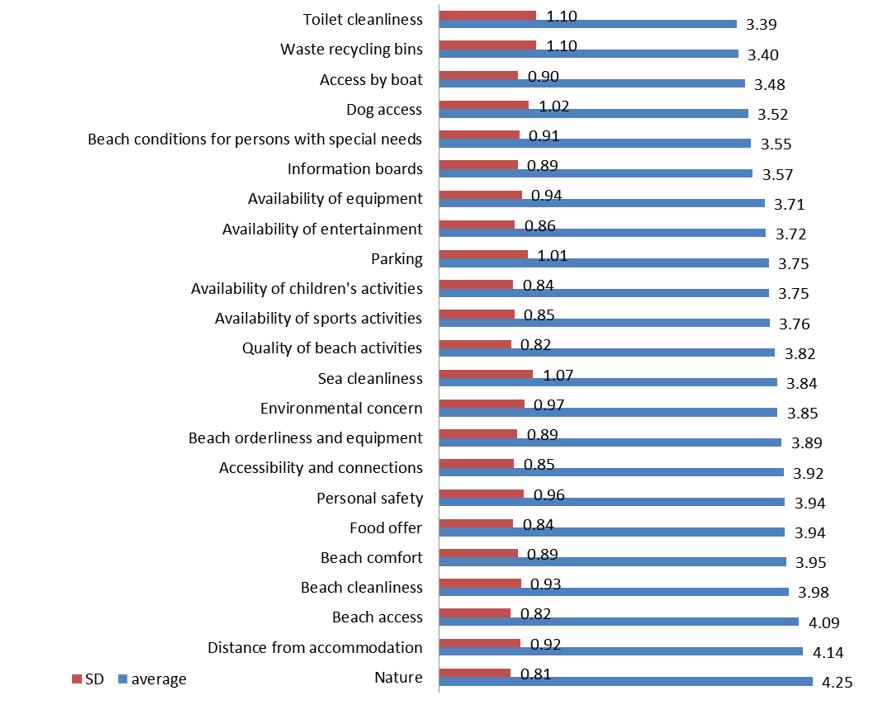
Regarding the evaluation of tourist satisfaction with beach facilities in 2017, beach users rated 23 aspects of the beach. In 2017, as can be seen inFigure 1, beach users were satisfied with almost all aspects of Karpinjan beach.
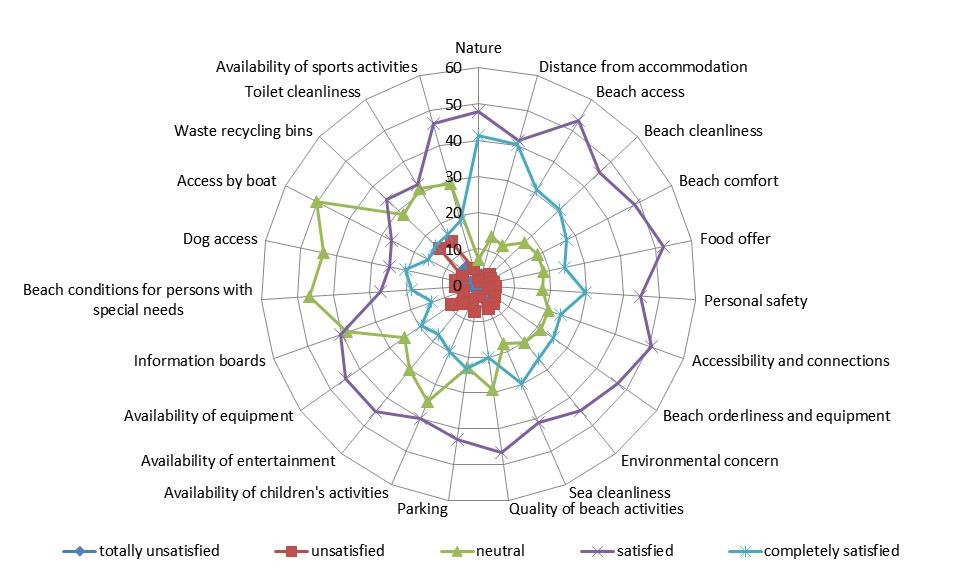
Beach users were mostly satisfied with nature (average=4.25, SD=0.81), distance from accommodation (average=4.14, SD=0.92) and beach access (average=4.09, SD=0.82). Also highly rated were the following aspects: beach cleanliness, beach comfort, food offer, personal safety and accessibility and connections. The last three variables which were evaluated as neutral and had the worst rate refer to access by boat, waste recycling bins and toilet cleanliness.
In 2018, additional aspects were offered to beach users, and they were asked to evaluate 27 aspects of Karpinjan beach, i.e. four aspects more than in 2017.

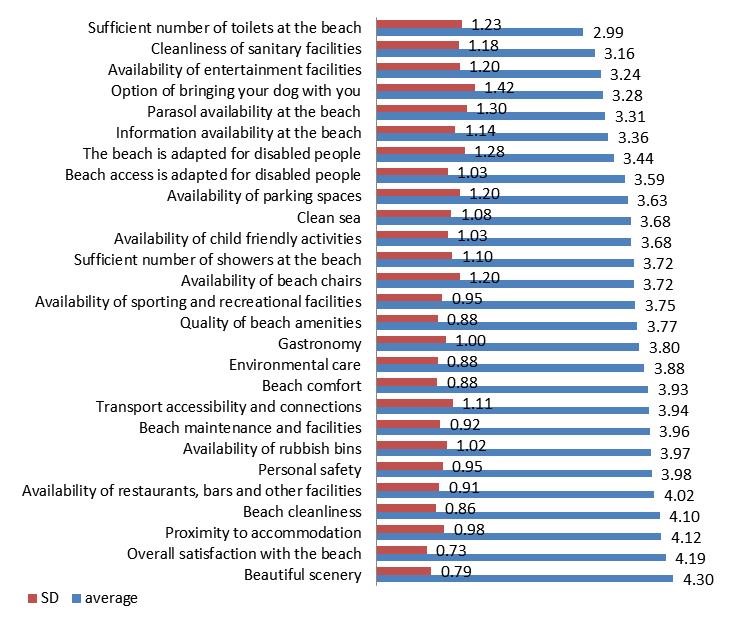
According to 7 aspects, respondents had a neutral attitude, and with the remaining 20 they were satisfied. The best average rating refers to beautiful scenery (average=4.30, SD=0.79), overall satisfaction with the beach (average=4.19, SD=0.73), proximity to accommodation (average=4.12, SD=0.98), beach cleanliness (average=4.10, SD=0.86) and availability of restaurants, bars and other facilities (average=4.02, SD=0.91). The aspects with the lowest rating on the list were adaptation of the beach for disabled people, information availability at the beach, parasol availability at the beach, option of bringing your dog with you, availability of entertainment facilities, cleanliness of sanitary facilities, and sufficient number of toilets at the beach.
4.2. Principal Components Analysis, beach users’ satisfaction with beach facilities in 2018
In order to further explore the dimensions of beach users’ satisfaction in 2017, before the implementation of the Green Beach Model and in 2018, after the implementation of the Green Beach Model, Principal Components Analysis (PCA) was conducted with 23 variables in 2017 and 27 variables in 2018, considering the different level of beach users’ satisfaction with the beach facilities (Table 2 andTable 3).
Conducting the first PCA with 23 variables included in the questionnaire in 2017, the variable personal safety was excluded because the variable was not statistically grouped with other variables. Finally, the PCA was conducted with 22 variables. The results were presented inTable 2.
Five components (KMO=0.890, Bartlett's Test χ2 sig. 0.000, satisfactory reliabilities, Cronbach alpha 0.929) emerged with eigenvalues greater than 1, satisfactorily explaining 66.8% of total variance. The first component consists of seven following attributes: beach cleanliness, sea cleanliness, access by boat, beach access, nature, beach comfort and environmental concern and can be described as “overall satisfaction with the beach”. The second component can be described as “conditions on the beach” including attributes: waste recycling bins, toilet cleanliness, dog access and information boards. The third component contains four attributes: availability of sports activities, availability of entertainment, availability of children´s activities and quality of beach activities which can be described as “entertainment at the beach”. The fourth component can be explained as “accessibility” made up of four attributes: beach conditions for persons with special needs, distance from accommodation, parking, accessibility and connections. The last fifth component encompassed three following attributes: beach orderliness and equipment, availability of equipment and food offer and can be described as “availability of facilities on the beach”.
Extraction Method: Principal Component Analysis.
Rotation Method: Promax with Kaiser Normalization.a
a. Rotation converged in 6 iterations.
In 2018, six components (KMO=0.884, Bartlett's Test χ2 sig. 0.000, satisfactory reliabilities, Cronbach alpha 0.923) emerged with eigenvalues greater than 1, satisfactorily explaining 63.44% of total variance. The initial solution was then Promax rotated and the results can be seen inTable 2. The first principal component encompassed 10 attributes which together can be named as “overall satisfaction with the beach” and includes: beach cleanliness, overall satisfaction with the beach, clean sea, beautiful scenery, environmental care, beach comfort, availability of rubbish bins, personal safety, adapted access for disabled people, beach maintenance and facilities. The second component is primarily associated with “conditions on the beach”: number of toilets at the beach, number of showers at the beach, option to bring a dog and cleanliness of sanitary facilities. The third component can be described as “entertainment at the beach” and consists of five attributes: availability of entertainment facilities, availability of child friendly activities, information availability at the beach, quality of beach amenities and availability of sporting and recreational facilities. The fourth component can be described as “accessibility” and consists of four attributes: transport accessibility and connections, availability of parking spaces, adaptation of the beach for disabled people and proximity to accommodation. The attribute “the beach is adapted for disabled people” 1*can also be grouped in the second component; however it has a stronger link with the fourth component, so we calculated this attribute with this component, named “accessibility”. The last two components consist of two attributes each. The fifth component can be named “gastronomy” and it consists of attributes named gastronomy and availability of restaurants, bars and other facilities. The last and sixth component named “additional facilities at the beach” grouped the attributes availability of beach chairs and parasol availability at the beach.
Comparing both years, we find that the variables are related in almost identical ways. The difference emerged in 2018 due to the addition of four attributes that eventually merged into the new components. This indicates that in some future research emerged values, and these components can be used for the evaluation of the beach users’ satisfaction.
Extraction Method: Principal Component Analysis.
Rotation Method: Promax with Kaiser Normalization.
a. Rotation converged in 7 iterations.
DISCUSSION
In developing a plan it's necessary to take into consideration government policies, environment, socio-economic interest and different stakeholders (Mooser et al. 2018). In the paper is analysed the usefulness of different evaluations by the beach users in the creation of a plan for sustainable beach management. In order to get useful insights from beach users and simplify the empirical research to monitor satisfaction in the long term, it is necessary to determine the optimal level of relevant questions in questionnaires. The PCA reduced the number of attributes that can be explained easily to the beach users and help managers in the future monitoring of the satisfaction level of the beach users. According to the research carried out in Italy general beach users’ preferences were for clean water, clean beach, services/facilities, type of sediment and safety (Marin et al. 2009). Also,Marin et al. (2009) based on the previous studies indicated that water quality, litter, facilities, safety and beach surrounding are usually recorded as general attractiveness for a majority of beach users. Beach users’ opinion and perception were evaluated byCervantes et al. (2008) presenting results in three groups of questions: service and infrastructure, recreational activities and beach conditions.Lozoyaa, Sardáa and Jiménez (2014) evaluated importance of different beach characteristics in the Costa Brava (Spain) in order to evaluate users’ motivations, priorities and perceptions. Beaches in Portugal and Welsh were evaluated byVaz et al. (2009) and they indicated that different beaches have different users and need different management strategies.
In the creation of the questionnaire different studies and approaches were analysed in order to get overview of what can be good information for the beach managers. The results of the studies have shown that importance indicated in previous studies like natural beauty, clean water and the beach were evaluated with high levels of satisfaction. The main idea is that development of methodology for evaluating users’ satisfaction give useful information to beach managers. For future research, it would be useful to test questionnaires with reduced components by beach managers in order to see if these components give them enough information for sustainable beach management.
CONCLUSION
As can be seen from similar studies, beach users' satisfaction is a very important and useful tool in the planning of the sustainability management of beaches. In both years, regarded to the obtained results, respondents were satisfied with the aspect of beach cleanliness which is, regard to the findings of several authors, one of the most important factors for visitors in choosing a beach (Marin et al. 2009;Roca and Villares 2008;Tudor and Williams 2006). From the obtained results of the research carried out before the investment on the beach, users were very satisfied with nature, distance from accommodation, beach access, beach cleanliness etc., but the worst rated were toilet cleanliness and waste recycling bins. After the intervention and implementation of the Green Beach Model, the attribute connected with nature called beautiful scenery got even higher grades. Also, overall satisfaction with the beach was very highly rated. It is interesting that in 2018 beach users noticed that rubbish bins and their availability had improved and rated this aspect with higher scores. The list of rated attributes shows what additional improvements can be made. PCA reduces the number of attributes into different components that can be suggested for future research but the point is that the attributes need to be chosen according to the strategic goals of the local municipalities and the beach management. Our approach in the research was similar to that ofRoca, Villares and Ortego (2009) and offers a bottom-up approach by examining beach users’ satisfaction to help beach management but taking into account the local context. Implementation of the Green Beach Model also raised awareness among beach users about a holistic approach to the beach as a tourism product and probably contributed to the beach users' satisfaction. It can be concluded that beaches are one of the most important resources of coastal destinations, so it is necessary for local stakeholders to manage the beaches in a sustainable way. Monitoring of beach users' satisfaction is a valuable tool for beach managers to identify what issues are important for users as well as a way to inform them that their opinions were considered, which will contribute to their loyalty, as well as that of tourists and local residents.