
INTRODUCTION
Diameter at breast height (DBH) is one of the most important tree variables measured in forestry (Corral-Rivas et al. 2007,Bueno-López and Bevilacqua 2013). Its frequency distribution is used to describe stand structure (Pond and Froese 2015), but above all, it allows the computing of basal area, a variable highly correlated with tree volume, biomass and increment; it is also an attribute easy to measure with sufficient accuracy. In some cases, DBH of removed trees may also be of interest. Estimating DBH of trees from stump dimension may help to reconstruct silvicultural practices and to assess harvested timber and wood, when pre-operation data are not available. Pre-operation data are surely not available in case of illegal cuttings, and estimating DBH is the only way to assess the loss, through a two-step procedure (Corral-Rivas et al. 2007,Özçelík et al. 2010), unless volume functions based on stump information are available. Another application of diameter prediction occurs when a harvest crosses ownership boundary (Chhetri et al. 1996,Pond and Froese 2014). The need to estimate DBH may also arise after natural disasters. In case of forest fires, stumps might be the only remaining part and consequently losses can be estimated based on their dimension. Other disturbances may lead to a variety of conditions that depend on type and intensity. For example, depending on the species, local windstorms might uproot trees still valuable for timber supply, which hold economic value and are for this reason still worth to be measured individually. On the contrary, hurricanes over wide regions may result in a mixture of a huge number of trees uprooted and broken, of different sizes and values that are too difficult and expensive to be measured individually, also considering that exploitation might be urgent to free the roads and the watercourses as well as to avoid pests and wood deterioration. In such cases, estimates of losses are conducted with less accuracy and using stump dimension to DBH relationships after the removal is a possible method. The example of an event that did not allow the measuring of all downed trees is the recent Vaia storm, which occurred on 29th October 2018 and caused considerable damages in the southern side of the central and eastern Alps (Italy, Austria, Switzerland, Slovenia). In the North-East of Italy (Trentino Alto-Adige, Veneto, Friuli Venezia Giulia) it downed about eight million cubic meters of wood and left hundreds of kilometres of forest roads to be restored. In forest inventory surveys, stump measurements are carried out because they are connected to net increment calculation (Gschwantner et al. 2016).
The Italian National Forest Inventory (NFI) measures stump diameter of the trees cut in the last 12 months to estimate the current annual removals (Gasparini et al. 2010,Gasparini and Di Cosmo 2016). Whether the felling was carried out in the 12 months before the survey or earlier is generally assessed visually, based on stump conditions, and the volume and biomass of each felled tree are estimated through a two-step procedure. In the first two Italian NFIs the DBH of felled trees was predicted using a model developed by the first Italian NFI in 1985 (MAF-ISAFA 1988). The model is a linear equation, using stump diameter (SD) as the only predictive quantitative variable and with distinct regression parameters for the conifers and the broadleaves. To our knowledge, it is the only model developed in Italy for predicting DBH from stump information over wide areas, but, unfortunately, regression metadata was only partially reported. The model was built based on about 650 standing sample trees on which two right angle diameters were measured at stump height (SH) and at breast height.MAF-ISAFA (1988) did not report which species were measured, the regression goodness of fit and the reason why equations were developed separately for the two groups of species, e.g. if after an in-depth analysis, based on expert assessment or because of the limited number of observations by species. Concern about suitable use in any condition arises especially from the fact that sample trees were selected only in high forests, when stumps were found in the NFI plots; the sample might be unbalanced towards high trees and, given the longer rotation, also towards large diameters, potentially resulting in biased estimates, particularly in coppice stands.
The aim of this work was to assess the performance of the model developed by the first Italian NFI using a new dataset containing data from about 1200 trees collected throughout Italy and possibly provide a new, enhanced model for predicting DBH from stump measurements of removed trees. Especially, the new dataset contained information about the species and stump height, two variables not available or not used by the first Italian NFI.
MATERIALS AND METHODS
Data
The data used for this study came from the database created byTabacchi et al. (2011) to construct tree volume and above-ground biomass models. Data collection started in 2001 thanks to a project launched to support the estimation procedure within the second Italian National Forest Inventory (INFC 2005). The project aimed to construct national models, applicable country-wide, and covering a relevant number of forest tree species. Based on 1289 sample trees measured over large areas of the country, prediction equations were finally made available for 26 species or groups of species (Tabacchi et al. 2011). Collection of sample trees has slowed down in recent years due to financial constrains; nevertheless, the overall goal of measuring 2800 trees in total has not been shelved and since 2011 the database has been enriched with about 150 additional sample trees. The data recorded include measurements of DBH, SD and SH. Details about the selection and number of sample trees, as well as about the measurements protocol, may be found inTabacchi et al. (2011). Relevant to this article, the dataset includes trees from 11 out of 21 administrative regions of Italy and 58 species. A subset of the data came from the existing forest harvesting operations and consequently recorded on trees subjectively selected following the criterion of each operation. Other subsets came from the felling of trees undertaken for development operations (e.g. road construction, natural disasters) with no subjective selection due to silvicultural criteria. Finally, felling was commissioned specifically for the aim of the project, to fill the gaps in sampling for some species or diameter and/or height classes.
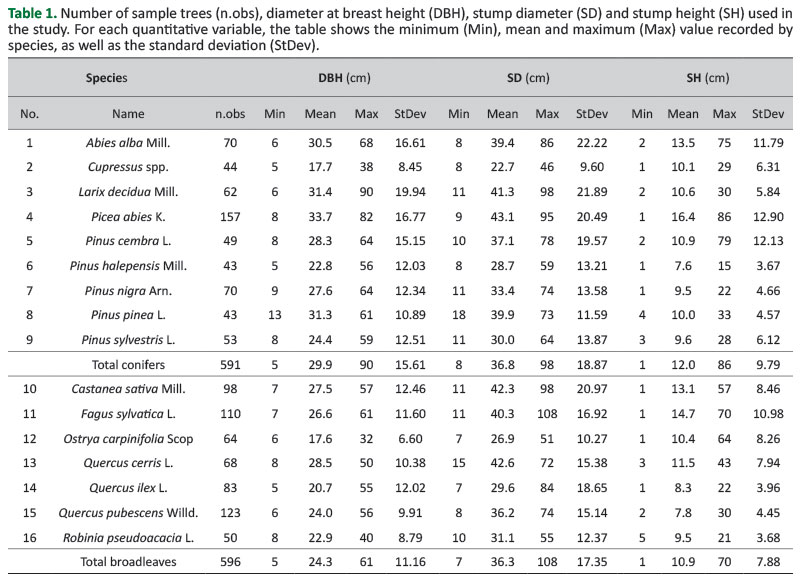
For this article, we decided to consider the species with at least forty sample trees. The available data are still limited and do not allow the analysis of the possible benefits from stratifying the sample by variables other than the species (e.g. management system, high trees vs coppice shoots). In this respect, while the analysis of the first NFI model’s performance conducted in this study may be considered deep and complete, other models developed and tested should be better considered as preliminary results within a long-term research.Table 1 shows the number of sample trees used in this study, by species and species group, their DBH, SD and SH range and variation.
The DBH of each tree was measured before felling, with the first diameter measured from the uphill side in case of sloping terrain. Once the tree was felled, the diameter of the cut section and the stump height were measured. Diameters were measured with reference to two right-angled directions and expressed in centimetres with a millimetre approximation, while SH was measured in centimetres.
Analysis
Firstly, the dataset described inTable 1 was used to assess the performance of the model developed by the first Italian NFI (MAF-ISAFA 1988) (here named Model 0) and to re-calibrate it with the available data to obtain Model 1. Secondly, the data inTable 1 were used to study the relationship between DBH and stump dimensions through OLS regression analysis. A set of potential predictors was tested: SD, SH, 130/SH, 130-SH, and their transformed values (squares and/or natural logarithm). Both the species and the species group (conifers or broadleaves) were tested as dummy variables. During the analysis, results showed the existence of heteroscedasticity that could not be solved through feasible weighted least squares estimation. Therefore, we followed two alternative approaches: i) evaluating the ongoing results also based on the heteroscedastic-robust standard errors (Models 2 and 3), and ii) running a logarithmic regression assuming the natural logarithm of DBH as the variable to regress (Models 4 and 5). In all cases, the quantitative explanatory variables were selected through a backward stepwise approach with tolerance ≤0.2 (Variance Inflation Factor ≤5). The best model within each approach was selected based on the following model parameters: adjusted coefficient of determination (R2adj), root mean squared error (RMSEmod), Akaike's information criterion (AIC), and Bayesian information criterion (BIC) computed on the fitting data.
The performance of Model 0 to predict the DBH of the trees in the dataset and that of the five newly developed models (Table 2) was compared by assessing their predictive accuracy through the following indices of fit: the mean error (ME), the mean absolute error (MAE), root mean squared error (RMSE), the mean percent deviation (MPD) and the mean percent standard error (MPSE) (Zeng, 2015). The indices were calculated as follows:
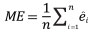
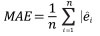
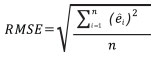
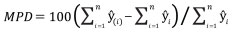
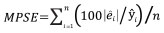
where ei = yi - yi ; yi are observed values, yi are values estimated by the model.
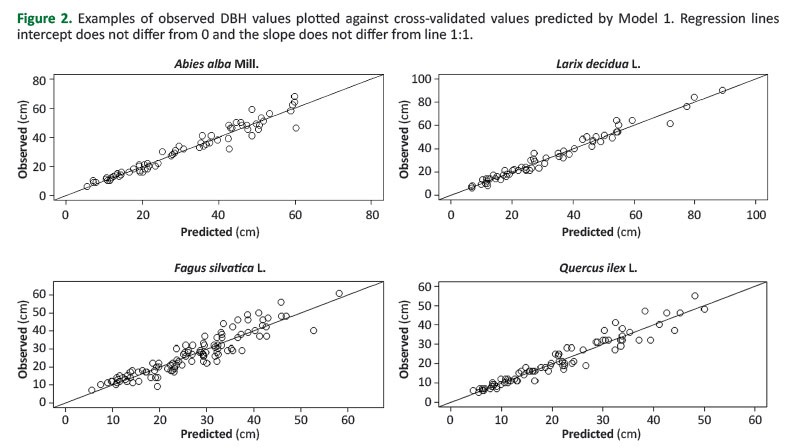
For models 1 to 5, the indices were calculated using the leave-one-out cross-validation method. Performance assessment included the evaluation of the relationship between the observed values plotted vs the predicted ones. Specifically, we tested whether the intercept of the regression line equalled zero (i.e. the line passed through the axes origin) and whether its slope was 45° (the 1:1 slope condition), that is whether the predictions were unbiased.
In order to assess the models’ performance on real scale values (centimetres) the Log-normal DBHs predicted by Models 3 and 4 inTable 2 were back-transformed followingSprugel (1983) before the cross validation.
The analyses were carried out using R version 3.5.3 (R Core Team 2019).
RESULTS
Table 2 shows the models developed, their residual standard error, Adjusted R-squared, the Akaike and Bayesian information criteria.
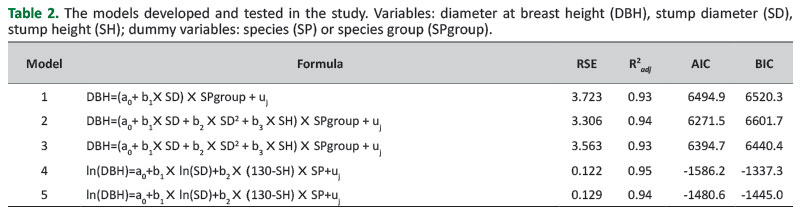
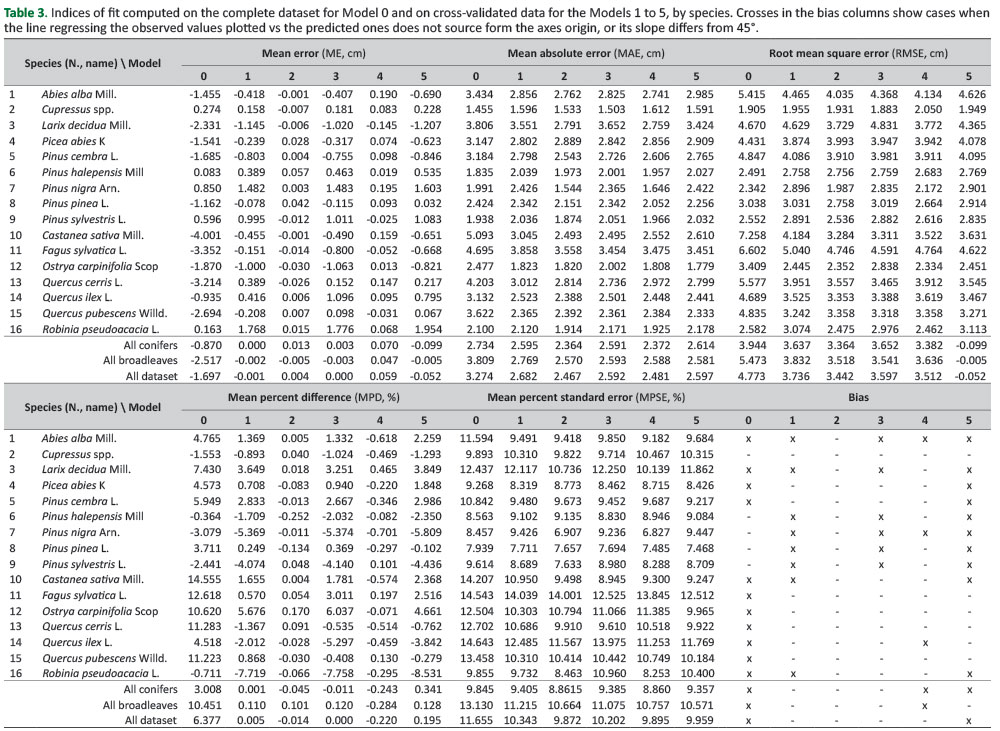
All the models provided a good level of fit as the adjusted R-squared value ranged between 0.93 and 0.95. The models that account for the species showed lower RSE compared to those that used the species group as a dummy variable.Table 3 shows the calculated performance indices of all the models tested and reports about the existence of bias when applying the model to independent data. Model 0 showed bias for both conifers and broadleaves. Model 1 showed that the re-calibration of Model 0 with the available data improved its performance consistently and the predictions for the two groups are unbiased; however, bias is still present in eight species. In general, model performance was improved by considering the species among the predictors. This is shown comparing the pairs of models with the same structure, that is, Model 2 vs Model 3 and Model 4 vs Model 5. For both pairs, RMSE was lower in eleven species and MPSE in nine species, out of sixteen. The importance of accounting for the species is also shown by the gains in the ME, the MAE and the MPD.
InFigure 1, ME and MPD for Models 2 and 3 are compared.
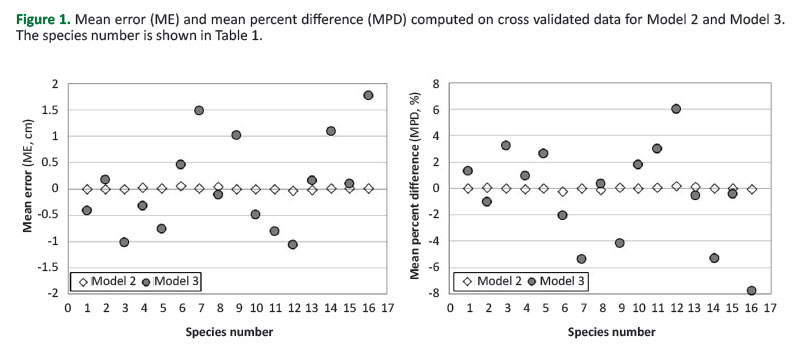
Based on the data inTable 3, similar patterns exist between Models 4 and 5. This shows that adopting the species as dummy variable instead of their two broad groups allowed the obtaining of more accurate estimates. MPD computed for Model 2 never exceeded 0.3 in absolute terms, while for Model 3 it exceeded 2% in nine species over sixteen. Based on the MPD, estimates of Model 3 were particularly poor for Robinia pseudoacacia (-7.8%), Ostrya carpinifolia (+6%), Pinus nigra (-5.4%), Quercus ilex (-5.3%), Pinus sylvestris (-4.1%). MPD of Model 2 is lower for all the species except Pinus halepensis,compared to the MPD of Model 3. Accounting for the species also reduced the presence of bias. Estimates of Model 5 are biased for ten species, while those obtained from Model 4 are biased only for three species. However, Model 2 is the only one that allowed unbiased estimates for all the species; its correspondent Model 3 was biased in six cases.Figure 2 shows the observed values plotted versus the estimated ones by Model 2, for four selected species, two conifers (Abies alba and Larix decidua) and two broadleaves, one deciduous (Fagus sylvatica) and one evergreen (Quercus ilex).
RMSEs of Model 2 are equal or lower than those of Model 4 in eleven cases out of sixteen. Improvement ranged between 0% (Quercus pubescens) and 9.08% (Quercus cerris); in the remaining five cases, Model 4 showed RMSE reduced by from 0.51% (Robinia pseudoacacia) to 3.51% (Pinus pinea).
Table 4 provides the estimated parameters for Model 2 with their heteroscedastic-robust standard errors. For the dummy variables only the coefficients significantly different from zero are showed. Complete coefficient estimates are given in Supplementary File 1.
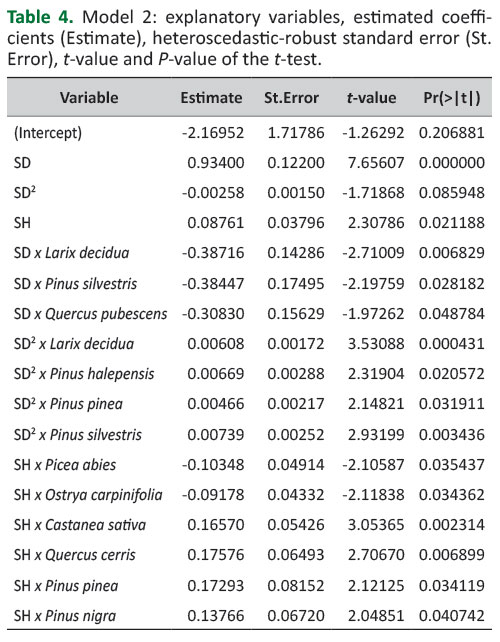
The estimated parameters inTable 4 show that SD is the main explanatory variable. For example, applying the model with the parameters in the table first to the mean SD and SH values reported inTable 1 and then to SD and SH values increased in turn by 1 cm revealed that the higher relative importance of SH to SD is for Quercus cerris. Nevertheless, the 1 cm increase in SD enlarged the DBH estimate by 0.71 cm, while the 1 cm increase in SH enlarged the DBH estimate by 0.26 cm.
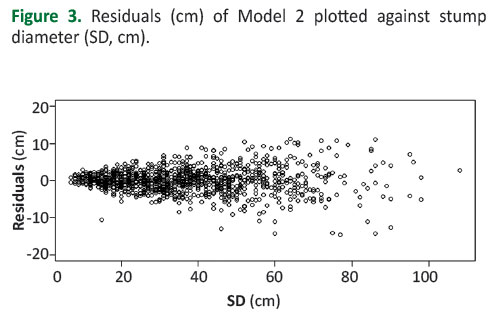
Figure 3 shows the residuals of Model 2 plotted against the stump diameters. Heteroscedasticity was confirmed by the Breush-Pagan test (BP = 267.29, df = 63, p-value < 2.2e-16).
Compared to Model 1, Model 2 RMSE is lower in fourteen species; the RMSE is reduced consistently for most species, up to 21.49% for Castanea sativa and 31.38% for Pinus nigra. In two cases (Picea abies and Quercus pubescens) Model 1 allowed estimates with reduced RMSE by from 3.07% to 3.58%.
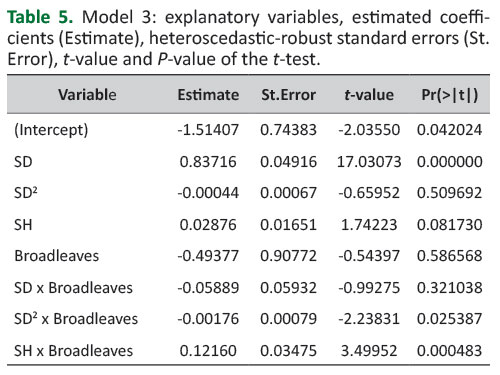
InTable 5, the estimated parameters for Model 3 are given.
DISCUSSION
DBH prediction is rarely the ultimate goal of an estimation procedure. Particularly when the economic value of the loss of forest products is under estimation, caused by illegal logging or natural hazards, estimates are addressed to assess tree volume or biomass weight. In this respect, estimating accurately the DBH from stump information is a matter of no secondary importance because the relationship between DBH and those two variables is multiplicative (Pond and Froese 2014), and errors in predicting DBH result in amplified errors in volume and weight predictions.Westfall and McRoberts (2017) found that, within a sampling approach, a two-step procedure based first on reconstructing DBH and then on applying a tree-volume model based on it gave better estimates than a model estimating merchantable volume directly from stumps information, suggesting that DBH prediction is unavoidable also when stump information to tree volume models is available. Despite its importance,Westfall (2010) noticed that little work on the prediction of DBH from stump dimensions has been done since the 1990s; our impression is that since that period such kind of works have become even less frequent. One reason might be the availability of such models that were developed in the past, but are now used without caring about their characteristics. Based on the new data available we could assess the performance of a model developed in the 1980s, based on data collected across wide areas but poorly described. The analysis was important because it showed the accuracy one might expect using that model. Its parametrization with the new data improved the accuracy on cross-validated data and provided overall unbiased predictions, as well as unbiased predictions for the conifers and the broadleaves groups, but also showed that predictions might be biased if used for particular species. In this respect, although the new Model 2 developed in the study is a preliminary result within a long-term research, it allows improved predictions compared to the old model. The main gain from using Model 2 is to obtain unbiased predictions, a result of the flexibility given to the model structure by the increased number of dummies to take into account the species; however, in terms of accuracy the improvement was limited, as indicated by the RMSE values inTable 3. The accuracy of Model 2 predictions is low, compared to other studies (e.g.Pond and Froese 2014), suggesting that dataset enrichment is necessary to identify the strata in order to reduce variability and optimize the sample size. In fact, almost twice the data available for Model 0 were used, but the number of samples by species is still limited and exceeds one-hundred for only three of them (Picea abies, Fagus sylvatica, Quercus pubescens). Furthermore, our data introduced additional variability because they come from trees felled following the criteria that differed between the operations and, for the broadleaves, include coppice shoots too. Like in the old dataset, our data capture a great variety of environmental and silvicultural conditions in Italy. The country spans over 10° latitude, two biogeographic regions (Pignatti 1979), and trees grow from the Mediterranean vegetation at the sea level to the tree line both on the Apennines and in the Alps. Also, the measuring of individual stumps instead of groups in sampling plots is a source of variability because sampling stumps close to each other in sample plots could capture at least the effects of homogeneous growing conditions at the very local scale.Ercanli et al. (2014) found that even selecting a subset of the available dataset may improve calibration to get better estimates of DBHs of independent data, highlighting the importance of the sampling scenario and of having enough data to run a deep analysis. Besides the variability in the data, accuracy performance might have been affected by the modelling approach. An OLS regression analysis was performed because it was functional to investigate the importance of considering the species and, in such case, whether individually or grouped through nested models; modelling by species or species groups is common in this kind of analysis. Either non-linear models or species-specific models might have improved accuracy. For practical uses, there are some other reasons for recommending using Model 2 (or Model 3) instead of Model 0. Metadata have been clearly described and this provides awareness of its limits and qualities. The dataset used in the study contained data on stumps from 7 cm diameter, also recorded in coppice stands; within the NFI computations, that threshold is consistent with the reference used for the current NFI measurements, that is, a minimum DBH of 4.5 cm for callipered trees (Bosela et al. 2016). The model presented in this paper was developed for stumps with bark, so its use is recommended only for intact or weakly/medium decayed stumps. In addition to providing a new model useful for forest practice, this study provided some directions about the continuation of the research. Model 2 allows the estimation of DBH for sixteen species which are among the most important forest species in Italy. Those species mark the Italian forest categories or sub-categories, as adopted by the second Italian NFI, and amount to a relevant percentage of the country forest area (INFC 2007). Nevertheless, there are other important tree species not covered by the model, and this is an additional reason for underlying the importance of pursing the continuation of data collection. This is a matter of no secondary importance for practical implications.Corral-Rivas et al. (2007) demonstrated that when a species-based model is incorrectly used for estimating the DBH of another species, errors may be severe and the use of more general models, i.e. fitted with multi-species data, is recommended instead. Although the good performance for one species that was not in the dataset used for calibration should be proved, Model 3 might be used to predict DBH of species other than those used in our analysis. In fact, choosing a species-specific model developed for species other than the one in hand might result as even more unjustified, because it requires the particularly hard judging of similarities to disclose for relationships like those implicated with stem taper. More precisely, Model 3 might be preferred in case of doubts about the stump species in mixed forests composed by the species in our dataset and for this reason it may be considered an additional result of this study. SH is a variable not recorded during the first Italian NFI but recorded from the second Italian NFI onwards (Gasparini and Di Cosmo 2015). Although SD remained the main explanatory variable, our analysis showed that, besides the species, SH improves the predictive accuracy of models. This confirms the finding ofPond and Froese (2014), who compared models with and without SH and stressed about the importance of including such a variable among the predictors.
CONCLUSIONS
Based on the analysis carried out, the following conclusions can be drawn:
Prediction of tree diameter at breast height (DBH) is improved when the stump height (SH) variable is considered among the quantitative explanatory variables, although stump diameter (SD) remains the most important predictive variable.
Introducing the species among the explanatory variables allowed the model to perform unbiased estimates.
Model accuracy was limited by the sample size, suggesting importance to collect additional data to accomplish the study.
Future steps of the study should be addressed to the identification of statistical strata to direct new data acquiring and inclusion in the modelling.
Comparison of model performance consistently benefitted from the assessment of possible bias in predictions.