
1. INTRODUCTION
The seasonality of tourism has been subject of many researches for many years worldwide, as well in Croatia, where tourism is the main driver of economic development. In general, tourism demand shows an increase, but various fluctuations influenced by numerous factors and external influences also. It is no surprise that in a numerous studies of tourism demand attention has been devoted to international tourist flows, due to their significance, but also due the fact that international tourism is statistically better captured than domestic tourism. According to data ofMinistry of Tourism (2018), the highest number of foreign tourist arrivals in 2017 was realized by German tourists, followed by tourists from Italy, Slovenia and Austria. Considering the fact that the largest number of international tourist arrivals is realized by German tourists, in this paper German tourist arrivals and basic variables affecting those arrivals were analysed. This kind of analysis should be an integral part of decision making processes regarding tourism policy in the Republic of Croatia.
2. LITERATURE REVIEW
Considering the great importance of tourism for national economy, and the complexity and variability of tourism market, researchers and practitioners as well have to pay great attention to tourism demand modelling and forecasting. The most recent paper bySong, Qui and Park (2019) reviewed 211 key paper with the main topic of tourism demand modelling and forecasting. The authors concluded that tourism demand forecasting methods have been evolving over past five decades, forecasting models have grown more diversified and there is no single method that performs well for all situations…The development of AI-based models is notable in the most recent tourism demand forecasting studies, despite the theoretical and technological limitations of these methods. In the paper byWu et.al. (2017) the review of new developments in tourism demand forecasting that consider numerous data measurements of tourism demand and their determinants have also been made. Before this research, a more complex literature review was elaborated byGoh and Law (2011), in time when the adoption of the AI- based models in tourism demand studies were just recent and limited. In the mentioned study 15 AI- based tourism demand forecast papers were identified, and divided into two major categories; AI- based causal methods and AI- based time series models. Still, researchers are pointing out that time series models, econometric approach and artificial intelligence models are the three main categories of quantitative forecasting models (Peng et al. 2014, 182).
Since more researchers show their interest for the issue of more accurate forecasting results, this methodology has been considered interesting in economics and business areas since it is viewed as a valid alternative to the classical forecast approaches event in complex situations (Fernandes et al. 2011).
In Cang’s paper (Cang, 2011) the complexity of tourism demand as social phenomenon was modelled by non-linear tourism demand forecast combination model. In the paper nine individual models were proposed; three linear combination models and one non-linear to model UK inbound tourism quarterly arrivals. Comparing mentioned models, the author concluded that the non-linear combination forecasting model, multilayer perceptron neural network showed the best performance compared to individual forecasting models and to all linear combination models.
Lin et al. (2011) modelled the data set of monthly visitors to Taiwan using ARIMA, ANN and MARS. According to this research, ARIMA showed the best forecasting performance. Taking into account a stochastic trend in data on the tourist arrivals to Catalonia (Spain) from 2001 to 2012 from different markets,Claveria and Torra (2014) applied a multivariate neural networks (MLP, RBF and Elman neural network) to obtain its forecasts. The modelling procedure was as usual in neural network modelling; training, validation and testing. In comparison of each neural network, it was concluded that MLP and RBF networks showed better forecasting performance than Elman network. The most significant contribution of those research is the innovative approach to tourism demand modelling and forecasting. Neural networks, as an artificial intelligence methodology for tourism demand modelling have been regarded by many theoretical and practitioners as promising technology, and consequently, in the last few decades more than 2000 articles on neural networks forecasting have been published covering a wide range of application (Yu et al., 2017).”Uysal and El Roubi (1999) demonstrated the usefulness of artificial neural networks as an alternative approach to the use of multiple regression in tourism demand using Canadian tourism expenditures in US as a measure of demand. Those authors identified that the application of ANN in tourism demand studied is useful in identifying existing patterns that may not be relieved by some other forecasting method, and in some cases their implementation result in better estimates in terms of prediction.
When considering studies dealing with implementation of artificial neural in Croatian tourism, the interest of researchers has been growing lately. In the study ofKrešić et al. (2013) the particular advantages and shortcomings of ANN-based applications using an empirical case example were demonstrated. The authors used the data from a survey on attitudes and expenditures of tourists in Sarajevo, Bosnia and Herzegovina, and performed a multilayer perceptron-based key-driver analysis to obtain insight into those destination attributes that have a predominant influence on the overall tourist experience in Sarajevo. The results from the ANN-based analysis are compared to results from a regression-based key-driver analysis in order to identify possible significant differences between the approaches.Folgieri et al. (2017) modelled a backpropagation Artificial Neural Network to forecast tourist arrivals in Croatia and compared the results with those obtained with the linear regression methods. The results showed that using the neural network model to predict tourists’ arrivals outperforms linear regression techniques. In the second step of their research, the same authors modelled and applied a backpropagation artificial neural network (ANN) to forecast tourists’ arrivals in Croatia (Folgieri et al., 2018). Applying a machine learning method for decision support and pattern discovery such as ANN, represents an occasion to achieve a greater accuracy if compared to results usually obtained by other methods, such as linear regression. The authors extended the model of the previously used backpropagation Artificial Neural Network, with the data from sentiment analysis collected through social networks on the Internet. The accuracy of the neural network has been measured by the Mean Squared Error (MSE) and compared to results obtained applying the ANN without data coming from the sentiment analysis. The results showed that including data from sentiment analysis, outperforms the previous obtained results.
Since the seasonality is a one of a prominent feature of tourism, there is a large number of papers dealing with seasonality research and determination. Although numerous studies on seasonality in tourism have been conducted, formal tests of seasonality can be found in relatively few papers.Chang and Liao (2010) presented the HEGY for the seasonal unit root that was used for the departures of destinations from Taiwan to Hong Kong, Japan and the USA in order to make an accurate inference about data seasonality.Vergori (2012) suggests that it is important to test the stochastic nature of the underlying process by using unit root tests. In order to test for seasonal unit roots, it is necessary to factorize the seasonal difference polynomial that for monthly data is defined as ∆_12=(1-L^12) where L is the backshift operator that is L^j X_t=X_(t-j). The research results showed that the seasonal backshift operator should be applied to the sample of monthly arrivals in the Province of Lecce in order to achieve a stationary time series.Chaitipa and Chaiboonsri (2014) provided a nonlinear forecasting models for prediction of the international tourist arrival to Thailand by using data from period 1998-2014, and the extent version of seasonal unit root test was performed out to test the data. The main conclusion was that the movement of international tourist arrivals to Thailand was affected by seasonal unit root process during observed period.
As the literature review indicates, the topic of tourism seasonality is analysed in more detail in the foreign literature, while in the domestic literature it is somewhat less. The authors of this paper, therefore, attempted to examine the character of international tourist arrivals in Croatia and to generate an artificial neural network model that represents the observed data. Given the importance of accurate forecasts for the dynamic and complex tourism market, the aim of this research is to identify the possibilities of applying an artificial neural network approach in analysing phenomena that a strong seasonal component.
3. DATA AND METHODOLOGY
In the chapters below the selection of variables and methodology will be presented.
3. 1 The selection of variables
The selection of tourism demand measure, as dependent variable, and independent variables as its determinants, was established and confirmed by relevant literature on tourism demand studies (Uysal and El Roubi, 1999;Fretchling, 2001;Song, et.al., 2012;Shafiullah et.al., 2019). In this study the following variables were used:
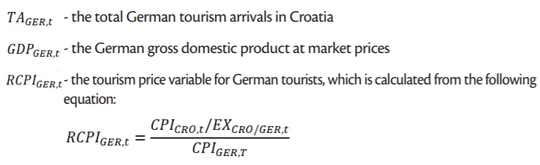
This variable takes into account the effect of both relative inflation and the exchange rate on the demand for tourism to Croatia.
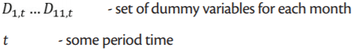
At any time of period t, one of the seasonal dummies  will equal 1, while all the others will equal 0. The rule is to use one fewer dummy variables than categories.
So, for monthly data, in this research eleven dummy variables were used.
will equal 1, while all the others will equal 0. The rule is to use one fewer dummy variables than categories.
So, for monthly data, in this research eleven dummy variables were used.
The main hypothesis is that the German tourist arrivals can be explained as a function of the variables selected in the study. Monthly data, from January 2001 to December 2018 (216 observations), were collected from Croatian Bureau of Statistics (First Releases) and Eurostat databases. Since gross domestic product measures the total output of an entire economy by adding up total consumption, investment, government expenditure, and net exports, in this research German gross domestic product at market prices is considered a quality approximation of income for an entire economy in the observed period. Due to the lack of monthly data on gross domestic product, in the research data for this variable were collected on a quarterly basis and were converted to monthly data using linear-match last low to high frequency method. This method inserts the low observation value into the last period of the high frequency data, then performs linear interpolation on the missing values.
The analysis was performed using Eviews 10.0., SPSS 22.0., and Stata 14.0. data analysis software packages.
3. 2 Methodology
An investigation of seasonal unit roots presence in this paper is conducted by the approach developed byHylleberg et al. (1990); general procedure which allows tests for unit root at some seasonal frequencies without maintaining that unit roots are present at all seasonal frequencies. The augmentation lag selection was suggested byRodriques and Taylor (2007). After seasonality identification, an artificial neural network model was established and evaluated using the mean absolute percentage error.
3. 2. 1 Testing for seasonal unit roots in monthly data – HEGY test
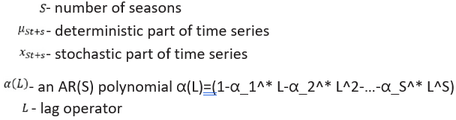
Univariate seasonal time series data generating process is assumed to be as follows:
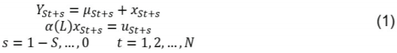
Where:
General HEGY procedure explains how to test for seasonal unit roots in processes that may also exhibit deterministic or stationary stochastic seasonality. HEGY procedure, simplified byBeaulieu and Miron (1993) is presented below.
The approach ofHylleberg et. al. (1990) is based on expanding α(L) around zero and seasonal frequency unit roots {exp (±i2πj/S); j=0,…,S/2}. Generally, the testing equation of the Hegy approach can be written as:
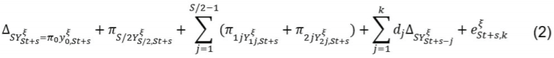
where:
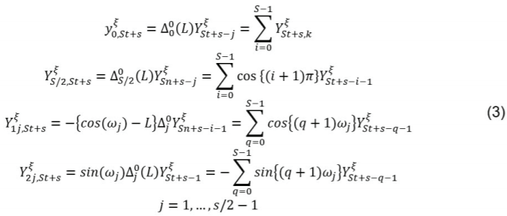
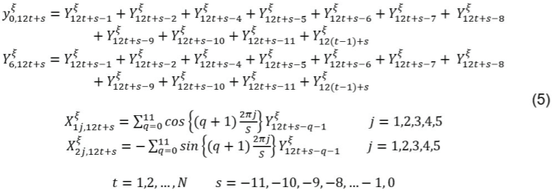
As this study considers monthly data, equations (2) and (3) become:

Where:
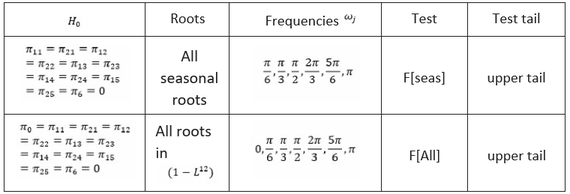
Hegy procedure testing reported the following tests:
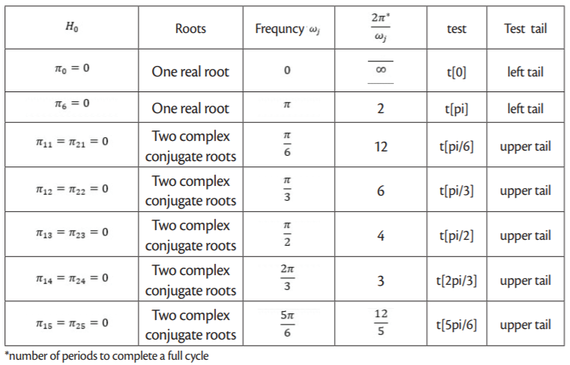
The following testes are reported also:
3. 2. 2 Lag – length selection
According to literature (Hall, 1994;Ng and Perron, 1995) different methods can be used in order
to determine the order of augmentation for the Hegy regression (e.g. criteria such as AIC, BIC or
MAIC, or sequential method). In this paper the sequential method has been used. The maximum
lag length ( ) was determined using following equation:

Where Int[.] is the integer part and T is total sample size. In the case when sequential method is
used, the lag selection procedure starts by fitting the model with  and tests sequentially for the significance of the coefficient associated with
 until the null is rejected. Following
the suggestion ofNg and Perron (1995), to determine the individual significance of the lags of
until the null is rejected. Following
the suggestion ofNg and Perron (1995), to determine the individual significance of the lags of
 , the researcher have to use the standard normal distribution
critical values and select a 10% level of significance the default value.
, the researcher have to use the standard normal distribution
critical values and select a 10% level of significance the default value.
3. 2. 3 Artificial neural networks
Due to the importance of tourism, complexity and variability of the numerous elements that should be considered in the implementation of an effective model, tourism demand modelling and forecasting is one of the most challenging fields in tourism research. In this context, the implementation of artificial neural networks has proved to be particularly advisable, thanks to their ability to approximate any kind of function within a desirable range (Thiesing and Vornberger, 1997;Crone, 2002).
The artificial neural network models consist of set of nodes (neurons) for processing input data and a set of connections for “memorizing” information. Through an activation transfer function, each node processes the input signal received from other nodes and produces a transformed output signal to other nodes (Claveira et al., 2015, 493).
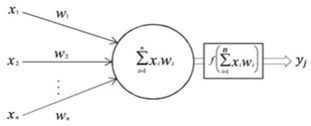
The inputs in a multilayer artificial neural network are connected to the output via a middle layer. Generally, the network model can be specified as:
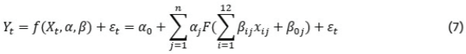
where:
Depending on the connecting patterns of different layers, two major types of architecture can be distinguished; feed-forward networks and recurrent (back propagation) network. Main difference between them is that in feed-forward networks the information runs only in one direction, since recurrent networks are feedback connections from outer layers of neuron to lower layer of neurons, which takes into account the temporal structure of the data. The data-driven nature of artificial neural networks makes those models overcome the limitation of traditional forecasting methods, including misspecification, biased outliers, assumption of linearity, and re-estimation. The modelling approach used in this paper consists of four main phases, as follow: data preprocessing, architecture selecting, training process and model performance evaluating. Data preprocessing implies that data were inspected and selected so there were no missing values. Also, all data were normalised by subtracting the minimum and dividing by the range, (x-min)/(max-min), so all normalized values were in [0,1] interval. Since the range of values of observed data varies widely, in some machine learning algorithms, objective functions will not work properly without normalization.
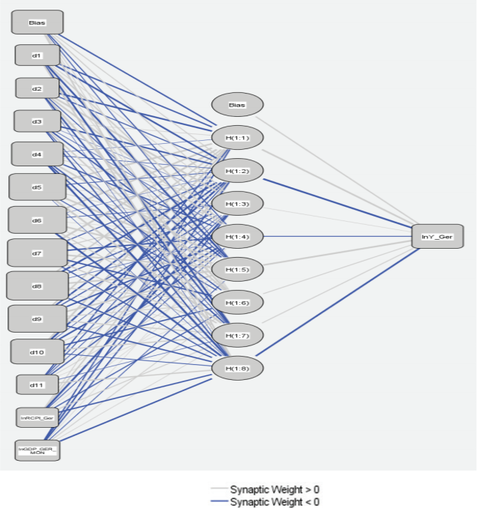
Constructing an efficient neural network involves choosing an appropriate architecture – the number of layers, units in each layer and the connections among units – selecting the transfer function of the middle and output units, designing a training algorithm, choosing initial weights and specifying rule. For this research, a common artificial neural network architecture is used, which can be described as: Continuous-valued input layer containing thirteen nodes (processing units) corresponding to the number of variables proposed to estimate the number of German tourist arrivals to Croatia, one hidden layer containing eight nodes to handle nonlinearities inherent in data set, and one output layer containing one node corresponding to the one dependent variable subject to the analysis.
After architecture selection it is very important to select which parts of the data set will be used in training, validation and holdout. The training set is the subsection of an observed data from which the machine learning algorithm “learns,” relationships between the input and the target variable. The validation set is another subset of the input data to which the machine learning algorithm has to be applied in order to see how accurately it identifies relationships between the known outcomes for the target variable and the dataset’s other features. The holdout subset, called also “testing” set, provides a final estimate of the machine learning model’s performance after it has been trained and validated.
In this paper the standard three-layer feedback artificial neural network model is used. One output node is employed. The activation function for hidden nodes is sigmoid function:
The sigmoid function takes real-valued arguments and transforms them to the range 0 to 1. The activation function for the output node is the identity function (pure linear function):

This function takes real-valued arguments and returns them unchanged. Bias terms were used in both hidden and output nodes.
After selecting the activation functions, the batch type of training was selected. This kind of training updates synaptic weights only after passing all training data records which means that this kind of training uses information from all records in training data set. The advantage of this kind of training is that it directly minimizes the total error, but for that purpose it need to update weights many times until one of stopping rules is met. Hence, the batch training may need many data passes.
3. 2. 4 Mean Absolute Percentage Error
After modelling German tourist arrivals to Croatia, it was necessary to examine the forecast accuracy of the chosen artificial neural network. Due to its advantages of scale-independency, and interpretability as well, in this research as a measure of modelling accuracy mean absolute percentage error (MAPE) has been used.
The Mean Absolute Percentage Error is expressed in generic percentage terms and it is computed by the following formula:

Where:
MAPE is measure which permits the comparison of different models, with different time periods
and number of observations. Measures based on percentage errors, such this, have the disadvantage
of being infinite or undefined if  for any observation
in the test set, and having extreme values when any
for any observation
in the test set, and having extreme values when any  is close to zero.
4. EMPIRICAL RESULTS AND DISCUSSION
In this section, the results obtained from empirical research are presented and discussed in detail. As previously mentioned, the results are based on a sample size that covers the period from January 2001 to December 2018, which includes 216 observations.
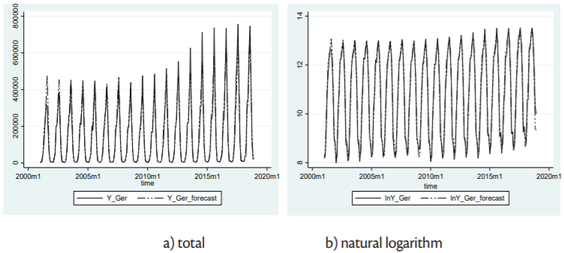
Figures2 to4 depict the evaluation of the analysed series in total [figure (a)] and in natural logarithm [figure (b)]. Primary goal is to determine whether the seasonality observed in time series show only a determinist nature or whether it is caused by the presence of unit roots.
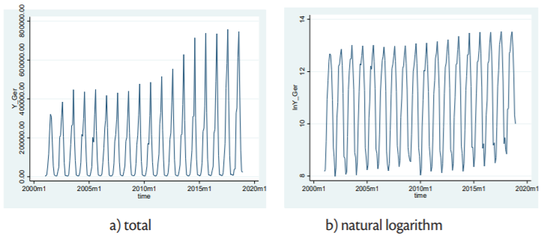
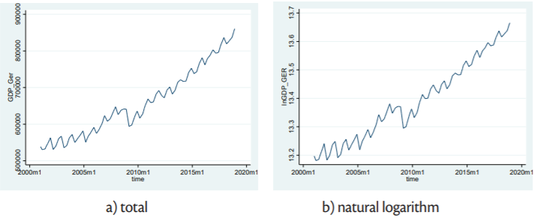
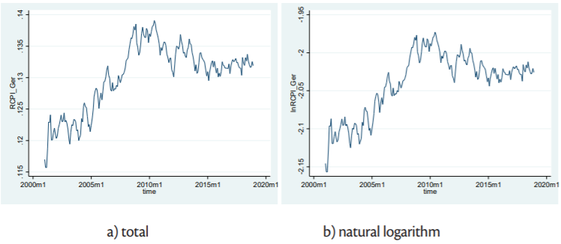
Based on the figures2 -4 it is decided to perform the further analysis on natural logarithm values of the data. Namely, to avoid the negative effects on the results of the seasonal unit-root testing which can be caused by changing variance (which is case in observed sample), it is advisable to analyse natural logs of the observed data.
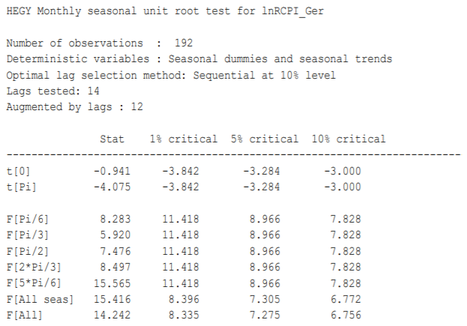
The results of the performed seasonal unit-root testing by HEGY approach are shown in tables1 - to3. The results will be interpreted at the 5% level significance.
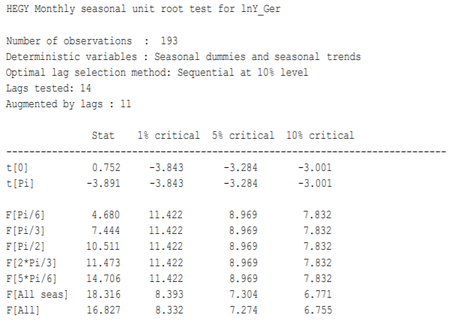
Based ontable 1, the null hypothesis of the presence of a unit root at frequency zero cannot be rejected. Note that t[0] statistics is a left-tail test; the reported statistics is less negative than the critical value associated with 5%l level. Therefore, the statistics do not fall in the rejection region of the null hypothesis. In the case of t[Pi] test (the other left-tail test), situation is opposite. Since the test statistic is smaller than the critical value, the null hypothesis of the presence of a unit root at the frequency π can be rejected. All the remaining tests (F[Pi/6] to F[All]) are upper-tail test, and as such, the null hypothesis can be rejected when the test statistics is bigger than the critical value. In this case, the null hypothesis is rejected in all tests, except in the case of the two complex roots associated with frequency π/6 (test F[Pi/6]) and π/3 (test F[Pi/3]). It can be concluded that one unit root at the frequency zero is found, as well as the two complex conjugate unit roots at π/6 and π/3 frequency. Based on HEGY test, when the lag length is determined by sequential method, the German tourist arrivals to Croatia have nonstationary behaviour associated with the zero frequency and the frequency associated with seasonal oscillations that complete a full cycle after 6 or 12 months.
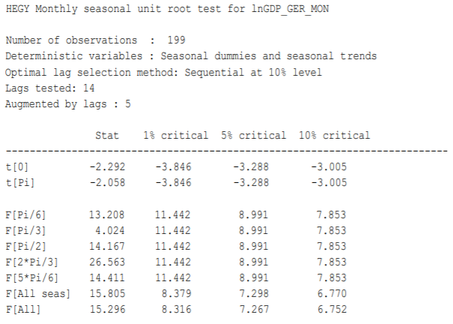
According to data intable 2, it can be concluded that logarithm of German gross domestic product has one unit root at frequency zero and π, but also two complex conjugate unit roots at the frequency π/3. That means that logarithm of German gross domestic product at market prices has nonstationary behaviour associated with the zero frequency, and with the frequency associated with seasonal oscillations that complete a full cycle after six months also.
Based on thetable 3, it can be concluded that the logarithm of the tourism price variable has nonstationary behaviour also. This series have one unit root at the frequency zero, and two complex conjugate roots at all other frequencies, except π and 5π/6. Since the dummy variables are seasonal categorical variables, the seasonal unit root test does not need to be performed on those variables.
After the presence of seasonal nonstationary behaviour has been confirmed, the creation of an artificial neural network was initiated. It should be stressed that a pre-processing was undertaken on the input and output data, corresponding only to a normalization in the range –1 to 1, for all the variables.
| N | Percent | ||
|---|---|---|---|
| Sample | Training | 125 | 57,9% |
| Testing | 68 | 31,5% | |
| Holdout | 23 | 10,6% | |
| Valid | 216 | 100,0% | |
| Excluded | 0 | ||
| Total | 216 | ||
Source: Authors
As shown intable 4, the analysed time series data were divided into three sets: the training set (125 observations), validation set (68 observations) and holdout set (23 observations).
As already said, the selected artificial neural network model is a multilayer backpropagation model type 13:8:1. As activation function in hidden layers the sigmoid function was used, and for the output node the identity (linear).
The final artificial neural network is depicted infigure 5.
The information from software output shows a couple of positive signs, which are shown below.
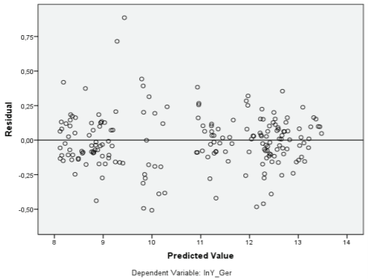
Thefigure 6 presents a residual-by-predicted-value chart for scale-dependent variable. As evident, there are no visible patterns between residuals and predicted values of dependent variable.
The importance of an independent variable is a measure of how much the network’s model-predicted value changes for different values of the independent variable. The normalized importance is the importance values divided by the largest importance values and expressed as percentages.
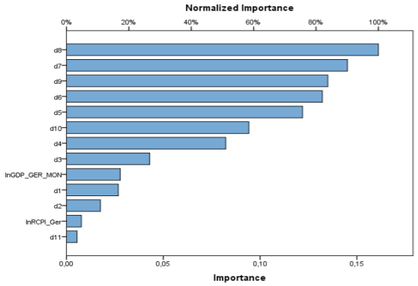
Thefigure 7 shows a bar chart of the values of importance, sorted in descending value of importance. As expected, the seasonal dummy variables for August and July have the greatest importance. Those variables have the greatest effect on the German tourist arrivals to Croatia, which was one of the assumptions of this research. As shown in figure, the weakest effect on the dependent variable is the effect of dummy variable for November. The following table presents the calculated values of independent variable importance.
| Importance | Normalized Importance | |
|---|---|---|
| d1 | ,027 | 16,6% |
| d2 | ,018 | 10,9% |
| d3 | ,043 | 26,7% |
| d4 | ,082 | 51,1% |
| d5 | ,122 | 75,7% |
| d6 | ,132 | 82,0% |
| d7 | ,145 | 90,1% |
| d8 | ,161 | 100,0% |
| d9 | ,135 | 83,8% |
| d10 | ,094 | 58,4% |
| d11 | ,005 | 3,4% |
| InRCPI_Ger | ,008 | 4,8% |
| InGDP_GER_MON | ,028 | 17,2% |
Source: Authors
The table above confirms the interpretation of thefigure 7. The most important variables are dummy variables for August (a contribution of 100% to the outputs) and July (a contribution of 90,1% to the outputs). The price variable has surprisingly low importance (4,8%), while the gross domestic product variable has more importance (17,2%) to the target variable. Such results can be explained by the assumption that the German tourists are primary motivated for traveling to Croatia not because of the service price or their purchasing power. They are probably motivated by some other variables, which are, in this research, included in the dummy variables.
The obtained artificial neural network model has been evaluated according to some accuracy criteria. According toBaggio and Klobas (2011,151) a MAPE value of 1,601% indicates a high model forecasting accuracy.
Source: Authors
The figure above confirms that backpropagation artificial neural model fits well the actual data through the sample period. Selected model shows that forecasted values of analysed series follow the behaviour of the empirical data set. The assumption that German tourist arrivals to Croatia are, besides tourism price variable and gross domestic product at market prices variable, strongly affected by seasonal impact is confirmed, which confirms credibility of Hegy seasonal unit root test conducted in the first part of the research.
5. CONCLUSION
Due to the importance of tourism for the Croatian economy, and the fact that tourists from German markets make the main number of international tourist arrivals to Croatia, the main purpose of this research was to examine the seasonality of the number of German tourist arrivals in the Republic of Croatia. The presence of seasonal unit roots is analysed using the approach developed by Hylleberg, Engle, Granger and Yoo – Hegy test. Based on the augmented HEGY test procedure the main conclusion is made; the German tourist arrivals to the Republic of Croatia have nonstationary behaviour associated with the zero frequency and seasonal frequency. After testing the seasonality occurrence, different neural network architectures were trained and tested. The proposed artificial neural network model confirmed the main assumption of this research - the German tourists are not primary motivated for traveling to Croatia because of the service price or their purchasing power. Analysis showed that the price and gross domestic product variables has much lower importance to the target variable in comparison to seasonal dummy variables. The calculated mean absolute percentage error – MAPE value of 1,601% indicates a high model forecasting accuracy. This kind of analysis forms an integral part of tourism policy and decision making regarding investment in public and private sector, as well as in marketing decisions in the Republic of Croatia. Therefore, this research is considered to be a good starting point for future research of the possibility of applying artificial intelligence methods in analysing tourism phenomenon. Future tourism research should be certainly addressed in investigating the possibility of using some other concepts of artificial intelligence. The ability of artificial intelligence to perform tasks which, traditionally, require human cognitive function, has made those methods useful for research in the tourism industry. As some previous research showed, as well as this one, the implementation of artificial intelligence approach primarily can save time and money and, at the same time, potentially eliminate human error and allow tasks to be performed quickly.
* This paper has been financially supported by the University of Rijeka, for the project ZP UNIRI 4/17.