
INTRODUCTION
According to Northouse’s [1] definition, leadership is a process in which an individual has an impact on a group with the purpose of achieving a common aim. The path-goal theory is one of the most significant approaches to leadership in the frame of contingency theories. Contingency and situational theories are valuable for recommending what leaders must or must not do in defined situations. Northouse1 claims that this approach is useful in numerous situations and highlights the need for adaptability of the leader. The path-goal theory is focused on the behaviour style of leaders and consideration of the situation and defines the regulations and recommendations that enable achieving group aims2. The path-goal theory was established by Evans3, analysing a leader’s behaviour choices in relation to their behaviour style, employees’ needs and conditions in the work environment. According to this perspective, the leader is not an individual who uses their power but has a role in support, and this approach is frequently defined as servant leadership. The most significant advancement in path-goal theory was provided by House4, who examined situation elements within which leaders search for solutions to motivate subordinates. The leadership styles that leaders can implement are directive, participative, supportive, and achievement oriented. At the same time, the work environment has components such as the characteristics of a workgroup, task structure, and formal authority system. Subordinates have characteristics, abilities, and needs. The path-goal theory is based on the motivation theory developed by Vroom5 and named expectancy theory. Since Vroom theory enables the identification of important things that can be done for the motivation of employees, it has important implications from managers’ and leaders’ standpoints6. According to this theory, subordinates will be motivated in the following situations: If they think that they are able to manage the task, if they believe that their efforts will result in certain success, and if they believe that compensation is in line with their effort5. Four types of leader behaviour according to the path-goal theory can be described as follows: 1) Supportive leadership includes a concern for the welfare of subordinates and the organizational climate. This type of behaviour tries to achieve a friendly environment2. Leaders attempt to meet the requirements, needs, and preferences of subordinates through the supportive style7. Subordinates are rewarded in the frame of this leadership style, and their motivation is encouraged. This leadership style accomplishes great results when subordinates are unsatisfied or frustrated. 2) Participative leadership enables subordinates to influence the decisions of leaders. Leaders encourage subordinates on critical considerations and suggestions, and leaders consult with them before decision-making7. 3) Directive leadership includes specific guidelines for subordinates and explanations about the expectations for employees. Directive leadership attempts to reduce role ambiguity among subordinates and to clarify their perceptions, which is positive in situations when tasks are unclear and problems are unstructured. When the requirements of subordinates are clear, this type of leader’s guidance can have the opposite effect. 4) Achievement-oriented leadership is defining challenging aims, searching for higher quality results, followed by the trust that subordinates will achieve the aims2. Adequacy of implementation of leadership styles is in a relationship with the situation. Leaders can change their style in line to best serve subordinates, and the same leader can simultaneously implement different styles; however, great leaders need to know when to apply which leadership style8-10. Supportive leadership is the most appropriate for subordinates who have the need for belonging, while directive leadership is a good choice for a group of subordinates who tend to need structure. For subordinates who have a need for control, participative leadership is appropriate because it provides them with satisfaction in decision-making. Achievement-oriented and directive leadership are appropriate when subordinates are focused on the possibility of solving the task. Those kinds of subordinates require directive leadership when they think that they have low capabilities, and with higher insight into their capabilities, these subordinates have a lesser need for the directive style. The aim of this leadership style is to boost subordinates’ self-confidence. Numerous authors refer to the abovementioned styles of leadership, but Euwema et al.11 point out directive and supportive behaviour because in previous research, these concepts have been successfully applied for years. Related to subordinates’ and leaders’ behaviour, subordinates are allocated to a given type of task, which means that the type of task defines the leadership style. Northouse12 states that directive leadership is motivating when tasks are complex and rules are unclear. Supportive leadership is motivating when tasks are repetitive. Unclear and unstructured tasks have a need for participative leadership, and challenges and complex tasks require achievement-oriented leadership. According to the path-goal theory, the right and successful work of subordinates is possible when leaders clearly define tasks to them12 p.500 and when leaders have the possibility to provide the required education for this work. In addition, leaders must help subordinates in work performance and provide a reward for successfully performing work.
12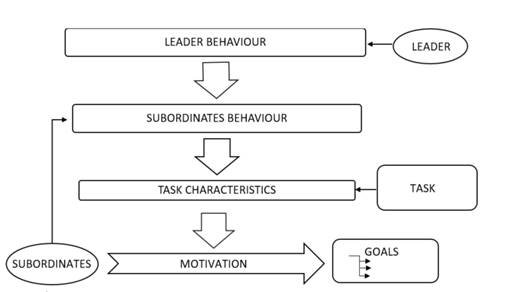 .
. The main features of the path-goal theory are clearly defined aims, providing support in performing tasks and rewards according to successful achievement of the aims. The approach to subordinates is relatively personalized because leaders have to define the approach that will be used for each individual and rewards for subordinates. Leaders must provide subordinates with conviction about their ability to meet expectations. Figure 1 shows the factors that impact subordinate motivation to achieve the goal.
LITERATURE REVIEW
In the field of path-goal theory, numerous articles have significantly contributed to this theory. Ever since the establishment of this theory in the ‘70s, a significant number of studies indicated empirical results in line with theory assumptions, although some results indicated opposite results, which can be explained in applied research methodology7,14. Farhan15 analysed the application of path-goal leadership theory in a learning organization. With the increasing importance of information and knowledge in the process of creating value, numerous leaders revert to creating learning organizations, in which the majority of employees are involved in the identification and solving of unstructured problems16. Farhan15 states that leadership style is the key support tool for creating learning organizations, especially the participative style, which can be described as the architect of organizational learning. Sarti17, in their research conducted on Italian human service organizations, validated a hypothesis about the positive relationship between work engagement (dedication and vigour) and implementation of the participative style. Additionally, in this article, Sarti17 analysed the relationship between work engagement and directive leadership style, and the relationship involved vigour and absorption but not dedication. Another research article18 defines the directive style as promoting task-oriented behaviour and a tendency to control discussions and dominate interactions. Bell et al.19 researched the impact of the directive and participative style on organizational culture in university administrative departments in South Africa. The results indicated a positive and significant impact of both styles on organizational culture, which was measured by four cultural facets of involvement, consistency, adaptability, and mission. Furthermore, the relationship between directive and participative leadership styles and the performance of Israeli school staff teams were analysed in an article20. Somech20 states that the directive leadership style has value, especially for leaders (teachers) who operate in an ambiguous work environment. Although participative leadership style is preferred in modern educational policies, that style is not always related to improvement. Depoo and Shanmuganathan21 researched a multinational organization in the US and identified the relationship between brand management and leadership style within the frame of path-goal theory, and the most representative approaches are a coaching style (which contains the supporting style) and the directive style. Supportive leadership style is a characteristic behaviour within the frame of path-goal theory and is indicated in most research articles. In the process of organizational changes and learning, it is important that leaders implement a supportive leadership style to manage subordinate anxiety22. Furthermore, House7 indicated that causes of stress that can have an influence on employees dictate the implementation of a supportive leadership style. Khalid et al.23, who analysed leadership in educational institutions in Pakistan, indicated that “when employees serving in any organization receive support from their leaders, the level of stress decreases and job performance is improved”. La Rocco and Jones24 researched the US Navy and indicated that supportive leadership contributes to both job satisfaction and the level of satisfaction with the organization, which was described in the book by Bass and Bass25. The relationship between the supportive leadership style and interpersonal helping behaviours was analysed by Rafferty and Griffin26, under the guiding question “if it is supportive leadership style truly transformational?” Namely, supportive leadership is focused on the satisfaction of subordinates’ wishes, but this can result in the absence of organizational performance7,26. Path-goal theory was analysed in the telecom industry of Pakistan27. An analysis of the relationship between all four leadership styles and job satisfaction in telecom companies in Chad was conducted by Dokony et al.28. Research in the field of leadership for several decades has focused on transformational leadership, so one-half of the articles are about transformational leadership29,30. Consequently, the study of the path-goal model is not the focus of scientists; this is also the case in Croatia. Udovičić et al.31 analysed leadership style based on the leadership model developed and established by R. Likert in Croatian entrepreneurship. Furthermore, Miloloža32 researched the presence of autocratic, democratic, and laissez-faire leadership styles and the relationship between leadership style and the size, growth phase, and international orientation of the organization. The impact of gender was researched by Van Emmerik et al.33, who defined the hypothesis “female managers score higher on consideration than male managers”, which includes elements of classical leadership styles: consideration and initiating structure. Consideration refers to friendly and interpersonally supportive supervisory behaviour34, while initiating structure refers to task-oriented and directive behaviour34. Van Emmerik et al.33 conducted research on a database with 64 000 subordinates from GLOBE societal clusters. GLOBE is a project that addresses the research of practice and values in sectors of industry, organizations, and society35. GLOBE indicated ten cultural clusters that involve 61 nations36. GLOBE researchers measure culture and try to define its relationship to the effectiveness of leadership. Research results indicated a high mean of measures of consideration (supportive style) among subordinates who have female managers in Nordic countries in the frame of Globe Clusters. In line with expectations, research indicated female leaders achieved better results on measures of consideration style than male leaders. One insight that is outstanding is that female leaders also have a higher level of measures of initiating structure (directive behaviour) than male managers. A key finding of the analysis is “that female and male managers do not differ much in leadership behaviours”, which is related to existing stereotypes regarding gender33. Research results conducted by Kent et al.37 indicated that men and women lead using the same behaviours. Polston-Murdoch10 researched the relationship between leadership style and commitment of subordinates according to leaders, relative to leaders’ gender. The results indicated no significant evidence that this relationship is dependent on leaders’ gender. Previous research indicated that “women may be viewed as more supportive and affective with characteristics involving the management of emotions”38 as stated by Polston-Murdoch10. Thacker39 states that expectations for female leaders are characterized by participative leadership style and behaviours focused on relationships. Lord et al.40, according to an analysis of the literature, state that females are proven to be more successful leaders in the task of developing supportive relationships with subordinates. Becker et al.41 state “that the female leaders work in nontraditional roles”. In recent times, the number of articles that are focused on female leadership has increased, and especially prominent examples include the book by Sally Helgesen42 and the publication of Chamorro-Premuzik43 on the topic of women’s leadership competency gap. Chamorro-Premuzik43 argued why male leaders are more often chosen in practice and states that “leaderless groups have a natural tendency to elect self-centred, overconfident and narcissistic individuals as leaders and that these personality characteristics are not equally common in men and women”.
THE COVID-19 PANDEMIC AND LEADERSHIP
In December 2019, in the city of Wuhan, China, the appearance of a disease caused by a coronavirus was reported, which quickly spread to the whole country and later to the world. In February 2020, the meeting of the EU Health Council and Ministers of Health defined conclusions about COVID-19. At the end of February, the impact of the disease COVID-19 on the industry of the European Union was considered by the European Commission44. Later, measures defined in all countries had an impact on people’s behaviour, especially in organizations, by coordinating their movement, attendance in the workspace, and contacts, as leaders in organizations and their subordinates had to adapt to new factors in the environment. One of the rare articles that analyses the path-goal theory in the COVID-19 pandemic situation is Mercedes and Burrell45. Their questionnaire (adapted by46) addresses assessments of the statement “I create a clear path and vision concerning problems and solutions,” which is related to ideas of the path-goal theory. The majority of articles related to the COVID-19 environment are not structured within the framework of leadership theory. Leader behaviours in COVID-19 pandemic time, especially in the health system in England, were analysed in a article47, where academics concluded that “leaders who have excelled are those who have shown compassion, empathy, connectedness and even vulnerability”. Furthermore, leadership in school in the COVID-19 pandemic was researched by Harris and Jones48, where the authors state that “leading in disruptive times means being able to navigate a different course, to create new pathways through the disruption”. Research conducted by Lee49 in the United Kingdom analysed the need to create an environment where leaders support subordinates. Antonakis50 claims that they trust that scientists will recognize the need to study leadership because it is an effective tool that has to be used in the fight against the viral pandemic. Research that appreciates and refers to the leadership theory frame includes a article by Claus51, in which she defines a new approach to leadership research, New Leadership Practices and Skills Due to COVID-19, with three dimensions: leading organizations in turbulent times, leading a distributed workforce (individuals and teams), and being a resilient leader. All of these dimensions51 elaborate expectations from leadership. Watkins and Clevenger52 through the prism of two dimensions, context and control, and stated that the framework has the aim of demonstrating how leadership style affects crisis behaviour and communication. Behaviour in crisis leadership was described by Boin et al.53. Eichenauer et al.54 researched leadership behaviour during COVID-19 through task assessment, activities (planning, clarifying, supporting, and empowering), and differences between female and male leaders. Furthermore, academics researched stereotypes that females lead to more communal behaviour and males lead to more agentic behaviour55 and indicated a small difference in behaviour. Chen and Sriphon56 researched leadership in organizations in Asia according to the relationship between the following constructs: (1) trust, (2) communal relationships, and (3) social exchange relationships and characteristic factors of COVID-19. The most important results are that remote work interrupted trust and relationships between leaders and employees during pandemics.
RESEARCH GAPS AND RESEARCH ISSUES
Leadership research in the COVID-19 pandemic is present and growing, although the number of articles focusing on path-goal theory is not particularly exceptional; therefore, it is worth covering this area, especially in regard to the situation in Croatia. Furthermore, research on leadership styles of Croatian managers is relatively underrepresented. Among the potentially interesting issues here is the segment related to women in the role of leaders. Guided by these observed gaps, we formulated the following research questions: RQ1. Under pandemic circumstances, did leaders in Croatian organizations change their leadership style? RQ2. Do leaders in Croatian organizations have a difference in leadership styles based on gender? RQ3. Is the dominant leadership style subject to the influence of other factors, such as the leader’s age and level of education and the organization’s size?
METHOD AND RESEARCH
We conducted a survey of leadership practice in the Republic of Croatia through the PGT model at the end of 2021, with the aim of addressing research issues. It should be noted that in the middle of the last year, there were approximately 170 000 active business entities in the country. The corresponding questionnaire was sent by e-mail to approximately 1950 randomly selected addresses of experts and managers, and we had no knowledge of the positions of individuals in their organizations. Therefore, it was suggested that the answer to the questionnaire be provided only by managers or leaders in their companies. The questionnaire, is presented in the Appendix section, is taken from the author Northouse1, pp.145-146 and includes 20 self-assessment questions regarding the frequency of application of characteristic leadership styles, according to R. House theory4. We received 77 valid responses, of which seven respondents failed to give an overview of leadership practices before the COVID-19 pandemic. Since we did not have information about the positions of individuals in organizations when sending the questionnaire, the questionnaire also received a large number of experts who are not in leadership positions. They were not expected to send a response. Therefore, the real response rate of leaders is significantly higher than the 77/1950 ratio. The basic demographics of the sample relevant to the research questions is presented in Table 1.
RESEARCH INSTRUMENT
For the purposes of this research, a questionnaire of the PGT model by Northouse1, pp.145-146 was used, which is based on the self-assessment of the managers and is presented in the Appendix. The author adapted the questionnaire according to the works of Indvik56,57. The questionnaire contains twenty statements relevant to leadership styles to which leaders responded by selecting numbers in the range 1-7, where one indicates disagreement with the statement and seven, full agreement. In concluding the frequency of application of a particular characteristic style, according to the PGT, the following rules are followed1: first reverse the scores for Items 7, 11, 16, and 18; then calculate for the directive style assessment: sum the scores on Items 1, 5, 9, 14, and 18; for supportive style assessment: sum the scores on Items 2, 8, 11, 15, and 20; for participative style assessment: sum the scores on Items 3, 4, 7, 12, and 17; for achievement-oriented style assessment: sum the scores on Items 6, 10, 13, 16, and 19. According to suggestions1, the assessment of achievement (high, common, low) is presented in Table 2.
| Considered high | Common score | Considered low | |
| Directive style | above 28 | 23 | below 18 |
| Supportive style | above 33 | 28 | below 23 |
| Participative style | above 26 | 21 | below 16 |
| Achievement-oriented style | above 24 | 19 | below 14 |
METHODS
The collected data were analysed using statistical methods, IBM SPSS FP v28 and JASP v0.16. Principal component analysis was applied to determine the components that describe and factorize the respondents’ answers. Then, the t test was applied to the variants paired samples test and independent samples test. The paired samples test was used to determine whether there was a change in the frequency between the prepandemic and COVID-19 pandemic cases. In investigating the potential significant differences between groups (Table 1) regarding the frequency of choosing a particular leadership style, the independent samples t test was applied. Since the assumption of normal distribution was not met when testing some groups in the sample, the Mann–Whitney U test was also used to determine significant differences between groups in arrangement with independent groups. As an alternative to the t test, in the absence of conditions for distribution normality, the nonparametric Wilcoxon signed ranks test method was applied. This test was used in the analysis of data for related dependent groups, i.e., for the purpose of determining differences in the frequency of leadership styles in two time periods among the same respondents.
RELIABILITY AND VALIDITY ANALYSIS
Respondents’ answers to 2 questionnaires (prepandemic leadership status and leadership styles during the COVID-19 pandemic) were tested using the Alpha-Cronbach method. These include 70 answers to the first questionnaire of 20 questions and 77 answers to the second questionnaire. It turns out that this factor indicating consistency for the overall set of responses results in a Cronbach’s alpha = 0,92 (Table 3), which can be considered an excellent indicator of reliability, according to, for example, Cortina58.
| Reliability Statistics | ||
| Cronbach’s Alpha | Cronbach’s Alpha Based on Standardized Items | N of Items |
| ,924 | 925 | 40 |
We also checked the internal consistency among the respondents’ answers which focused on leadership during the COVID-19 pandemic (77 of them), and the result as a factor indicating consistency was Cronbach’s alpha = 0,84. This can be considered a very good fulfilment of the conditions of reliability. To determine the adequacy of the data, we also applied a validity analysis through the Kaiser–Meyer–Olkin (KMO) test. The idea behind this check is to gain insight into the adequacy of the sample data before performing the factor analysis procedure. The preferred value of the KMO test is 0.5 or slightly more59, and Bartlett’s aspherical value should have significance. We see that these conditions are met since the KMO factor is 0,711 (Table 4). This score suggests that there are sufficient items for each factor.
| KMO and Bartlett’s Test | ||
| Kaiser–Meyer–Olkin Measure of Sampling Adequacy | 0,711 | |
| Bartlett’s Test of Sphericity | Approx. Chi-Square | 660,070 |
| df | 190 | |
| Sig. | < 0,001 | |
For the results of the leadership questionnaire during the COVID-19 pandemic, we performed an analysis using the SPSS tool, applying principal component analysis. In doing so, we preferred to identify four factors, expecting the agreement of the individual components (Table 5) with the characteristic items of individual leadership styles. In addition, the rotation method varimax with Kaiser normalization (rotation converged in 6 iterations) was applied.
The obtained results can be interpreted in such a way that if we set the threshold of the importance of impact/weight to approximately 0.5 (allowing 0.49; marked with an asterisk *), then we determine the state of components in terms of leadership styles, taking into account the description of the research instrument by style: • component 1 – participative style (questions 3, 4, 7, 12, and 17) and supportive style (questions 2, 8, 11, 15, and 20) explain 8 of the 9 main contributions of component 1, which enter with weights ≥ 0, 5; (listed questions marked bold), • component 2 – achievement-oriented style (questions 6, 10, 13, 16, and 19) explains 3 of the 4 main contributions of component 2, which enter with weights ≥ 0.5; (listed questions marked bold), • component 3 – directive style (questions 1, 5, 9, 14, and 18) explains 3 of the 3 main contributions of component 3, which enter with weights ≥ 0.5; (listed questions marked bold), • component 4 – inverted answers (questions 7, 11, 16, and 18) explain 3 of the 3 main contributions of component 4, which enter with weights ≥ 0.5; (listed questions marked bold). Thus, the questionnaire distinguishes directive style and achievement-oriented style, while supporting and participative leadership styles place in the same factor (in component 1). What obviously had an impact on the respondents was the appearance of inverted answers where high agreement with the statement was converted into a small contribution to the corresponding leadership style and vice versa. Namely, if a certain model of selection that includes a frequent preference for higher grades (e.g., 6 and 7) suddenly asked for a grade that should be low (for example, 1 or 2), it is possible that this created some confusion among respondents. Overall, we can assume that the self-assessment questionnaire on the frequency of leadership styles1 contains relatively separate components that describe these styles.
RESULTS
THE DOMINANT STYLE IN THE REPERTOIRE OF LEADER BEHAVIOUR
Considering all the specific leadership styles that an individual leader can present in his or her repertoire of behaviours over time, we have formulated Table 6, which considers three levels of frequency of application of individual styles. It should be noted that the highest level regarding direct leadership is achieved in as many as 66.2 % of cases, while for this style, there are no cases of low performance. Results are similar to the style of achievement orientation, where as many as 74 % of respondents have a high level of achievement. The participative style has a highest level in 41.5 % of cases. It should be emphasised again how the path–goal questionnaire provides information about which style of leadership is applied how often1, pp. 147.
| Directivestyle | Supportive style | Participative style | Achievement oriented style | |
| Average score | 29,662 | 29,338 | 25,610 | 26,714 |
| High level (No.) | 51 | 9 | 32 | 57 |
| Low level (No.) | 0 | 2 | 0 | 0 |
| High l. (%) | 66,23 | 11,69 | 41,56 | 74,03 |
The supportive style stands out because only 11,7 % of respondents represent this style with the highest level of frequency, and in addition, there are established results of very low representation (in 2 cases), which was not noted in other styles. Therefore, this style has a low frequency given the basic, pre-survey expectations.
THE IMPACT OF THE COVID-19 PANDEMIC ON LEADERSHIP STYLE
Respondents answered questions about their approach to leadership during the pandemic (also when the questionnaire was implemented) and before the pandemic period. To determine possible changes in preferences regarding leadership style, in this part of the results, we analyse for each of the 20 questions — is there a statistically significant difference between the answers of respondents? The t test method was therefore applied for the same sample but with records for two time periods, meaning “the paired samples t test” (SPSS), which compares the mean values of two measurements taken from the same respondent. Since we are not only interested in strict statistical significance, we performed this test first without checking the sample normality prerequisites (Table 7).
In Table 7 and further in the article, BCov stands for “Before COVID-19“. Regarding stricter conditions, if we take into account the threshold p < 0.1 with two 2-sided p, we obtain the result that a significant difference exists only in question number 2. This second question concerns maintaining friendly working relations with subordinates (Appendix). With the criteria mitigated, considering one-sided p with significance (p < 0.1), i.e., looking at the indication in which direction the changes are going, then the following results are obtained for queries: Q5 (I inform subordinates about what needs to be done and how it needs to be done), Q9 (I ask subordinates to follow standard rules and regulations.), Q10 (I set goals for subordinates’ performance that are quite challenging), Q11 (I say things that hurt subordinates’ personal feelings), Q12 (I ask for suggestions from subordinates concerning how to carry out assignments), Q14 (I explain the level of performance that is expected of subordinates), and, at the end, Q18 (I give vague explanations of what is expected of subordinates on the job). However, testing the normality for differences between pairs of scores on the same questions where significant differences are inferred, we obtain a result that indicates that there is not a normal distribution (Table 8).
Therefore, we cannot even accept the results from Table 7 for the t test, and consequently, we consider the solution provided by the nonparametric test below in question Q2. or the case of related samples it is possible to apply the Wilcoxon signed rank test (Table 9), which does not require the condition of a normal distribution of differences. The obtained result shows a statistically significant difference at the level of p < 0.1.
The next thing that was done as part of the examination of the impact of the COVID-19 pandemic on leadership style was to summarize the answers to specific groups of questions to determine the results for specific leadership styles. Therefore, a calculation was made according to the instructions from the questionnaire1 for each individual leadership style, and a characteristic sum is relevant, both at the time of the COVID-19 pandemic and before the pandemic period. Table 10 contains the results for the average values of the four PGT leadership styles.
Below, we analyse the overall results according to the preferred leadership styles because we are interested in the difference in the situation before and after the pandemic. Using two tests of normality, Kolmogorov–Smirnov and Shapiro–Wilk, we find differences in related pairs belonging to certain styles (before the pandemic and at the time of the pandemic) that do not meet the condition of normal distribution. Therefore, we approached the application of nonparametric methods, specifically the Wilcoxon Signed Rank Test, for two samples of connected subjects. The final result indicates a statistically significant difference in the directive style, where the average frequency of this style before the pandemic was higher than during the COVID-19 pandemic. We interpret the results in Table 11 through the rule that a positive z score indicates a negative difference and vice versa.
Using the nonparametric Wilcoxon Signed Rank Test, which is equivalent to the t test for dependent samples, we confirm a statistically significant difference in the frequency change of the directive style (with p < 0.05) and an indication of the change in the achievement-oriented style frequency (with p < 0.1) within the answers to both questionnaires (70 of them).
THE DIFFERENCE IN LEADERSHIP STYLES WITH RESPECT TO GENDER
To research whether gender influences the outcomes regarding the choice of leadership style, i.e., the frequency of certain styles according to PGT, a t test was applied to the answers related to the period of work and leadership in the COVID-19 pandemic. Data on the groups “male” and “female” are contained in Table 1, while in Table 12 there is a label 1 for the group of male respondents (44 of them) and a label 2 for the group of female respondents (33 of them).
The results of the t test method for independent samples are shown in Table 13. Given the prevalence of the supportive style, there is a visible difference between the two groups with a significance of p <0.1 regardless of the assumption: “Equal variances (not) assumed“. The group of female respondents more often applies a supportive leadership style, at the level of significance p <0.1.
In Table 13, “EV“ means equal variances. For the application of the t test, we wanted the tested and validated samples to meet the necessary prerequisites, such as independence, normality, and approximately equal variance61. The normality of the distribution was checked by the Shapiro–Wilk test (Table 14). Since the null hypothesis for the Shapiro–Wilk test is that the variable is normally distributed in some populations and that the null hypothesis is rejected if p <0.05, we note here that the normality condition for the directive style distribution is not met. However, for the supportive style, the condition of the normal distribution of the variable is satisfied.
Thus, looking at genders, we obtained a statistically significant difference p <0.1 in favour of females for the frequency of applying a supportive leadership style. No statistically significant difference was found between groups of respondents formed by gender for other leadership styles.
INFLUENCE OF OTHER FACTORS ON PARTICULAR LEADERSHIP STYLES – THE SIZE OF THE ORGANIZATION AND THE DEGREE OF LEADER EDUCATION
Investigating the impact of environmental factors related to the size of the organization, we identified two independent groups of respondents, 40 from the category “Micro and small enterprises“ (label 1 in Table 15) and 37 from the category “Medium and large organizations“ (label 2 in Table 15).
Using the t test method for independent samples formed on the basis of size, the results obtained on the frequency of styles are shown in Table 16.
There was a statistically significant difference between the groups in terms of the frequency of application of the leadership style, with p <0.1. For other styles, there was no difference with the feature of statistical significance. Furthermore, we apply the test of normality (Shapiro–Wilk) to test the assumption of distribution normality, and here, we obtain a specific deviation result for Group 2 (medium and large enterprises) in the distribution for the directive leadership style (Table 17). Since the normality test for directive style suggests a deviation, we must seek confirmation of the results by another method. We therefore apply the nonparametric Mann–Whitney U test, which is commonly used when there is doubt about the normality of the sample distribution. This test is suitable for ordinal variables, such as scoring outcomes using the Likert 7-point scale, and can be applied to independent samples when there is no normal distribution of variables.
The results obtained using both student’s t test and the Mann–Whitney U test are shown in Table 18. The JASP statistical tool was used to apply and compare both methods. The Mann–Whitney test also suggests a statistically significant difference in groups formed by organization size and for the frequency of directive leadership style, even with a stricter parameter for statistical significance (p <0.05).
The application of directive leadership style in larger organizations is more frequent in the sample, with statistical significance of p <0.05. Frequency in other leadership styles does not “feel” the effect of the contingency size factor (Table 18). Since one of the conditions for the application of the Mann–Whitney U test states that the shapes of distributions by groups must meet the requirement of similarity, based on the analysis of Figure 2, we can say that a certain degree of similarity exists.
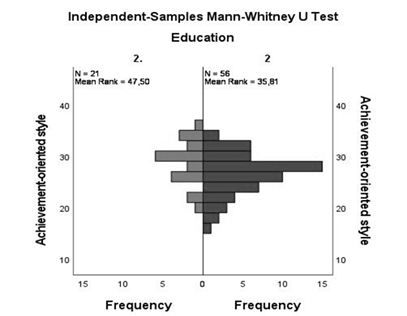
Determining the impact of education level on the frequency of leadership styles according to PGT was the next task. As noted in Table 1, we identified two independent groups of respondents, 21 from the category “Up to Bachelor’s degree“ and 56 from the category “Bachelor’s, master’s, and doctoral degrees“. In Table 19, mark 1 is for the group “Up to Bachelor’s degree“, while mark 2 is for the group “Bachelor’s, master’s, and doctoral degrees“.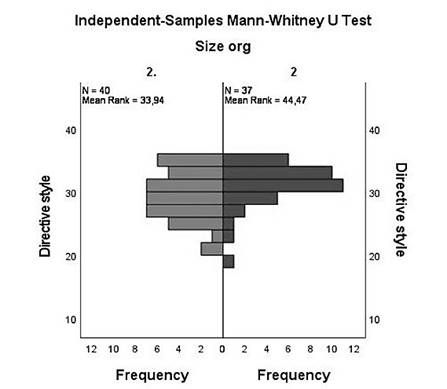
Table 20 contains the results of the t test, assuming a normal distribution. A statistically significant result was recorded in the PGT leadership style “achievement-oriented style“. The group of respondents who have lower formal education estimate a higher frequency of applying achievement-oriented leadership style compared to the more educated group. A statistically significant difference was defined as p≤ 0.05.
Furthermore, we apply the test of normality (Shapiro–Wilk) to test the assumption of distribution normality, and here, we obtain the result of the deviation of both groups in the directive style and Group 2 in the supportive style. The results are shown in Table 21. The variables in the achievement-oriented style assessment satisfy the normality test.
Since in assessing the impact of a leader’s level of education on styles, we have a group with N = 21 members, this is an additional argument that the conclusions are checked using the Mann–Whitney test, as a nonparametric test for which there are no strict prerequisites.
Table 22 contains the results of the independent samples test, and the conclusion is unchanged, so with a significance level of p <0.05, the hypothesis of equal distribution for achievement-oriented style in groups of more educated and less educated leaders is rejected. Finally, regarding the similarity of the distribution samples, we analysed Figure 3, and we can conclude that a degree of similarity between the samples exists. The results for Group 1 on the y-axis appear at slightly higher levels and end at higher levels, and the highest frequency is also at higher levels compared to Group 2.
DISCUSSION
The first goal of the research in this article was to determine whether and to what extent the impacts of the COVID-19 pandemic are reflected in leadership styles, defined through the PGT model. Using a questionnaire presented by Northouse1, we examined the observations of leaders in Croatian organizations regarding the frequency of applying certain leadership styles. Looking at the individual questions contained in the instrument, only question Q2 (Appendix) was marked by a statistically significant difference (p <0.1), so the statement “I maintain a friendly working relationship with subordinates“ in the period of a pandemic is less accurate, and the frequency of such behaviour of leaders is less present. Such a conclusion is in agreement with the discovery made by Chen, et al.61 that during the pandemic, telework undermined trust and relationships between managers and employees. In addition, indications of changes of no statistical significance relate to differences in behaviour with respect to statements Q5 (higher frequency), Q9 (higher frequency), Q10 (lower frequency), Q11 (lower frequency), Q12 (higher frequency), Q14 (higher frequency) and Q18 (higher frequency), and details of these queries can be seen in the Appendix section. Using the nonparametric Wilcoxon signed rank test, we confirmed a statistically significant difference in the frequency of use of the directive style (with p < 0.05) and an indication of the change in the frequency of achievement-oriented style (with p < 0.1) for the behaviour of respondents who answered both questionnaires. The frequency of the directive style increased somewhat during the COVID-19 pandemic, which means that leaders, on average, are more likely to give specific guidance and various explanations to followers. Of course, during the COVID-19 pandemic, basic instructions were relatively often given to citizens and employees regarding the new rules, so the growth of the presence of the directive style was expected. There are certain similarities between leadership in the general, undifferentiated work environment noted by the author20 and the circumstances of the COVID-19 pandemic, which favour a task-oriented, directive leadership style. At the same time, with the onset of the COVID-19 pandemic period, the frequency of achieving the achievement-oriented style decreased. Since this style reflects a leader’s behaviour where he poses challenges seeking greater achievement with confidence in employees20, it is not surprising that this approach has decreased. The conditions of the COVID-19 pandemic imposed healthcare priorities, models of working from home, isolation of individuals, and the like, which reduced attempts to raise the ladder of achievement. In the general assessment of the achieved levels of PGT leadership styles at the present time of pandemic rule, the supportive style stands out. Although it is a style characterized by concern for employee welfare and the creation of a desirable organizational climate, with this model, only 11.7 % of respondents reported applying this style the most often. Furthermore, in accordance with the interpretation model for the questionnaire1, pp. 146 in the supportive leadership style part, we also found a very low representation of this behaviour. Surprisingly, low levels were not observed in the remaining three styles of the PGT model. Good effects of the application of supportive style are recorded in the studies of Schein22, Khalid, et al.23, and Bass and Bass25. By testing groups of leaders formed by gender, the frequency of supportive style leadership results in a statistically significant difference (p < 0.1), in favour of female leaders. This result is in line with the findings of a study of subordinates from GLOBE societal clusters conducted by Van Emmerik, et al.33, where a higher level of friendly supportive behaviour was found in female managers and is also consistent with the findings of Lord, et al.40. The influence of the organization’s size in the conducted research proved to be significant in terms of the frequency of the directive style of the behaviour of leaders. The application of this style in leaders from larger organizations in the sample is more frequent with statistical significance (p < 0.05). It is possible that this circumstance has caused the initiation of structure, as noted34, or perhaps the need to maintain structure. It is known that structure is more important in larger organizations. A statistically significant result (with p <0.05) was obtained for the analysis of the achievement-oriented style of behaviour of groups of more educated and less educated leaders using the Mann–Whitney test. Less educated leaders are more likely to apply an achievement-oriented style that Northouse12 describes as desirable and challenging with complex tasks. With regards to limitations of research instrument, we should stress that the applied Path – Goal Leadership Questionnaire1 is based on self-assessment of leaders, thus providing “self-reported data“, potentially yielding undesirable biases such as selective memory and others. As far as we know based on the analysis of other publications, no more advanced version of this tool for verifying leader responses by subordinate employees or even colleagues has been applied. A comprehensive consideration of the application of 360-degree assessments can be found in study63, while for example for management skills assessment research62 is relevant.
CONCLUSIONS
Consistent with self-judgement, leaders in Croatian organizations have changed their leadership style in the circumstances of the COVID-19 pandemic, albeit not dramatically. To a lesser extent, it strengthened the directive leadership style. The application of the directive style by leaders from larger organizations is more frequent. A leadership style that is in some ways deficient in representation is supportive leadership. For this style, female leaders in Croatian organizations declare a higher frequency of application than their male counterparts. Leaders of Croatian companies with lower education prefer an achievement-oriented style. The frequency of using a participative leadership style has changed the least during pandemic conditions. In addition, for this leadership style, no differences were found between groups formed according to demographic criteria. Future research on leadership in Croatian companies will be directed towards recent theoretical concepts such as team leadership and multilevel leadership.
APPENDIX: QUESTIONNAIRE (PATH–GOAL LEADERSHIP QUESTIONNAIRE
Indicate how often each statement is true of your own behaviour. 1 = Never 2 = Hardly ever 3 = Seldom 4 = Occasionally 5 = Often 6 = Usually 7 = Always 1. I let subordinates know what is expected of them. 2. I maintain a friendly working relationship with subordinates. 3. I consult with subordinates when facing a problem. 4. I listen receptively to subordinates’ ideas and suggestions. 5. I inform subordinates about what needs to be done and how it needs to be done. 6. I let subordinates know that I expect them to perform at their highest level. 7. I act without consulting my subordinates. 8. I do little things to make it pleasant to be a member of the group. 9. I ask subordinates to follow standard rules and regulations. 10. I set goals for subordinates’ performance that are quite challenging. 11. I say things that hurt subordinates’ personal feelings. 12. I ask for suggestions from subordinates concerning how to carry out assignments. 13. I encourage continual improvement in subordinates’ performance. 14. I explain the level of performance that is expected of subordinates. 15. I help subordinates overcome problems that stop them from carrying out their tasks. 16. I show that I have doubts about subordinates’ ability to meet most objectives. 17. I ask subordinates for suggestions on what assignments should be made. 18. I give vague explanations of what is expected of subordinates on the job. 19. I consistently set challenging goals for subordinates to attain. 20. I behave in a manner that is thoughtful of subordinates’ personal needs.