
INTRODUCTION
The experience economy, which gave priority to creating experience in economic activities in the 1990s, brought experiential marketing to the fore. Therefore, this situation has added excitement and fun to the annoying practices of traditional marketing and the winds of change have started1. Experiential marketing is a marketing concept that aims to create loyal customers by tapping into customer emotions and gives a positive feel to the products and services offered by the company. In this approach, the company creates a product or service by touching the senses, hearts and minds of customers2. Customer satisfaction occurs when products enable customers to have a memorable experience in a positive way, and satisfied customers continue to use the same product or service, turning into loyal customers and telling their experiences to others. Gilmore and Pine3 define experiential marketing as memorable events or experiences that engage the senses and engage the consumer individually by giving the consumer the necessary information to make a decision. Gentile, Spillerand and Noci4 stated that customer experience results from a series of interactions that cause a reaction between a customer and a product, a company, or part of its organization. This experimentationis purely personal and expresses the participation of the client at diverse levels (rational, emotional, sensory, physical and spiritual). The widespread use of the internet and the increasing competition among retailers, together with the time constraints in traditional shopping, the shopping environment and the decrease in perceived values, have led to the use of virtual experiential marketing practices5. Virtual experiential marketing encompasses a variety of applications such as chat rooms, interactive displays, virtual communities, blogs, online games to create an enriched experience through visual and auditory cues to create an immersive experience. Virtual experiential marketing is based on interfaces that act as intermediaries for real-world experiences, as opposed to a physical experience that directly affects the senses6. Therefore, an electronic virtual environment can interact with consumers, offer them unique experiences, arouse their emotional response, and ultimately enable businesses to gain competitive advantage and create customer loyalty7. Schmitt8, after making some observations or participating in certain events, determined that there are certain stimuli that trigger consumers’ motivation to make a purchase and proposed the concept of strategic experiential modules. These experiences (modules) include sensory experiences perceived by the five senses (perceiving), emotional experiences (feeling), creative cognitive experience (thinking), physical experiences, behavior and lifestyle (acting), and reference groups or cultural experiences to which one belongs (attribution). The goal is to create five distinct experiences of how consumers perceive, feel, think, act and relate. In order to gain competitive advantage, create customer satisfaction and loyalty, businesses need to create a consumer experience rather than just offering products or services. When the atmosphere of the website appeals to the consumer’s senses, emotions, thoughts, behaviors and relational experiences, positive attitudes towards the business, its products and services will develop. As a result, these positive attitudes will lead to e-shop image and e-shop loyalty. When the domestic and foreign literature is examined, generally, in studies, consumer experiences have been comprehensively examined in traditional offline environments, and while customer satisfaction, loyalty and purchase intentions are more discussed, no study has been found that deals with store image. In this context, the aim of this study is to reveal the effect of virtual experiential marketing and its sub-elements, Sensory, Emotional, Intellectual, Behavioral and Relational marketing, on e-store image and e-store loyalty. For this reason, it is thought that this study will contribute by filling the gap in the literature.
REVIEW OF LITERATURE
VIRTUAL EXPERIENTIAL MARKETING WITH E-STORE IMAGE AND E-STORE LOYALTY
Virtual experiential marketing, involves the marketing of a product or service through an experience on the internet. It covers the Internet and together with all the channels included it, as well as every types technology that offers an environmental experience enriched with visual and audio tools and produces a spiral experience. Customer experiences, which form the basis of the experiential marketing framework, consist of modules of perception, feeling, thinking, acting and relating. Businesses in order to succeed, must target all of these experiences at the same time and apply them appropriately to each other8. Hence an experience in order to achieve this goals; should include personal attention, novelty, surprise, learning and participation9. A positive virtual experience implemented by businesses should create e-store image and e-customer loyalty in customers. Hu, Ho and Hsieh10 stated that creating an image through experiential marketing practices can affect consumer loyalty. In other words, the store image tool plays a role as a variable in creating customer loyalty through experiential marketing. In this direction, the following hypotheses have been created: H1: Virtual experiential marketing has an impact on e-store image. H2: Virtual experiential marketing has an impact on e-store loyalty.
SENSORY EXPERIENCE
It is the application of marketing strategies by addressing the senses of sight, taste, touch, hearing and smell to for create sensory experiences11. In the absence of a physical experience, sensory experience plays an important role in differentiating products and services, motivating customers, and adding values such as aesthetics / excitement to products8. The goal here is to create a sensory experience through image and sound7. The as attached a experience is to the senses, the so effective and memorable it will be3. Yoo, Park and MacInnis in a study conducted by12, they revealed that sensory experiences such as store characteristics, product diversity and store atmosphere cause negative or positive emotions. Zaltman13 argues that an experience, sensory or emotional, has a greater influence in shaping consumer preferences (creating image and loyalty) than the qualities of a product or service. In this extent, the following hypotheses have been created: H1a: Sensory experience has an impact on the e-store image. H2a: Sensory experience has an impact on e-store loyalty.
EMOTIONAL EXPERIENCE
Emotions are define as a situation to which a person feels good, elated, happy or satisfied in a situation14. Emotions, tend to drive consumers to make positive evaluations about a new stimulant, discover new table-wrap and take risks. Therefore, the fact that a consumer achieved or realized achieved a hedonic experience will affect their loyalty to visiting a website or business. But when the consumer’s experience does not meet their expectations, they may prefer to visit another site for better service7. In online retail, visual (color, tone, graphic, layout, design, etc.) and auditory cues, albeit to a limited extent, should be able to evoke emotional responses and convey information to consumers15. Stimulus-organism-response (SOR) model, a sign of Atmospheric at the consumer (i.e. in the organism), in order to provide a desired response, which leads to an emotional reaction to a stimulus when it may provides the targeted effect of the atmosphere (more explore and interact, and the desire to communicate with others, a sense of satisfaction) highlights16. Pine and Gilmore3 argue that the best relationships with costumers are sensory or emotional by its nature. Shaw17 stated that at least 50 % of customer experience is related to emotions. At the same time, Shaw17 stated that there is a strong relationship between the feelings of customers and their loyalty18. Hsu19 and Chao and Kuo20 stated that the emotions that experiential marketing creates for consumers increase consumers impression related to the business image. In their study, Atasoy and Marshap21 concluded that emotional experiences are effective in creating customer loyalty and increasing the existing level of loyalty. Based on this information, the following hypotheses have been created: H1b: Emotional experience has an impact on the e-store image. H2b: Emotional experience has an impact on the e-store loyalty.
INTELLECTUAL EXPERIENCE
Intellectual (cognitive) experience includes experiences that lead customers to think about a particular topic and motivate them to lean on the this topic. It is aimed that customers will re-evaluate for the products or services offered by experiencing the problem solving experience. In this experience, communication is establish intend to inform more consumers8. The intellectual element of the experience is to encourage consumers to think in detail and creatively in order to re-evaluate products. In this way, it is aimed to bring innovative ideas to life22. A study conducted by Köse and Özer Cizer23 found a positive relationship between intellectual experience with customer loyalty. Hypotheses established in the light of this information are as follows: H1c: Intellectual experience has an impact on the e-store image. H2c: Intellectual experience has an impact on the e-store loyalty.
BEHAVIORAL EXPERIENCE
Day24 expressed behavioral experience through indirect actions (i.e., consumer loyalty) such as repeated purchases, a customer’s value to the brand, and word-of-mouth communication. Behavioral experience enriches customers ’ lives by targeting their physical experiences, showing alternative ways of doing things, alternative lifestyles, and interactions. Rational approaches to behavior change (i.e. theories of reasoned action) are just one of many behavior change options. Changes in lifestyles and behaviors are often more motivating, inspiring and emotional and are often motivated by role models (such as movie stars or athletes). This experience differs according to the social identities, cultural characteristics, lifestyles and demographic characteristics of the customers8. Köse and Özer Cizer23 found a positive relationship between behavioral experience and customer loyalty in their study. Therefore, the hypotheses formed are as follows: H1d: Behavioral experience has an impact on the e-store image. H2d: Behavioral experience has an impact on the e-store loyalty.
RELATIONAL EXPERIENCE
Relational experience refers to the association of the product or service purchased by the customers with the social class, status or group the consumer belongs to or wants to be8. A community allows its members to share specific interests with each other, usually in the consumption context of a product or service25 and focuses on achieving both personal and shared goals. Whether it’s the group to you belong to or the group you want to belong to, often this situation encourages loyalty26. In relational experience, it is aimed to create a sense of belonging related to sensory, emotional, intellectual and behavioral experiences27. In this way, that entertains the senses and interacts with the consumer, creates positive attitudes, evokes emotional reactions, facilitates the enjoyment of the shopping experience and creates a sense of belonging to a community, a website will create a positive attitude. In their study, Seock and Norton28 found that websites that consumers rated among their favorites scored high in the “fun to visit” feature. In their study, Faiz and Kaplan29 concluded that the meaningful and positive effect of relational experience on e-loyalty is supported by testing with customers who experience online book purchases. In this context, the following hypotheses have been created: H1e: Relational experience has an impact on the e-store image. H2e: Relational experience has an impact on e-store loyalty.
E-STORE IMAGE AND E-STORE LOYALTY
E-store image can be defined as the complexity of a consumer’s perceptions of a store on different (conspicuous) attributes30. Product variety, quality, price, atmosphere, staff, ease of shopping, brand, transportation, etc. elements form the image of the store31,32. In recent years, online shopping has become one of the most popular forms of out-of-store retailing. While the number of websites is increasing rapidly, e-commerce marketing managers have faced serious competition. Therefore, creating an e-shop image has been one of the priorities33. In particular, the value of the website in terms of image is important in creating customer satisfaction and loyalty. E-store image leads to many factors that will provide profitability to the retailer, such as e-customer satisfaction and e-customer loyalty. E-store image characteristics have a direct significant impact on e-loyalty34,35. In general, the attitudes that result from a store image directly contribute to building loyalty. Therefore, designing an experience that includes clues to arouse positive attitudes goes beyond satisfaction and directly affects loyalty. The image of the store and the orientation of the store to customer relations is one of the most important ways to gain loyal customers. Factors such as store image, customer relations, positive impression, satisfaction, trust and commitment have a strong and positive effect on store loyalty36. It can be said that store image directly affects store satisfaction and indirectly affects loyalty37. Yoo and Chang31 stated that the elements that make up the store image are the most important features that define store loyalty. Chang and Tu34, Koo35, Yun and Good38 found in their studies that store image directly contributes to building loyalty. Based on this information, the following hypothesis can be formed: H3: E-store image has an impact on e-store loyalty.
RESEARCH METHOD
SAMPLE OF THE RESEARCH
The study group of the research consists of 531 people over the age of 18 who shop online. The data used in the study were collected by online survey method on 1-30 August 2021. The survey link was shared via social media and mobile communication applications and the participants were asked to fill it out. Data analysis was carried out on a total of 531 valid questionnaires that responded positively to the call.
DATA COLLECTION TOOL
In the study, a five-point Likert type measurement tool consisting of 38 statements was used. Among the statements in the scale, those related to virtual experiential marketing are from the study of Köleoğlu and Çolakoğlu39; Statements about e-store image and e-store loyalty are taken from Öztürk’s40 study. The naming of the factors was also taken from the same scales as they were. In addition, there are ten more expressions in the measurement tool that measure the demographic and online shopping characteristics of the participants. In the study, online survey method was preferred due to time, cost and pandemic conditions.
STATISTICAL TECHNIQUES USED
In the study, firstly, Confirmatory Factor Analysis with PLS-SEM was performed and the validity and reliability of the scale used in the research was examined. Then, the research model was tested with Path Analysis via PLS-SEM. Although it is recommended to perform analysis on small samples (between 30-100) in the PLS-SEM method, it is also known that there is no definite rule regarding the number of samples41. However, when the sample size is 250 or more and there are the correct number of indicative variables (ie four or more variables), the results of the PLS-SEM with other structural equation models (CB-SEM: AMOS, Lisrel etc.) used to measure each construct almost the same accuracy42. Therefore, the PLS-SEM method was preferred in testing the research model in this study. The data gathered from the participants are analyzed using SPSS program and SMARTPLS.
POPULATION AND SAMPLE
The demographics of the consumers in the research are given in Table 1 below. According to Table 1, 56,3 % of the participants are women and 43,7 % are men. Considering the age distribution, the highest participation is between the ages of 18-26 with 78 %; the least participation is 0,8 %, with participants aged 54 and above. Considering the distribution of educational status, the highest participation is Undergraduate with 34,3 %; the least participation is in Postgraduate with 4,1 %. Considering the occupational distribution, the highest participation is students with 42,2 %; the least participation is in the tradesmen/traders with 3 %. Considering the monthly average family income, the highest participation rate is 71 % in those with an income of 3000 ₺ or less; the least participation is in people with an income of 6001-7500 ₺ with 2,4 %. Finally, 20 % of the participants are married and 80 % are single. Again, according to Table 1, 15,1 % of the participants shop online once a week, 41,2 % once a month, 24,7 % every three months and 19 % every six months. Looking at the monthly online shopping amount, it is seen that 78,9 % of the participants spend 500 ₺ or less. It is seen that the most used online shopping site is Trendyol with 64,6 % and 77 % of the participants use the mobile application of the online shopping site.
SCALES: RELIABILITY AND VALIDITY
With PLS-SEM, the research model was tested with Confirmatory Factor Analysis and the factors’ AVE, CR, rho_A, Cronbach Alpha and discriminant validity were examined. CR scores of 0,7 and above; If AVE scores are above 0,5 and all CR scores are greater than AVE scores, it can be stated that the scale provides convergent and convergent validity43. A scores between 0,60-0,79 for the Cronbach α coefficient, which is accepted as a measure of internal consistency, indicates that the scale is “quite reliable”, and a scores between 0,80-1,00 indicates that the scale is “highly reliable”44. If the rho_A (Data Consistency Coefficient) is 0,70 and above, it can be said that the factor items are reliable42. The validity and reliability coefficients for the factors and the whole scores are as in Table 2. Since the factor load value of the 13th item (ESI13) of the E-Store Image factor in the scale given in Table 2 is very low, it was excluded from the analysis and the validity and reliability coefficients were calculated accordingly.
As seen in Table 2, the CR scores of all factors in the scale were 0,7 and above; It is seen that AVE values are 0,5 and above, and finally, all CR scoresare greater than AVE scores. Accordingly, it can be said that the scale provides convergent and convergent validity. Again, according to Table 2, the Cronbach α coefficient of all factors is 0,6 and above. In other words, the Sensory Experience factor is highly reliable, while the remaining six factors are highly reliable. In addition, the Cronbach α coefficient of the entire scale was found to be 0,951. Again, except for the Sensory Experience factor, the rest of the rho_A coefficient is above 0,7. Accordingly, all factors and the entire scale have high reliability. Therefore, it is seen that the scale used in the research is also reliable. For discriminant validity, the Fornell-Larcker criterion coefficients proposed by Fornell and Larcker45 were first examined. Findings related to the relevant statistics are as in Table 3.
In the Fornell and Larcker criteria, the square roots of the AVE scores should be higher than the correlation coefficients between the factors45. According to the findings in Table 3, it is seen that all factors meet the Fornell and Larcker criteria.
Also in the study, Henseler, Christian and Sarstedt46 Heterotrait-Monotrait ratio coefficients were also examined. Findings related to the relevant statistics are as in Table 4.
Heterotrait-Monotrait ratio is the ratio of the correlation mean of the factor in the model to the geometric mean of the correlation coefficient of the same factor, and the ratio is expected to be less than 0,8546. According to the findings in Table 4, the coefficients of all factors are below 0,85. Therefore, it is seen that the scale also provides the criterion coefficient of the Heterotrait-Monotrait ratio. According to the result of Confirmatory Factor Analysis, the coefficients related to the validity and reliability of the scale were revealed and according to the findings obtained, it was seen that the scale used in the study was valid and reliable. After the validity and reliability of the scale, the model was tested with Path Analysis.
STRUCTURAL MODEL AND TESTING HYPOTHESES
The research model is given in Figure 1.
As a result of testing the research model given in Figure 1 with PLS-SEM, E-Store Image is explained by 9 %, Emotional Experience by approximately 33 %, Intellectual Experience by approximately 18 %, Behavioral Experience by approximately 18 %, and Relational Experience by approximately 23 %. In other words, Virtual Experiential Marketing sub-factors affect the E-Store Image by 62 % in total. The E-Store Image factor, which is affected by Virtual Experiential Marketing factors, also explains the E-Store Loyalty factor by approximately 39 %. A 5000-unit bootstrap was applied to test the significance of the path coefficients in the model. Accordingly, the significance of the path coefficients in the model is given in Table 5.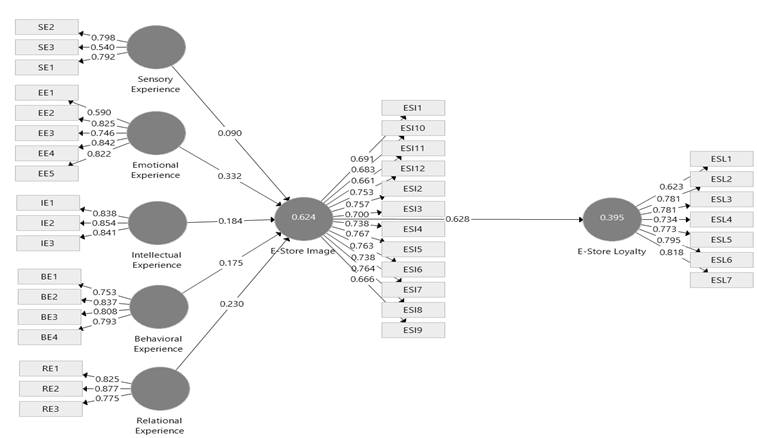
For path coefficients to be significant in PLS-SEM, t values must be greater than 1,96. Since the t scores of all roads in Table 5 are greater than 1,96, all paths established in the model are significant. Accordingly, H3 and H1 and H1s’ below hypotheses were accepted. Indirect effects can be seen in PLS-SEM. Accordingly, Table 6 showing the indirect effects of Virtual Experiential Marketing sub-factors on E-Store Image over E-Store Loyalty is as follows.
According to the findings in Table 6, all the ways showing the indirect effect are significant (p < 0,05). Accordingly, Sensory Experience affects e-Store Loyalty indirectly by approximately 6 % positively. Emotional experience indirectly affects E-Store Loyalty positively by approximately 21 %. Relational Experience indirectly affects E-Store Loyalty by approximately 14 % positively. Behavioral Experience indirectly affects E-Store Loyalty by 11 % positively. Finally, Intellectual Experience affects E-Store Loyalty indirectly by approximately 12 % positively. As a result, it is seen that Virtual Experiential Marketing sub-factors have positive and indirect effects on E-Store Loyalty. With this result, the hypotheses H2 and its sub-hypotheses were also accepted. Three different fit indices, SRMR, NFI and χ2 values, are used to test the significance of the model established in PLS-SEM42. It should be SRMR<0.08 and NFI>0.90. In this context, SRMR = 0.070, one of the goodness-of-fit scores of the research model; NFI = 0.922 and χ2 = 3240,743. According to these scores, it can be said that the model fits well. Therefore, the model established by the researchers can be said to be statistically significant and valid. R2 (Coefficient of Determination), f2 (Effect Size Coefficient) and Q2 (Predictive Fit Value) values are used for the structural analysis of the model in SMARTPLS. The fitness values of the research model are given in Table 7, Table 8 and Table 9 below, respectively. The results showing the coefficients of certainty in the analysis of the research model are shown in Table 7. For R2 values, 0,19 is weak, 0,33 is moderate, and 0,67 is significant48. According to Table 7, two variables are explained at a moderate level.
| Dependent Variables | R2 | Adjusted R2 |
| E-Store İmage | 0,628 | 0,625 |
| E-Store Loyalty | 0,393 | 0,391 |
The f2 value, indicative of the effect size, indicates the level of explanation of the endogenous variable for each exogenous variable, and 0,02-0,14 is considered low, 0,15-0,34 moderate, 0,35 and above high49. The effect size coefficients obtained as a result of the analysis are given in Table 8.
According to Table 8, the effect level of Emotional Experience on the E-Store Image is moderate, while those of other factors are low. The effect of the E-Store Image on E-Store Loyalty is high. Finally, Table 9 shows the predictive fitness of Stone-Geisser’s Q2.
The Q2 fitness value is a criterion that shows how well the values observed by the model and its parameter estimates are reconstructed48. Q2 > 0 indicates that the model provides predictive fit, while Q2 < 0 indicates that it does not. According to Table 9, the Q2 value of all variables in the model is positive. In this context, it is seen that all variables in the model provide predictive fitness.
DISCUSSION, CONCLUSION, AND SUGGESTIONS
Today, consumption provides customers with more meaningful or valuable experiences rather than the features and functions of goods and services. In other words, the consumption experience itself is richer in value compared to the good or service. Consumers who want to enjoy the experiential aspects of their shopping are motivated by the shopping process, relative to the purpose or results of the shopping. That is why creating experiences is a good way to connect with customers. Therefore, as a result of the experiences of individuals, their image and loyalty towards the store will increase. In this context, in this study, the effect of virtual experiential marketing on e-store image and e-store loyalty is discussed. In addition, the second aim of the study is to compare the virtual experiential marketing elements, e-store image and e-store loyalty variables according to the demographic and online shopping characteristics of consumers. In line with the analyzes made within the scope of the research, the following results were obtained: According to the results of the analysis made to determine the effect of virtual experiential marketing on the e-store image; It has been determined that virtual experiential marketing dimensions (sensory, emotional, intellectual, behavioral and relational experiential) have a significant effect on the e-store image. Therefore, the hypotheses H1a, H1b, H1c, H1d and H1e were accepted. Hsu19 and Chao and Kuo20 stated that the emotions created by experiential marketing for consumers increase consumers’ impression of the company image. This result is in agreement with the results of the study. Another finding obtained from the research is that virtual experiential marketing has a positive and significant effect on e-store loyalty through the e-store image. There are studies showing parallelism with this finding. Thomas47 and Hu et al.10, it has been determined that the store image has a mediating effect in creating customer loyalty with experiential marketing practices. Finally, it was concluded that e-shop image has an effect on e-shop loyalty. Thus, hypothesis H3 was also accepted. In the studies conducted by Chang and Tu34, Koo35, Yun and Good38, it was determined that the image of the store can have a direct and significant effect on loyalty. This result is similar to the findings of the present study. In the light of these findings, it can be said that with the development and progress of information technology, consumption will become more realistic with techniques such as simulation and virtual reality. For this reason, customers should be encouraged to buy by analyzing them through experiential marketing practices over the internet. In addition, managers should try to improve experiential marketing in the virtual world and increase eimage and e-loyalty through experiential marketing practices in the virtual environment.
LIMITATIONS
The most important limitation of the study is the use of quantitative analysis techniques. Since experiential marketing practices are personal, it is important to construct them from a qualitative point of view in order to obtain more descriptive results. In future studies, it will be possible to reach different results in the analyzes to be made with qualitative research techniques. Secondly, the fact that the data were collected in August, and most of the people were on vacation this month, may have affected the quality and quantity of people reached. Therefore, in this case, it may have affected the results. Therefore, the results cannot be generalized.