
INTRODUCTION
Finding the optimal balance point determined by the availability, quality, and financial sustainability in healthcare seems to be an untamed problem in the long run. For the last three decades, the reform of the Croatian health care system has failed to ensure long-term financial stability1-6. Over the long run, significant intervention is provided by periodically allocating additional financial resources to the healthcare sector from the state budget. In the past two decades (2000-2020), financial interventions of the central government were not recorded for only six years, with financial instability being evident and manifested at the secondary-tertiary level of health care, i.e., in the hospital debts remediation. They directly or indirectly account for the most significant part of the HRK 20,3 billion in rescue funds for the Croatian health care system7. Approximately this is the amount corresponding to the two-year current hospital expenditure (CHE) of the Croatian hospital system, according to consumption data from 20158. The achievement of financial sustainability must be carefully considered and weighed; namely, as much as it is undesirable to cover inefficiencies and ineffectiveness with limited public resources, it is even more unacceptable to jeopardize the essential functions of health improvement, quality of care, and accessibility9. The general idea of this article is to study and highlight the trends in the movement of hospital sectors’ selected indicators. In that regard, this article aims to: (a) analyze the hospital system’s natural and financial operations until 2019 and for the COVID 2020, and (b) compare the findings and record numbers of concern. These discoveries are discussed against the backdrop of the financial strategies of the healthcare sector. On this basis, the article opens up a conversation about the potential responses to the issues of concern. The concluding remarks offer three avenues for research towards changing the status quo; firstly, in the direction of behavioral change, secondly in determining the level of inefficiency and ineffectiveness in providing the health service, and thirdly to what extent the hospital system is underfunded.
THE HOSPITAL SYSTEM FRAMEWORK
The Croatian hospital system is part of the secondary and tertiary levels of health care10. Hospitals are almost entirely publicly owned and managed. Under the central government are tertiary care hospitals and secondary care specialized hospitals, while secondary level hospitals are mainly owned by local governments (counties and cities). The secondary level includes 22 general and 33 special hospitals, health resorts, and a prison hospital. With appropriate bedding, diagnostic and other possibilities adapted to their purpose, general hospitals perform surgery, internal medicine, pediatrics, gynecology and obstetrics, and emergency medicine. Special hospitals perform specialist-consultative activities and hospital treatment of certain diseases or specific age groups. The most complex forms of health care from specialist-consultative and hospital activities, scientific research, and teaching are performed at the tertiary level. The tertiary level of health care in Croatia is provided by five clinical hospital centers (CHCs), three clinical hospitals, and five clinics. A clinic is a health institution or part of a health institution that, in addition to performing specialist-consultative and hospital activities, performs the most complex forms of specialist health care, and is a resource for higher education institutions and conducts scientific work for the activity for which it was established. Clinical hospitals are general hospitals in which at least two activities from internal medicine, surgery, pediatrics, gynecology and obstetrics are offered as clinics and at least two other activities of other specialties, i.e., diagnostics. CHCs are general hospitals with clinics for internal medicine, surgery, pediatrics, gynecology and obstetrics, whose more than half of other specialties are clinics, and where more than half of the curriculum of medicine, dentistry, pharmacy, and medical biochemistry, or nursing is delivered.
METHODS AND DATA
The insight into the financial (un)sustainability of the hospital system is based on data compiled from the Croatian Institute of Public Health (CIPH), the Agency for Medicinal Products and Medical Devices (AMPMD), and from five key Croatian hospitals, i.e., Clinical Hospital Centers for which there is an obligation to publish financial statements. According to the definitions of the System of Health Accounts11, data on hospitals’ current health expenditures in Croatia are collected by CIPH. They also collect statistics on the work of health care institutions and publish a report on the work of hospitals by activities, separately for inpatient activities, day hospitals, one-day surgery, and hospital hemodialysis. For the analytical purpose, descriptive statistical analysis has been used to analyze obtained secondary data. The AMPMD collects data on total drug consumption in Croatia, and their data provide insight into the movement of hospital consumption in monetary amounts and (partially) by the Anatomical Therapeutic Chemical (ATC) Classification12. In this article, the ATK group L (drugs for the treatment of malignant diseases and immunomodulators) was singled out as a representative example of hospital consumption of medicines13; p.116. This research’s observation period of natural and financial indicators was planned to cover five years from 2015 until 2019 and the COVID year 2020. However, this was partially successful, i.e., for selected indicators of the hospital system shown in Table 18,14-23 and for medicines consumption displayed in Figure 124-29. For providing a more detailed insight into the financial development of events in the hospital system, the example of five clinical hospital centers was used. For CHC’s, indicators are shown for a shorter period until 2020. Their natural indicators have been shown since the year 2018 in Table 221-23 because they were previously aggregated in data sources in such a way that makes separated reporting impossible. As regarding the financial indicators in Table 330-51, the observation period starts arbitrarily with 2017; this year was chosen because, in the last decade, it was the last in which CHC’s realized cumulative income surplus. Also conditioned, the insight into the CHC’s maturity structure presented in Table 434-52 starts dependently on the fact that hospitals are required to report their structure of liabilities by maturity only since 2018. Monetary amounts are shown in the national currency, the Croatian Kuna (HRK). However, if, e.g., EUR or USD are preferred, the reader is suggested a simplified approximation using the Croatian National Banks’ 2015-2020 average of annual middle exchange rates53, i.e., dividing the HRK amounts with 7,5 (EUR), and 6,6 (USD).
THE NATURAL AND FINANCIAL STATE OF AFFAIRS
PATIENT NUMBERS AND DAYS OF HOSPITAL TREATMENT
In 2019, hospital spending in Croatia amounted to HRK 13.4 billion (Table 1). Compared to 2015, this increases HRK 2,9 billion or 27,8 % (average YoY growth of 4,4 %). The share of Croatian hospital system consumption in total health spending in 2019 was 47,6 %, making it the largest of all 27 EU countries for the third year in a row. With an average growth rate of 2,7 %, hospital physicians increased from 6 401 in 2015 to 7 181 in 2020. At the same time, the number of days of hospital treatment and the number of people in inpatient wards in the hospital system has been declining continuously since 2015. In other words, the number of patients in inpatient wards, days of hospital treatment and the number of inhabitants in Croatia has been in decline but the number of hospital physicians is steadily increasing. An added curiosity is that even though the population is shrinking, the number of hospitalizations per 100 inhabitants is relatively constant in the observed period. The reduced admissions and days of treatment in acute hospital wards were offset by directing patients towards day hospital treatments. During the five years before the pandemic outbreak (2015-2019), in day hospitals, one-day surgeries and hospital hemodialysis, the numbers of discharged patients and hospital days recorded an average YoY growth of 7 % and 7,7 %, respectively. However, compared to 2015, in 2019, the total number of hospital days (including inpatient and daily hospital stays) decreased from 7 530 845 to 7 241 279. That means there are almost 300 000 hospital days less, or more precisely a decrease of 3.85 %. Simultaneously, the number of discharged patients increased almost 10 % in total, owing to the increases in patient discharges in daily hospitals, day surgeries and inpatient hemodialysis (see Table 1, line III.). It is a generally accepted fact that improved access to day hospital / one-day surgery goes hand in hand with reduced admissions to acute hospital wards and contributes to the rationalization of hospitals’ operating costs. In that regard, Croatian hospitals’ current expenditures rise of almost 3 billion HRK (2019/2015) deserves to be mentioned once again.
MEDICINE CONSUMPTION
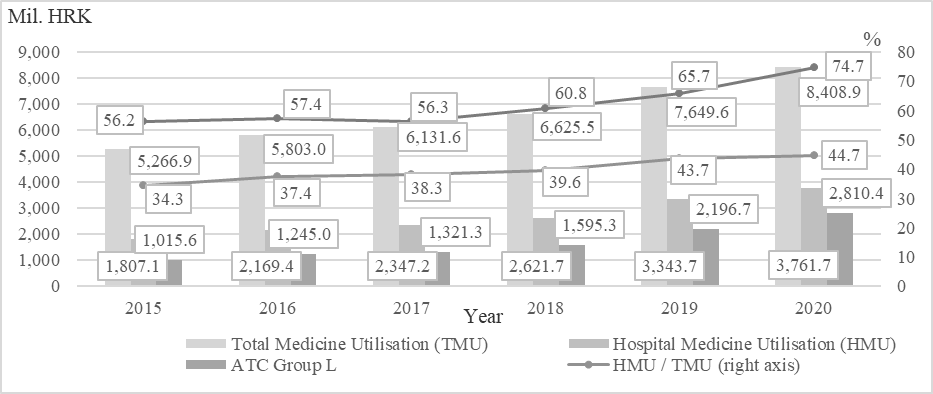
The total consumption of medicines in Croatia in 2019 amounted to HRK 7,65 billion, of which HRK 3,34 billion (43,7 %) is related to hospital consumption of medicines (Figure 1). Total drug consumption increased by 45,2 % from 2015 to 2019, with drug consumption in hospitals growing from HRK 1,81 billion to HRK 3,34 billion, growing almost twice as much (85 %). The most significant increase in the share in total consumption was recorded by medicines to treat malignant diseases and immunomodulators (ATC group L). As mentioned earlier, and since drugs of this group are prescribed exclusively by specialist doctors after a diagnostic procedure that is possible only in hospitals/clinical hospital centers, it can be inferred that the total consumption of drugs from ATC group L can indicate hospital consumption of medicine13; p.116 of CHCs’. Their increase has been extraordinary; from 2015 to 2019, the share of medicines treating malignant diseases and immunomodulators (ATC group L) in total hospital drug consumption increased from 56 % to 66 %. In fact, the consumption of these costly medicines doubled from HRK 1,02 billion in 2015 to HRK 2,2 billion in 2019. The increase in the consumption of ATC group L can be attributed to the increased use of new biological and biosimilar drugs to treat neoplasms, various autoimmune diseases, and other diseases that are now more effectively treated with new biological drugs. However, in the division into so-called “old” and “new” drugs in this group, the consumption of “old” drugs did not decrease, while the consumption of “new” drugs increased significantly13; p.116.
THE 2020 COVID PARADOX
As can be seen from a comparison of 2020 with the pre-COVID period, the pandemic significantly highlighted the pre-existing oddity. In inpatient health facilities, the number of hospital days and discharged patients decreased YoY roughly by one-fifth; daily hospitals and day surgery show a decrease of 13,5 % in hospital days and 14,5 % in the number of discharged patients. At the same time, hospital drug utilization recorded an increase of HRK 418 million or 12,5 %, and the cost of ATK group L drugs increased by 28 %, or HRK 613,7 million. Altogether, it will make 1,35 million (18,7 %) fewer hospital days, and almost 225 000 fewer discharged patients (16,8 %) in 2020 compared to the previous year. Similar results were obtained by Kalanj et al.54 in their research based on Diagnosis Related Group (DRG) data from all non-specialized acute hospitals in Croatia, which account for 96 % of national inpatient activity. Their analysis of the hospital admission rate before (average 2017 2019) and during the pandemic reveals a 21 % decline in general hospital admissions in 2020, despite the additional 20 609 COVID-19 related inpatient admissions reported by the CIPH. Case numbers in DRG classes related to the treatment of cancers decreased by 14 %, whereby tertiary hospitals experienced a decrease of 16 % in cancer and neoplasm-related admissions, and secondary level hospitals a 6 % decrease in such admissions. At the same time, as shown in this article, hospital drug utilization recorded an increase of HRK 418 million or 12,5 %, and the cost of ATK group L drugs increased by 28 %, or HRK 613,7 million.
When looking at 2020, the COVID-19 disease pandemic surfaced the complete picture of the hospital systems paradox. Namely, compared to 2019, the number of hospital days in inpatient health facilities decreased by one-fifth, and the number of discharged patients decreased by 18,5 %. The same indicators in daily hospitals and day surgery show a decrease of 13,5 % in hospital days and 14,5 % in the number of discharged patients, which in total indicates 1,35 million fewer hospital days (18,7 %) and almost 225 000 fewer discharged patients (16,8 %) in 2020 compared to the previous year. On the other hand, hospital drug utilization simultaneously recorded an increase of HRK 418 million or 12,5 %, while the cost of ATC group L drugs increased by 28 %, or HRK 613,7 million.
THE NATURAL AND FINANCIAL STATE OF AFFAIRS
COVERING CASH GAPS OF CHC’S
A somewhat more detailed insight into the financial development of events in the hospital system can be seen in the example of five clinical hospital centers; their selected natural indicators are shown in Table 2. Together, clinical hospital centers account for approximately half of the entire hospital sector expenses in Croatia and almost the total ATC Group L drugs consumption. They employ over 40 % of all physicians in the hospital system and treat 39 % of acute and chronic inpatient hospital patients.
THE NATURAL AND FINANCIAL STATE OF AFFAIRS
According to data compiled from CHC’s financial reports (Table 3), in 2017, their aggregated total income (around HRK 6,1 billion) covered total expenses (around HRK 6 billion). The explanation of the income surplus is simple – HRK 856 million of budget aid was received. The following year, in which budget aid was halved, a total income deficit of HRK 406 million was achieved, while in 2019, with a budget aid of HRK 191 million, a total deficit of HRK 616 million was achieved. Overall, in 2019, total income is 13 % higher than in 2017, and total expenses by 26 %. Material costs increased from 3 to 4.1 billion HRK (35 %), while with a slight increase in employment, employee costs increased by 11 %, to about 3 billion HRK. In 2020, with the advent of COVID-19 disease, total expenditures exploded relative to total income, and clinical hospital centers achieved a total income deficit of almost 1,5 billion HRK.
THE NATURAL AND FINANCIAL STATE OF AFFAIRS
In three years, the total liabilities of CHCs increased from 2,8 in 2018 to 4,9 billion HRK in 2020 (76 %), with overdue and unpaid liabilities growing 56 %, from 1,5 billion to 2,3 billion HRK (Table 4). Almost all due liabilities relate to material expenses (over 95 %) or plainly said for unpaid medicines and medical supplies, meaning that the medicines wholesalers "credit" hospitals in the stated amounts and deadlines. In other words, the money goes first to pay salaries and overhead costs, and the cash gap is ‘covered’ by non-payment of medicine wholesalers.
KEY STAKEHOLDERS’ FOCAL POINT
KEY STAKEHOLDERS’ FOCAL POINT
From the insight into hospital institutions’ natural and business indicators, the outlines of a fuzzy picture can be seen. More detailed data on expenditures and operations are currently not publicly available, and what is available in control and management is useless. Overall, they quite clearly indicate the need for deeper analysis, the search for some rational justification, reasoned explanation, whether medical or economic, of the growing costs of the health or hospital system that have been disproportionate to available resources for decades. The Ministry of Health of the Republic of Croatia has set a specific goal for years - more efficient management of financial resources in health55. However, if some effort has been made to achieve this goal, it has not yet (year-end 2021) resulted in more visible changes. Nowadays, BI tools and existing IT infrastructure can enable relatively rapid development and setup of an analytical-reporting system that allows top decisionmakers to propose measures and make decisions based on credible, up-to-date information and value indicators. Such a central reporting system can be designed to democratize the data of health care institutions, i.e., to provide the management structure of health care institutions with insight into selected interactive reports of their operations, comparative indicators with other institutions, etc., which encourages self-regulation and self-control. Management at the hospital system level could, for example, be improved by using dynamic quantitative/qualitative control and management tools that provide in-depth insight into the status, changes, and causes of all relevant items and indicators of natural and financial performance at all times. Typically, something that would align with the above suggestion should have come to life years ago; it is not ingenious. From a multitude of potential explanations why it did not, one of the most elegant and straightforward is that the current situation describes the focal point in Thomas Schelling’s sense56-60. As pointed out by Schelling in his seminal research on the resolution of coordination problems56,57, in situations of strategic interactions, there are both elements of conflict and common interests. Such situations can be resolved so that common interests are maximized despite conflicts of interests - when converging on the particular equilibrium seems ‘obvious’ for the strategic game players. Idiosyncratic cues determine the path towards convergence. The coordination problem solution stands out as the natural answer, i.e., it appears intuitively apparent to the involved individuals. History plays a vital role in Schelling’s concept of a focal point57; pp.67-68,61. An outcome can become salient simply because it has occurred frequently in the past62. Interdepartmental discussions on the problem of financial instability in Croatian health care, i.e., the hospital system, are generally dominated by two persistently opposing views. From the perspective of those responsible for protecting, improving, and preserving the population’s health, the system’s financial framework has traditionally been considered insufficient. On the other hand, according to the view that sees financial sustainability through the prism of fiscal restraint, healthcare problems are uncontrolled growth of expenditures. These key players and the social community, in general, believe that (public) hospitals are too important to fail; they are ‘socially important non-financial institutions’63. Because they operate in a structural-situational monopoly with the function of saving the lives and health of citizens, when their regular business is threatened by illiquidity or insolvency, the government intervenes and saves them with taxpayers’ money. This indirect government guarantee is why medicine wholesalers supply hospitals and simultaneously accept seriously delayed payments. For them, it is a lucrative, risk-free sales and financing business combination – in their sales prices, financing with mark-up is embedded. When the medicine wholesaler’s credit lines from their banks and suppliers are completely exhausted, the drama play is set in motion. Typically, the scenario is as follows: Medical wholesalers initially try to negotiate with hospitals. It is always unsuccessful since the hospitals have no money. Swiftly, the danger of medicines and medical products not being delivered to hospitals becomes breaking news in the public media. The topic rises to a higher level, and wholesalers talk to the ministry of health whose hands are tied - funds for hospital debts repayment are not planned in the current budget. As days go by and the pressure rises, the finance ministry is tasked with finding a solution at the governmental level. In the concluding part of the play, the fiscal balance keeper prepares the budget revision, and the government announces the debt remediation schedule. The fire is extinguished, and the tensions calm down; everything returns to normal until next time. The healthcare sector decisionmakers, including the management structure in the hospital system, have no intrinsic motivation to think within the financial equilibrium. According to them, the system is underfunded, which means that it cannot even fulfill its essential task of protecting, improving, and preserving the population’s health within the given financial framework. Therefore, when the health care system faces a budget constraint, they spend more in good conscience. However, the Ministry of Finance is responsible for preparing and implementing government fiscal policy. One of its most important tasks is the management of budget revenues and expenditures; the state budget serves, among other things, as a system of control over the collection and spending of budget funds. The public finances, whose task is to guard the fiscal balance, should be very discontented when ‘forced’ to settle unplanned debts in any public sector function, including health care. They should be very much interested in preventing such adverse events in the future, e.g., by proposing controls or discouraging mechanisms where unplanned debts arise. However, as far as health care is concerned, public finances are entirely passive in this regard. The passivity of the fiscal balance keeper may indicate that they tacitly admit that healthcare is underfinanced, i.e., that the allocation of resources to various public sector functions in the state budget is not optimal. When passed in parliament, the budget reflects socio-political consensus, a compromise reached on allocating limited resources to various public sector functions. The community pays regularly more than budget-planned expenditures for the health care function. The anomaly of unrealistic budget planning for healthcare is a form of shared understanding among a population of agents; it is a focal point where they maximize their joint welfare in bargaining situations. For decades, it has been ‘order without law’64,65 that unplanned healthcare debts are paid without much difficulty and (public) discussion. If, for example, during the budget preparation process, healthcare funds were planned in a more significant amount, then due to scarcity or limited resources, the expenditures of some other public functions would have to be reciprocally limited. So, the ‘Schelling point’ where all participants maximize their interest is to underbudget the public healthcare function and accept later more spending than officially planned. In essence, it is a hidden budget deficit, revealed at some later point in time, and that could never be more easily leveled out in any other public function than in healthcare, i.e., the hospital sector. A generally accepted outcome is a salient status quo ex-ante year after year.
CONCLUDING REMARKS
It is generally prudential to observe financial sustainability in the public sector through the prism of fiscal constraint. However, the achievement of sustainability in the health system can be exerted to the level where it will continue to meet its primary goals and tasks in the future. By focusing on fiscal balance, without in-depth analyses, methods, and consequences of potential decisions, achieving financial sustainability may result in undesirable or unacceptable consequences in achieving the fundamental function of improving health, quality of care, and availability. In other words, without an appropriate quantitative-qualitative basis and in-depth analysis of efficiency, from the aspect of social welfare, the newly achieved financial balance can be just as inefficient as the imbalance that preceded it. The divergences mentioned earlier intuitively call for more profound attention and analysis to detect inefficiencies or ineffectiveness in health service delivery. Citizens use the term extravagance in their daily lives for economically irrational behavior, and it is indeed highly undesirable not to eliminate it when it comes to public funds. Adjustments in the management of public funds, especially in healthcare spending, should be accompanied by ‘law and order,’ i.e., efficient and effective management, control, and responsibility for results. However, this does not have to be the only cause of Croatian hospitals’ financial troubles. In parallel and simultaneously, it is imperative to find a compromise financial sustainability point where the health system faces a given budget constraint, a realistic financial framework in which it optimally achieves its core task of protecting, improving, and preserving public health. In that way, the direct, intrinsic contribution of the health system to the financial balance is optimized, i.e., the pursuit of harmonization of expenditures and revenues does not jeopardize the achievement of the health system’s goals. Therefore, it is needed to determine the extent to which the hospital system is underfunded. The essence and scope of the problem depend on who has been asked. Health and finance stakeholders have different interpretations of what the problem is. Every version of the problem has an element of truth, but neither is verifiably right or wrong. Due to the absence of shared understanding of the dimensions of the problem and noncommunication, healthcare and (public) finance have, intentionally or unintentionally, for decades played their soft-budgeting game that always ended by acclamation accepted rescues. They created a status quo of hidden deficits and government bailouts that is fundamentally wrong and undesirable. Therefore, the first and foremost necessary prerequisite that should be fulfilled is a fundamental behavioral change of key stakeholders. In essence, it seems that this challenge is not so complex as it is longstanding. It is longstanding because different stakeholders are convinced that their version of the problem is correct. For moving away from the status quo, effective collaboration is critical. Communication, open and sincere, is a vital precondition for creating a shared understanding of the problem and comprehensive response to the issue. Just as there is no doubt that Croatia is facing reform measures in health care, there is no doubt that there are no quick fixes and simple solutions. Because of the troublesome budgetary effects of hospital bailouts, not just health and finance, but all public sector functions stakeholders need to get out of their trenches and work together on a budget, i.e., public priorities. It should be their duty to search for and find the socio-political consensus on the allocation of limited resources to the various functions of the public sector. At the core of macroeconomic and fiscal constraints should be a total public sector spending review, identifying inefficient programs and their defundation. Healthcare should no longer be a public function whose expenditures are regularly insufficiently planned in the budget because, under the pretext that the lives and health of citizens are at stake, it is irresistibly easy to cover the lack of financial resources subsequently.