
Introduction
The diversity of dairy products is an expression of cultural diversity, and many factors such as geographical location, living conditions, and population density have caused the emergence and development of different dairy products. Dairy culture has a long history and has been the cradle of various civilizations for thousands of years. Today, however, this wealth is largely lost and traditional products are dominated by a few products (Şenel, 2006). Butter has a desirable flavour and is regarded as "natural" by consumers. Butter properties and preference by consumers can be further improved by making it more spreadable at refrigeration temperatures (Hillbrick and Augustin, 2002). Butter, obtained by the milk fat concentration, is a product containing 80-90 % milkfat, a maximum of 16 % moisture, other milk components, and up to 2 % salt can be added to the salty ones. Modifying the fatty acid composition of butter by decreasing the proportions of 12:0, 14:0, 16:0, and stearic acid (18:0) and increasing the proportions of unsaturated and short-chain fatty acids improves its spreadability. Such changes can be achieved by processing technologies such as milk fat fractionation (Henning et al., 2006), cow nutrition, or cow selection.
Milk and its derivative products, especially cheese and Butter, have a special place in the human diet and constitute one of the most critical media for pesticide residue monitoring. Contamination of milk and dairy products with pesticide residues (Ćosić et al., 2021) is a severe public health concern for infants, children, and adults (Goulart et al., 2008; Tankosić et al., 2022). Continuous analysis of animal feedstuffs and milk for pesticide residues is indispensable in monitoring the levels and identifying the main sources of milk contamination. Also, the increasing environmental pollution in dairy farms needs to be further examined. Owing to their high lipid solubilities, the pesticide residues are primarily stored in the fat tissues of organisms. Consequently, the residues are translocated and excreted through milk fat. Eventually, milk and milk product consumers can be exposed to the residues, which get concentrated in fat-rich products, such as butter (Mensink et al., 2003).
The high ratio of saturated to unsaturated fatty acids in milk fat has been a concern because of the link between intake of saturated fatty acids and various biological markers for cardiovascular disease risk, such as elevated blood pressure, insulin resistance, and hyperlipidemia, particularly of low-density lipoprotein cholesterol (Rasmussen et al., 2006). As a risk indicator for cardiovascular diseases was proposed an atherogenic index for dietary fats, which is the sum of concentrations 12:0, 16:0, and 4 × 14:0 divided by the sum of concentrations of unsaturated fatty acids (Ulbricht and Southgate, 1991). Chen et al. (2004) termed the inverse of the atherogenic index the health-promoting index (HPI).
Specifically, greater consumption of myristic acid (14:0), palmitic acid (16:0), and lauric acid (12:0) increase concentrations of low-density lipoprotein, whereas greater consumption of unsaturated fatty acids has the reverse effect (Fernandez and West, 2005).
The fatty acid composition of milk fat is not stable and is influenced by several factors, so we aimed to compare Butter made from yoghurt in traditional or cream on an industrial scale in terms of the physical-chemical properties, oxidation activity, and fatty acid profile, especially trans fatty acids during storage. To the author's knowledge, up to now there is only one published scientific data on the microbiology of traditional butter in North Macedonia (Santa et al., 2015). The combination of physical processing technology and fermentation to improve dairy butter's fatty acid composition and textural properties has not been investigated. Thus, the objective of this study was to test whether fermentation or ripening could improve and produce a more health-promoting milk fatty acid composition and to study the pesticide residue in butter.
Materials and methods
Butter manufacture and chemical analyses
Cream butter and yoghurt butter were produced at the end of the winter season at an industrial dairy plant and a local homemade producers in Tetovo, North Macedonia, respectively (Figure 1).
The percentage of fat in the cream was 50 %, while the pH of the cream during churning was 6.20. The cream was heat treated at 90 °C for 30 seconds and was washed after churning about 2-3 times. Yoghurt butter production process in local home production starts in the morning, after the cows are milked. The milk was boiled for 3-4 hours and then cooled down to the fermentation temperature for an hour. The milk was set into the electrical churn with 500 mL of yoghurt used for the fermentation for about 2 to 3 hours. Finally, the yoghurt was churned and rinsed with water until the final product is collected with a wooden spoon. After the production, eight butter samples (four samples from each production) were vacuum packaged in poly bags (PE) and were brought to the laboratory for analyses during 1, 15, and 30 days of storage at 4 °C.
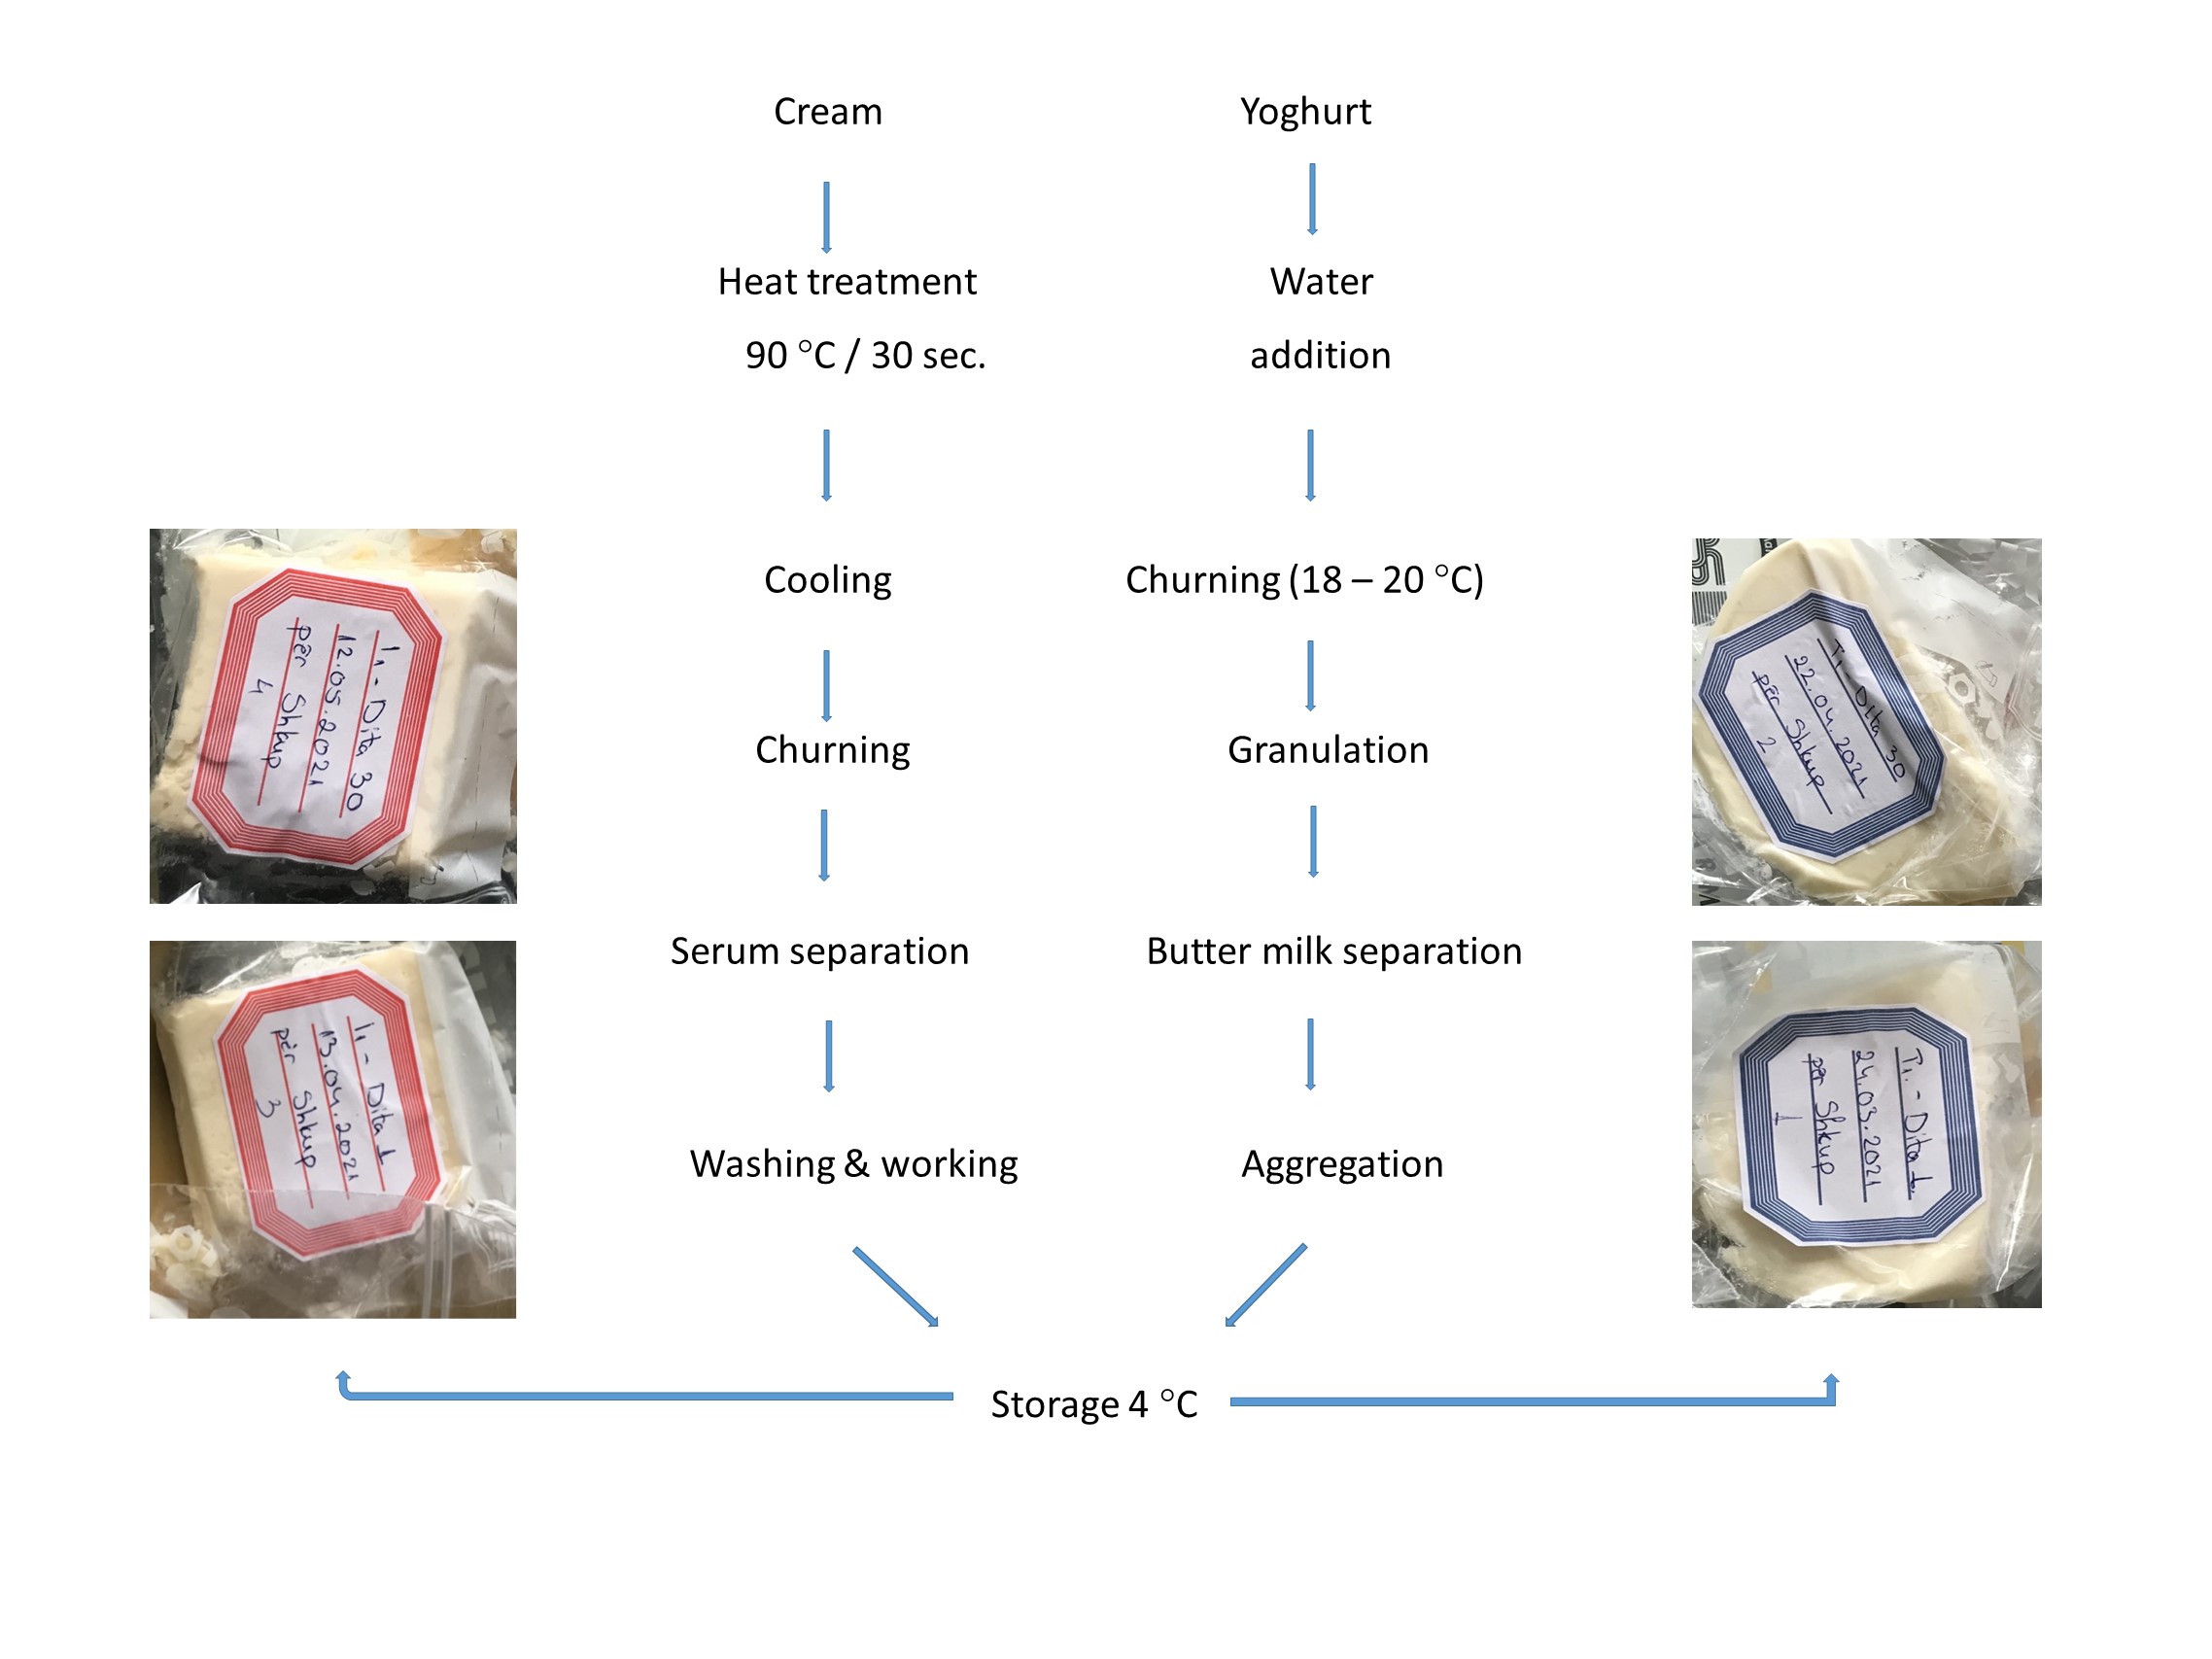
Figure 1. Manufacture protocols for production of cream and yoghurt butter samples
The total solids, acidity (mg KOH/g), and fat content were determined according to the methods of Metin (2008). A penetration probe was used, and the values were measured using a digital pH meter (digital pH meter, model MP120FK Mettler Toledo, Greifensee, Switzerland). The pH and peroxide values of the Butter were determined according to the IDF method (1981) and the AOAC method (2000), respectively. Colour parameters of butter samples were quantitatively determined at three different stages of ripening (1, 15, and 30 days) following lightness (L*), redness (a*: +red, -green), and yellowness (b*: +yellow, -blue) using Minolta Chroma Meter (model CR-5, Konica Minolta, Osaka, Japan) with 10° standard observer and D 65 illuminant. Analyses were performed in a triplicate for each treatment.
Fatty acid composition analysis
Fat from butter samples was extracted and esterified according to AOAC (1993) 996.06. Analyses of the FFA were carried out on a GC/MS (GC Agilent Technologies 7890 GC System, CN 11251075, USA). Operating conditions for the GC were as follows: flame ionization detector (Agilent Tech. Inc.) at 200 °C; column: DB-23 (60 m x 0.25 mm x 0.25 µm) at 165 °C for 15 min, then increased over 47 min to 200 °C; flow gas: H2 (34 kPa); flow rate of 1 mL min-1; time stable: 200; flow speed: 1/50 (hydrogen/dry air); airflow: 350 mL min-1; H2 flow: 35 mL min-1. The FFA composition analysis was carried out in duplicate.
Pesticide residue determination
The pesticide residues were analysed using GC 7890, MSD 5970 (Agilent 19091S-433) and Agilent column (30 m length x 250 μm x 0.25 μm) according to the validated method (МКС EN 15662:2011 2011-03-30). Pesticides are usually extracted with the organic solvents such as: chloroform, methyl chloride, acetone, acetonitrile or ethyl acetate (Darmstadt, Germany). Samples taken from their sources are stored at room temperature until they are analysed. Briefly, 5 g of sample was weighed and placed in a 50 mL polypropylene tube, 10 mL of water is added and then the sample is vortexed for 1 min. 10 mL of acetonitrile (ACN) and the contents of the pesticide kit (Sodium Citrate, Sodium Hydrogen Citrate, Pantoprazole Sodium Sesquihydrate, MgSO4, and NaCl) are added. The content is vortexed for 30 seconds and centrifuged for 5 minutes at 5000 rpm at room temperature. 6 ml of supernatant is transferred to 15 mL plastic tubes and vortexed for 30 s and centrifuged at 3000 rpm for 5 min. 4 mL of the upper layer is transferred to plastic tubes and placed in a nitrogen evaporator at 40 °C. The residue after evaporation is dissolved in 1 mL of toluene, mixed by vortex, filtered through a polyvinylidene difluoride (PVDF) filter syringe with a porosity of 0.2 μm, then 0.95 mL is transferred to 2 mL vials with 50 μL of the internal standard added and injected into the GC-MSD system. For GC analysis initial oven temperature was set at 150 °C (hold time for 5 min) followed by a temperature increase to 200 °C at the rate of 3 °C min−1 and final temperature ramped to 280 °C at a rate of 8 °C min-1 hold time for 10 min. The carrier gas (helium 99.999 %) was maintained at a constant flow rate of 1.8 mL min-1; and detector temperature set at 150 °C.
Sensory analysis
Sensory analysis was carried out on butter samples by seven panelists from the academic staff working in the Department of Food Technology (University of Tetova). The butter was evaluated at 1, 15, and 60 days of ripening by 7 trained panellists familiar with the butter according to the previously described procedure (Sulejmani et al., 2016). The samples were evaluated by criteria appearance (scale 0-5), odour (scale 0-5), texture (0-10), and flavour (scale 0-15). Water and bread were provided to panellists to rinse their mouths between samples. Sensory analysis was conducted in 3 replicate trials, and butter was evaluated in duplicate by each panellist under identical conditions. Sensory profiling was scored from 1 to 10 points, where a higher score meant more expressed attributes.
Statistical analysis
A randomized complete block design, which incorporated two treatments (industrial and traditional butter), three storage periods (1, 15, and 30 days), and two blocks (trials), was used to analyse the response variables related to butter composition colour and sensory data. Duncan's multiple comparison tests were used as a guide for paired comparisons of treatment means. The ANOVA T-test significance of differences between treatments was considered at p<0.05 for fatty acid composition using SPSS version 9.0 for Windows (SPSS Inc., Chicago, IL, USA).
Results and discussion
Chemical composition and peroxide degree
Average values of some compositional parameters of cream and yoghurt butter samples in terms of storage period are presented in Table 1.
Table 1. Physical-chemical parameters of cream (C) and yoghurt (Y) butter samples
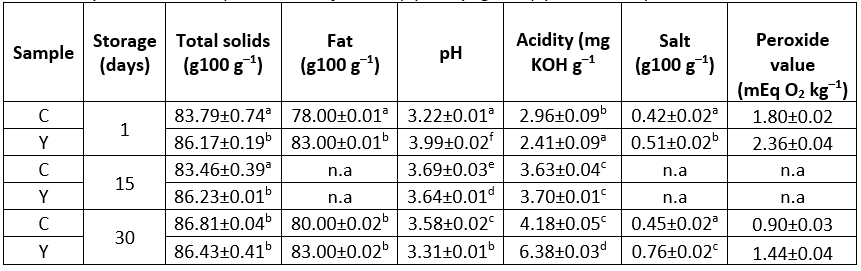
a-c-Means ± SD with different letters were significantly different among samples within the column (p<0.05)
n.a.: not analysed
There is a significant difference between all butter samples in terms of total solids (p<0.05). The total solid contents of the cream butter samples varied significantly from 83.46±0.39 day 15 to 86.81 g 100 g-1 day 30. The mentioned properties of the butter produced are compatible with the national codex for butter quality (Official Gazette No. 96/2011). These results are higher than the findings reported by Gundogdu et al. (2019). Also, the opposite to previously research butter made from cream had lower total solids than yoghurt samples. The total lipid contents varied from 78.0±0.1 (brand C day 1) to 83.0 ± 0.1 g.100 g-1 (brand Y day 1). The fat content found in the present study are within limits established by the Codex Alimentarius and North Macedonian legislation, which establishes the minimum of 80 % fat content for salty Butter (Official Gazette No. 96/2011). The variation between the fat ratios of Butter is significant during storage. The fat values change between the 1st and 30th days of storage was significant (p˂0.05) for the cream butter samples and insignificant (p>0.05) for yoghurt butter samples. The fat contents of the butter samples were lower than those determined by Erkaya et al. (2015) and Simsek (2011).
The pH varied from 3.22±0.1 (brand C day 1) to 3.99±0.2 (brand Y day 1). Differences in the pH of butter samples were significant (p<0.05). Butter samples made from yoghurt had a higher level of acidity than butter samples made from cream at the end of storage. It is most likely that the acidification with native starter bacteria changed the pH of yoghurt butter samples (p<0.05). The acidity degree of butter increased during storage, and this change was found to be statistically significant for the traditional Butter (p<0.05). The concentration of acidity elements is dependent on the increase in total solids content that causes an increase in titration acidity. In addition to the natural acidity of milk, lactic acid and other organic acids formed from the activity of lactic acid bacteria during the fermentation of yoghurt are also the sources of acidity (Tamime and Robinson, 2007). Similarly, Hayaloglu and Konar (2001) reported that yoghurt butter samples were characterised by higher acidity than butter samples made from cream, which was related to lactic acid production during yoghurt fermentation by yoghurt starter bacteria. Also, free fatty acids are formed due to the hydrolysis of milk fat, and the variation between the fat ratios of butter is important. The acidity degrees of yoghurt butter samples were higher than those reported by the Sağdıç et al. (2002, 2004) 0.65-0.72 mg KOH/g fat, Atamer et al. (2004)1.06-2.67 mg KOH/g fat, Şenel (2006) 0.80-1.41 mg KOH/g fat and Öztekin-Öztürk (2010) 0.76-1.19 mg KOH/g fat. In a fresh butter, the acid value at 1.4 mg KOH/g fat level causes a perceptible change in taste at 1.8 mg KOH/g fat level, and when it reaches 3.3 mg KOH/g fat value, the bitter taste is severe (Atamer and Sezgin, 1984).
The peroxide values of the samples are expected to be different from each other, considering the production conditions (Table 1). According to WHO/FAO Food Standards International standards, the butter peroxide number is determined as 5 meq O2/kg. The peroxide values detected in our research were found to be lower than the peroxide values specified in Food Standards. Factors such as heat applied to fat-containing foods, the temperature of the environment and the presence of oxygen, unsaturated fatty acids, and the pH of the food cause oxidation that triggers peroxide (O'Connor and O'Brien, 2006). Similarly, the peroxide value of both samples significantly decreased on day 30 of storage. Similarly, Erkaya et al. (2015) reported a reduction in the peroxide value during 30 days of storage of the butter, which may result from the formation of malondialdehydes due to the degradation of peroxides. This finding also agrees with the results of Simsek (2011) who reported that peroxide values of butter were highest at the end of the storage time. These results were generally lower than those reported by Altun et al. (2011) and Akgül et al. (2020).
Profile of fatty acids
The amount of butyric acid was between 4.05 % in cream butter samples and 4.52 % in yoghurt butter (Table 2). This significant difference was probably related to the higher since the fat ratio of yoghurt butter in comparison to that of cream butter and the increase in the amount of substrate increases the enzyme activity. Atamer et al. (2004), (2005b) stated no change in the amount of butyric acid in butter and cream butter during storage.
Table 2. Fatty acids (%) concentration of yoghurt (Y) and cream (C) butter samples during storage
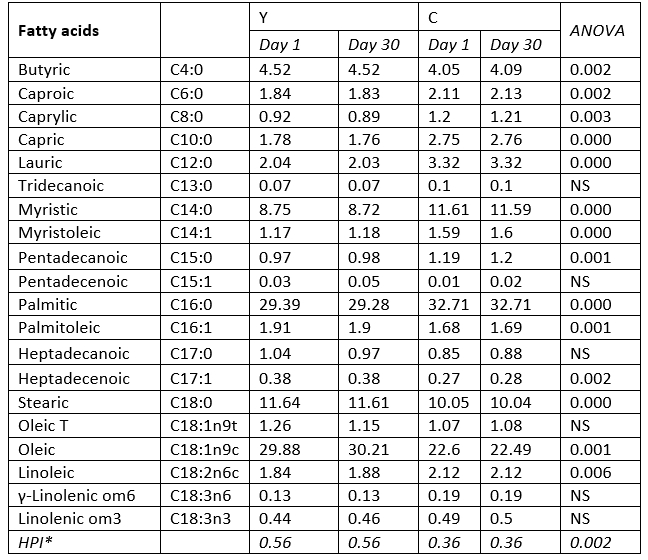
*HPI - healthy parameter index
Atamer et al. (2005a) found the amount of butyric acid in 22 pieces of Cucumber butter between 24.10-324.80 µg g-1. It is reported that these factors may be effective in obtaining the high values specified. Similarly, Atamer et al. (2005b), in another study, found the amount of butyric acid in traditional Butter to be between 3.83-3.86 µg g-1, and between 3.00-3.02 µg g-1 in cream butter. The low amount of butyric acid in the cream butter is due to the enzyme and microbial inactivation caused by heat treatment. The level of caproic acid changed between 1.83 % in cream butter and 2.13 % in yoghurt butter during storage (Table 2).
The caprylic acid content of cream butter (1.21 %) was higher than yoghurt butter (1.83 %) at the end of storage. Compared with sample Y (1.76 %), sample C (2.76 %) had a higher level of capric acid at the end of storage (p<0.05). Our results for the butyric, caproic, and caprylic acids were higher than the butter samples produced in Trabzon, Turkey (Akgül et al., 2020). Degradation of fat by heat and oxidation could cause changes in the fatty acid composition (Samet-Bali et al., 2009).
The content of lauric acid ranged from 2.03 % to 3.32 % during storage, and it was affected by the production technology (p<0.05). The changes for tridecanoic, pentadecenoic, heptadecanoic, oleic t, g-linolenic om6, and linolenic om3 were statistically insignificant (p>0.05) during storage.
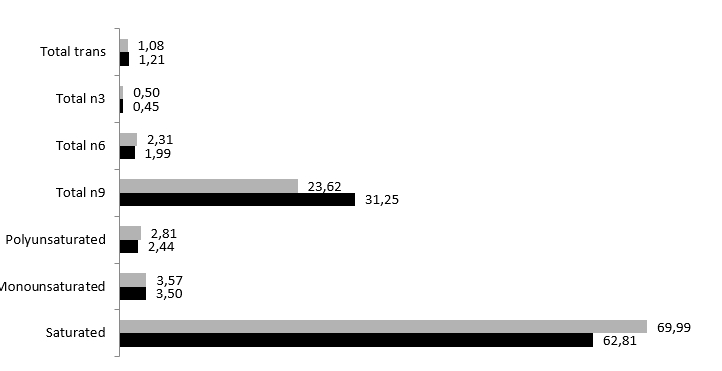
Figure 2. Cream (light) and yoghurt (dark) butter samples fatty acids profile (%)
The amount of saturated fatty acids was higher than unsaturated. The primary fatty acids of butter samples were palmitic (29.28-32.71 %), myristic (8.72-11.59 %), stearic (10.04-11.64 %), and oleic (22.6-30.21 %) acids (Table 2). Similar results were reported by Erkaya et al. (2015) and Samet-Bali et al. (2009) and higher than O’Callaghan et al. (2016). Yoghurt butter production showed higher butterfat HPI values than cream butter sample values (Table 2). The butter type affected the fatty acid profile, increasing oleic acid (C18:1). The HPI differences mainly resulted from an increased proportion of oleic acid (18:1n9c) in the butterfat (p=0.001). Similar results of HPI were reported by Bobe et al. (2007), who studied butter composition and texture from cows with different milk fatty acid compositions altering the cow's diet.
Pesticide evaluation
The chromatograms of organochlorine pesticides for the butter samples are shown in Figs. 3 and the recovery rates and maximum residue limits (MRLs) accepted by the Food Codex for OCs are presented in Table 3.
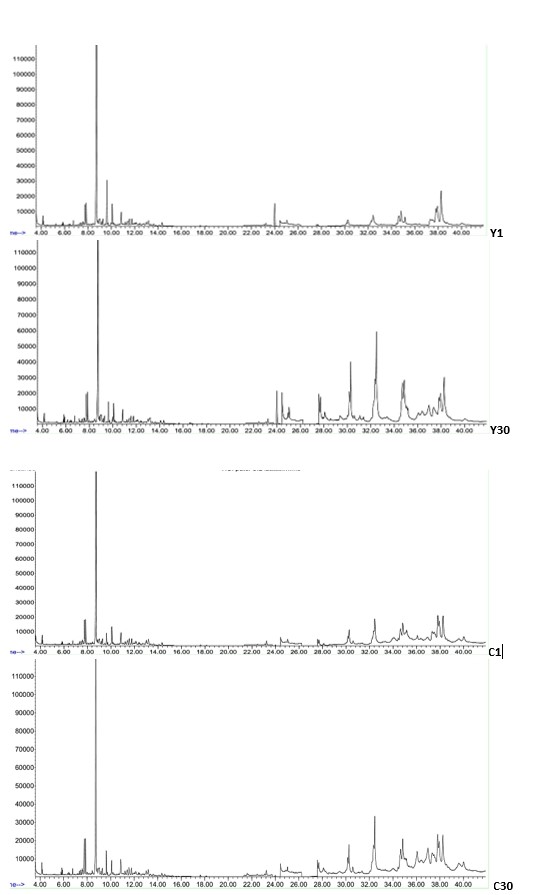
Figure 3. Chromatogram of organochlorine pesticide in yoghurt (Y1, Y30) and cream (C1, C30) butter
Pesticide residues detected in the present study are at lower concentrations compared to the studies in the butter samples of Turkey (Aksoy et al., 2013; Geyikçi and Büyükgüngör, 2011). Namely, all the detected concentrations in the present study still exceeded the legal limits of the Food Codex. Also, organochlorine pesticides (α-HCH, β-HCH, lindane, aldrin, dieldrin, heptachlor, heptachlor epoxide, chlordane, and the isomers and metabolites of DDT) in Spanish pasteurized milk were investigated.
Total of 95 % of the samples contained one of the isomers of the HCH group, and 12.9 % of them exceeded the maximum residue limit permitted by the European Union; six samples went over that limit for heptachlor epoxide, and 74.63 % of the samples contained chlordane at higher concentrations than those permitted by the legislation. None of the samples exceeded the limit for the DDT group (Martinez et al., 1997).
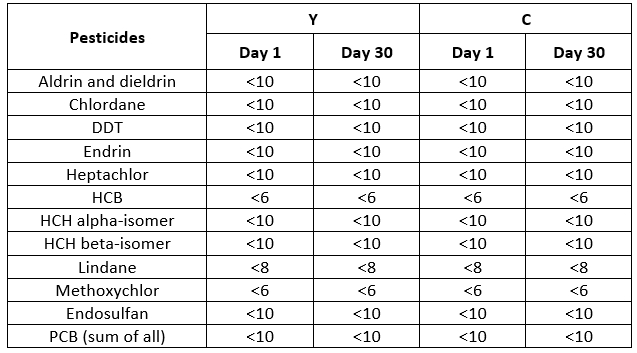
Table 3. Pesticides in the yoghurt (Y) and cream (C) butter samples during storage (µg/kg)
Sensory properties
Figure 4 shows the sensory evaluations of the quality parameters of the butter samples obtained by the scoring method. Yoghurt butter samples received an average rating of more, around 5.0 for appearance, which means they satisfied the appearance. Slightly lower grades of cream butter were affected by the non-homogeneous appearance on the surface, probably due to poorer kneading of cream butter.
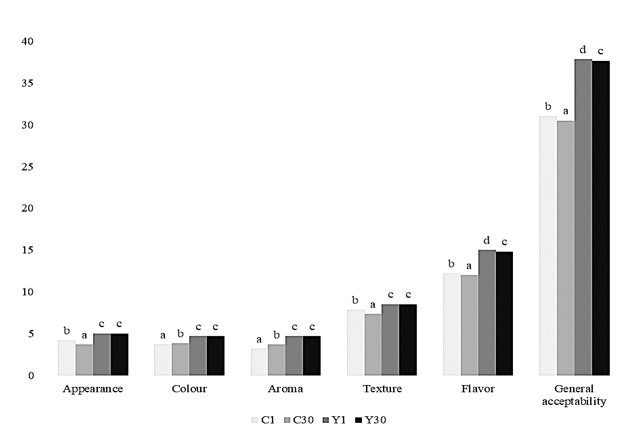
Figure 4. Sensory evaluation of cream (C) and yoghurt (Y) butter samples during storage (a-d, significantly different, p<0.05)
The production methodology, i.e. yoghurt or cream processing, significantly affected colour, flavour, structure, and acceptance scores; however, it was determined that the scores of yoghurt butter were not affected by storage at the p<0.05 level. Similarly, Mann and Sachdeva (2014) also reported that the colour scores were affected by the inoculum concentration of probiotic bacteria in yoghurt. The L*, a*, b* values for cream butter varied significantly (p<0.05) from 56.55 to 58.67; 1.28 to -0.06; 34.87 to 36.15 and for yoghurt butter from 75.87 to 65.83; -10.24 to -6.78; 42.34 to 39.01, respectively (data not shown). In contrast with our results, Erkaya et al. (2015) observed changes (p<0.05) in the flavour, structure, and general acceptability scores throughout the storage period significantly. In general, the highest acceptability scores were obtained on the first day of storage, followed by a decrease in scores during storage. The same development was reported by Şenel et al. (2011) related to the total amount of free fatty acids value that may be responsible for the development of flavour defects in butter during storage.
Conclusions
There was a significant difference between the analysed samples in the lipid fraction and fatty acids composition. It can be said that the qualities of traditional butter are superior to cream butter. Based on these data, since fermentation makes a significant difference in product quality, it is possible and advantageous to use the starter culture on the cream storage before the churning. Modifying the fatty acid composition of butter by decreasing the proportions of 12:0, 14:0, 16:0, and stearic acid (18:0) and increasing the proportions of unsaturated and short-chain fatty acids improves its consumer-friendly acceptability and healthful fatty acid profile. A practical application is that industrial butter-making technology is made without adding lactic acid bacteria depending on the indigenous flora of the cream for ripening. No previous investigation on the profile of fatty acids of cream and yoghurt butter has been published and may ensure details to upgrade the technology and ripening. Starter cultures increased flavour evolution and control sensory attributes in matured butter, which can considerably economize butter production and health issues.
Acknowledgments
The authors acknowledge local producers and local manufacturing facilities from the villages of Tetova in the Pollog region of North Macedonia for technical assistance during yoghurt and cream butter production.
Profil masnih kiselina i rezidua pesticida u maslacu od vrhnja i jogurta tijekom skladištenja
Sažetak
Uzorcima maslaca proizvedenim od vrhnja (C) i jogurta (Y) određivan je sastav masnih kiselina (FA) i koncentracija rezidua pesticida. Rezultati su pokazali da maslac od jogurta ima viši indeks poboljšanja zdravlja (HPI) u usporedbi s maslacem od vrhnja i ukupne ocjene prihvatljivosti na kraju skladištenja. Maslac od jogurta sadržavao je 62,81 g 100 g-1 zasićenih, 3,50 g 100 g-1 jednostruko nezasićenih i 2,44 g 100 g-1 višestruko nezasićenih masnih kiselina, dok je maslac od vrhnja sadržavao 69,99 g 100 g-1 zasićenih, 3,57 g 100 g-1 jednostruko nezasićenih i 2,81 g 100 g-1 višestruko nezasićenih masnih kiselina. Koncentracija peroksida kretala se od 0,90 za uzorke maslaca od vrhnja do 1,44 mEq O2 kg-1 za uzorke maslaca od jogurta. Udio vlage iznosio je od 16,21 do 13,19 i 13,83 do 13,57 g 100 g-1, a ukupni udio lipida varirao je od 77,5 do 79,5 i 83,0 do 83,5 g 100 g-1 za uzorke maslaca od vrhnja i jogurta. Rezidui 13 pesticida u uzorcima maslaca nisu prekoračili maksimalno dozvoljene zakonske granice.
Ključne riječi: tradicionalni maslac; industrijski maslac; peroksidni broj; indeks promicanja zdravlja; skladištenje
References
EN 15662:2018: Multimethod for the determination of pesticide residues using GC- and LC-based analysis following acetonitrile extraction/partitioning and clean-up by dispersive SPE - Modular QuEChERS-method
Erkaya, T., Ürkek, B., Dogru, Ü., Çetin, B., Sengül, M. (2015): Probiotic butter: Stability, free fatty acid composition and some quality parameters during refrigerated storage. International Dairy Journal 49, 102-110.http://dx.doi.org/10.1016/j.idairyj.2015.04.011
Şenel, E., Atamer, M., Öztekin, Ş. (2011): The oxidative and lipolytic stability of yayık Butter produced from different species of mammal’s milk (cow, sheep, goat) yoghurt. Food Chemistry 127, 333-339.https://doi.org/10.1016/j.foodchem.2011.01.012