
Introduction
Processed cheese is preferred to prepare different kinds of foods by many fast-food restaurants and individual consumers because of its unique texture, taste, flavor, and easy-to-handle and easy-to-eat characteristics. Processed cheese is manufactured using natural cheeses with different ripening degrees and by using emulsifying agents, such as monophosphoric or polyphosphoric acid salts. Different recipes, processing stages, and storage conditions are used in the production of processed cheese depending on local legislation and consumer demands in each country (Mohamed et al., 2020). Different ingredients, compositions, and processing conditions are used in the production of processed cheese; therefore, several types of processed cheeses are produced worldwide. On the basis of physical properties, Codex Alimentarius defines two categories of processed cheeses, namely processed cheese (PC) and spreadable processed cheese (SPC). Moreover, three groups, namely pasteurized processed cheese (PPC), pasteurized processed cheese food (PPCF), and pasteurized processed cheese spread (PPCS), were defined in the Code of Federal Regulations (CFA) by the Food and Drug Administration (FDA, 2006). The processed cheese groups differ on the basis of their moisture level, fat content, allowed ingredients, and the compositional specifications of the products. The CFA does not permit the use of milk protein products, including milk protein concentrate, to produce PC, PCF, or PCS. Moreover, it specifies that PPCF and PPCS should contain a minimum of 51 % (w/w) of natural cheese in the final product. However, Codex Alimentarius allows the usage of milk products other than cream, butter, and butter oil in the formulations of PC or SPC (Kapoor and Metzger, 2008; Codex Alimentarius, 1978).
Because of the growing concern regarding consumer health, several studies have focused on the development of dairy foods that include probiotics, prebiotics, or bioactive ingredients (Silva et al., 2022; Siyar et al., 2022; Silva et al., 2021). A study emphasized that the nutritional value of PC increases by supplementing the cheese with bioactive ingredients, and such products provide additional health benefits to the consumers (Talbot-Walsh et al., 2018). The incorporation of bioactive compounds, including probiotics, prebiotics, vitamins, and plant flavonoids, in PC products, has been widely studied (Silva et al., 2021; Mohamed et al., 2020; Solhi et al., 2020).
Today, pseudocereal seeds have attracted the attention of cheese manufacturers owing to their functional and nutritional values. Among pseudocereals, chia, quinoa, and teff are the most popular ones and are highly nutritious and gluten-free compared with conventional cereals, such as wheat, barley, and triticale. Chia seeds have linoleic (omega-6 fatty acid) and α-linolenic acids (omega-3 fatty acid) at the highest level. Compared with other cereals, quinoa seeds have higher levels of methionine, cysteine, and lysine. The contents of crude, soluble, and total fiber are much higher in teff than in wheat, sorghum, and maize. Moreover, owing to higher amylose content, lower starch damage, and amylose-lipid complex, teff has a lower glycemic index than other cereals (Barretto et al., 2021; Ullah et al., 2016; Vega-Gálvez et al., 2010). Several studies have investigated the effects of pseudocereal usage on the nutritional properties of baked foods, such as bread, gluten-free cake, biscuits, and meat and fish products (Mousa, 2022; Pintado et al., 2018; Santillán-Álvarez et al., 2017). However, studies on the inclusion of pseudocereals, including teff, chia, and quinoa seeds, in dairy products and studies investigating the effects of pseudocereal inclusion on the physicochemical properties of dairy products are scarce (Abdelmontaleb et al., 2021; Boldori et al., 2020). In a more recent study by Abdelmontaleb et al. (2021), it was reported that ultrafiltered (UF) cheese with added quinoa flour had higher contents of protein, fat, ash, and dietary fiber and higher total phenolic and antioxidant activities than those without added quinoa flour. Moreover, syneresis decreases substantially in UF cheese with added quinoa flour, and such cheese has a less soft, more gummy, chewy, and springy texture. Boldori et al. (2020) reported that the use of chia seeds for the partial replacement (50 %) of fat in cream cheese is well accepted.
This study evaluated the effects of added chia, quinoa, and teff seeds on some physicochemical, textural, and microbiological properties of SPC. The characterization of volatile profile and evaluation of consumer preference of SPCs supplemented with pseudocereal seeds were also performed.
Materials and methods
Materials
Chia, quinoa, and teff seeds were purchased from the local market in Uşak, Türkiye. All ingredients for the production of SPC were obtained from Muratbey Food Co. (Uşak, Türkiye), and the cheese samples were produced in the same company’s dairy plant.
Preparation of chia, quinoa, and teff seeds
Before using chia, quinoa, and teff seeds to produce cheese samples, all seeds were roasted for microbial stabilization. In brief, all seeds were cleaned to remove impurities. Approximately 2 kg of the seeds were roasted at 65 °C for 30 min in a conventional turbo oven (Beko, AFM 22300, Türkiye). Subsequently, the seeds were packed in aseptic plastic pouches and stored at 20 °C until use.
Production of SPC
All SPC samples were produced in duplicates by following the steps used in the production of conventional spreadable cheese (Figure 1). A 3 % supplementation rate was determined for all seeds on the basis of pre-experiments and judgments of three experts in cheese and sensory evaluation. The produced cheese samples were filled in plastic caps (polystyrene) with an aluminum foil lid seal and stored at 4 °C for 90 days. Color parameters, pH, total acidity (%), water-soluble nitrogen (%), total mesophilic aerobic count (TMAC), total coliform count (TCC), and total yeast and mold count (TYMC) of the cheese samples were evaluated at 15-day intervals during storage.
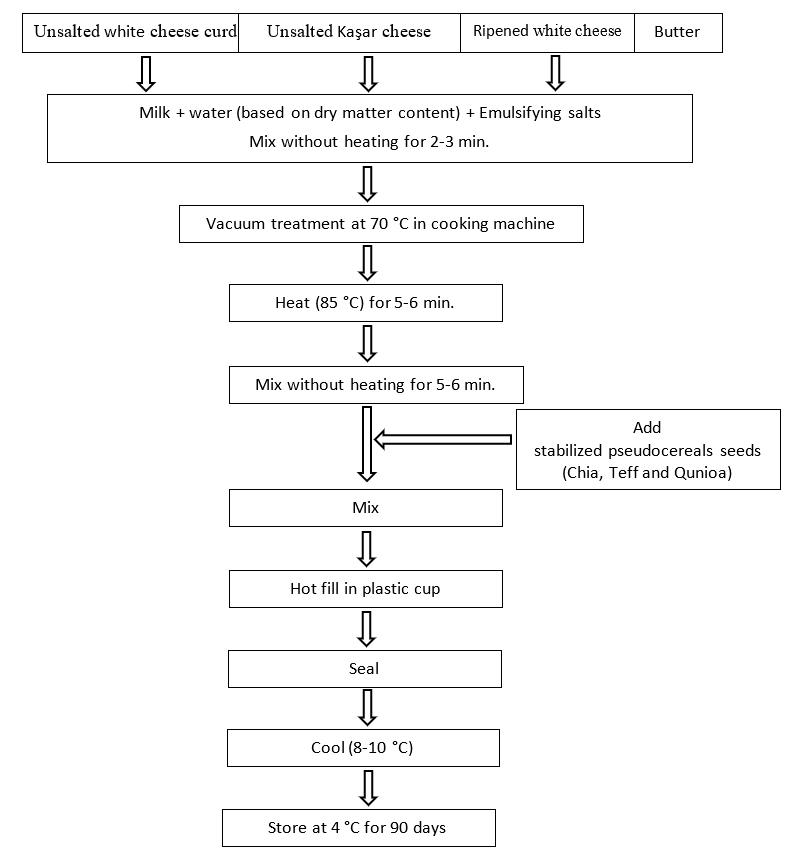
Figure 1. Flowchart of spreadable processed cheese (SPC) sample production
Compositional analysis
The contents of dry matter (%), fat (%), and total protein (%) of the cheese samples were determined using FoodScanTM Near-Infrared Analyzer (Hillerød, Denmark). The pH, titratable acidity (lactic acid, %), salt (%), and ash (%) content of the cheese samples were determined according to the method of Bradley et al. (1992). The water-soluble nitrogen (WSN%) content of the cheese samples was determined according to the method of Kuchroo and Fox (1982). To obtain water-soluble extracts of the cheese samples, 10 g of the sample was mixed with 50 mL of distilled water at 40 °C. The mixture was then homogenized using an Ultra-Turrax homogenizer (Daihan HG15-D, Korea) and incubated at 40 °C in a water bath for 1 h. Subsequently, the mixture was centrifuged at 3000 x g for 30 min at 4 °C. The fat layer was discarded, and the supernatant was filtered with Whatman filter paper No. 42. Subsequently, 10 mL of the filtrate was used to determine the WSN content according to the micro-Kjeldahl method. The WSN content was expressed as % of total nitrogen.
Color analysis
L*, a*, and b* values of the cheese samples were determined using a Minolta CR-400 colorimeter (Minolta, Japan); the hue and chroma values were calculated from a* and b* values on the basis of the ISO-CIE (2008) guidelines.
Rheological measurements
The viscosity of the cheese samples was measured using a Brookfield LVDV-II+PRO viscometer (Brookfield, Middeleboro, USA), with spindle S31 rotating at 3, 4, 6, 8, and 9 rpm at 20 °C. The consistency coefficient (K) and flow behavior index (n) of the cheese samples were calculated according to the Ostwald-de Waele Model (Dogan and Kayacier, 2007).
Analysis of volatile compounds
The solid phase microextraction (SPME) method was used for extracting volatile compounds from the cheese samples. In brief, approximately 3 g of the sample was weighed in a 40-mL vial, and 1 g of NaCl and 5 µL of the internal standard (a mixture of 2-methyl valeric acid and 2-methyl 3-heptanone) were added to it. The vial was vortexed (Biosan V-1, Riga, Latvia) for 1 min and incubated at 40 °C in a water bath for 20 min to equilibrate the volatile compounds in the headspace of the vial. Subsequently, a 2-cm SPME needle (50/30 µm Divinylbenzene/Carboxen/Polydimethylsiloxane stable flex, Bellafonte, USA) was inserted into the vial and exposed for 20 min. The SPME needle was injected into the gas chromatography-mass spectrometry (GC-MS) system (HP 6890 and 7895C MS, Agilent, USA). The GC-MS condition was programmed according to the method of Demirkol et al. (2016). Quantitative analysis of the volatile compounds was performed as described by Avsar et al. (2004).
Microbiological analysis
TMAC, TCC, and TYMC of the cheese samples were determined according to the pour plate method (Maturin and Peeler, 2001) and were expressed as log CFU/g cheese.
Sensory analysis
Consumer preference of the cheese samples was evaluated in terms of appearance (color and brightness of the cheese samples), texture in the mouth (roughness), and aroma/taste (sweet, salty, sour, creamy aroma, and overall liking). A 7-point hedonic scale (1 = dislike extremely, 4 = neither like nor dislike, 7 = like extremely) was used for evaluating consumer preference by 80 panelists (44 women and 36 men) aged 21-27 years. For this, 10 g of the cheese samples were presented to the panelists in 3-digit-coded Styrofoam plates. Water was provided to cleanse the palate between each sample evaluation (Meilgaard et al., 1999).
Statistical analysis
One-way analysis of variance (ANOVA) was used to determine the effect of added pseudocereal seeds on the general composition of the cheese samples. Two-way ANOVA was also conducted to determine the differences among the cheese samples in terms of pH, total acidity, color, and microbiological properties during storage (Sheskin, 2004). The Tukey’s test was conducted to compare statistically significant differences at a significance level of p≤0.05. Nonparametric Kruskal-Wallis and Dunn’s tests were performed to analyze the consumer preference test data (Sheskin, 2004). Multidimensional scaling analysis was also performed to evaluate the volatile profiles of the cheese samples. All statistical analyses were conducted using the Minitab 16.0, NCSS 2007 07.1.21, and IBM SPSS Statistics 23 software.
Results and discussion
Composition of cheese samples
The proximate composition of the cheese samples is provided in Table 1. The results of the variance analysis revealed significant differences among the cheese samples in the contents of dry matter, protein, and fat (p≤0.05); however, all cheese samples had similar contents of ash and salt. Moreover, the highest dry matter content was observed in the spreadable cheese supplemented with teff seeds (SCT; 39.93 %), whereas the control cheese sample had the lowest dry matter content. The spreadable cheese supplemented with chia seeds (SCC) sample had higher fat content than others, and no significant difference in fat content was observed among the control, spreadable cheese supplemented with quinoa seeds (SCQ), and SCT samples. The highest protein content (11.93 %) was determined in the SCQ sample, followed by the SCT sample. The ash and salt contents of the cheese samples ranged from 3.26 % to 3.58 % and 1.62 % to 2.28 %, respectively (Table 1). The differences in dry matter, fat, and protein contents of the cheese samples could be attributed to the physiochemical characteristics of pseudocereals. Niro et al. (2019) revealed that teff, quinoa, and chia seeds obtained from Italian specialized shops had 11.5 %, 11.5%, and 8.4 % moisture content, respectively. Moreover, the authors detected a higher fat (35.4 %) and protein (21.4 %) content in chia seeds than in quinoa and teff seeds. The findings of the present study are in agreement with those of previous studies (Khalifa et al., 2020; Faid, 2017). El-Dardiry et al. (2017) reported that SPC samples with varying proportions of quinoa paste (10-40 %) had 38.82-42.45 % dry matter, 17.57-18.39 % fat, 9.5-13.27 % protein, 2.01-3.74 % ash, and 1.06-1.62 % salt; these results are similar to our findings. In another study by Khalifa et al. (2020), low-fat camel milk cheese spreads supplemented with quinoa flour (1-3 %) had 40.09-42.84 % dry matter, 8.80-10.10 % fat, 10.62-11.24 % protein, and 2.95-4.56 % ash.
Table 1. Proximate composition of spreadable processed cheese samples
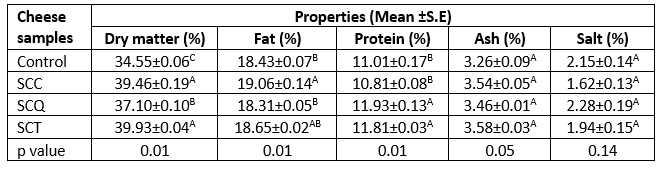
A-CMeans followed by different uppercase letters represent significant differences for the same chemical properties in each cheese sample (p≤0.05). SCC: spreadable cheese supplemented with chia seeds, SCQ: spreadable cheese supplemented with quinoa seeds, SCT: spreadable cheese supplemented with teff seeds. S.E: standard error.
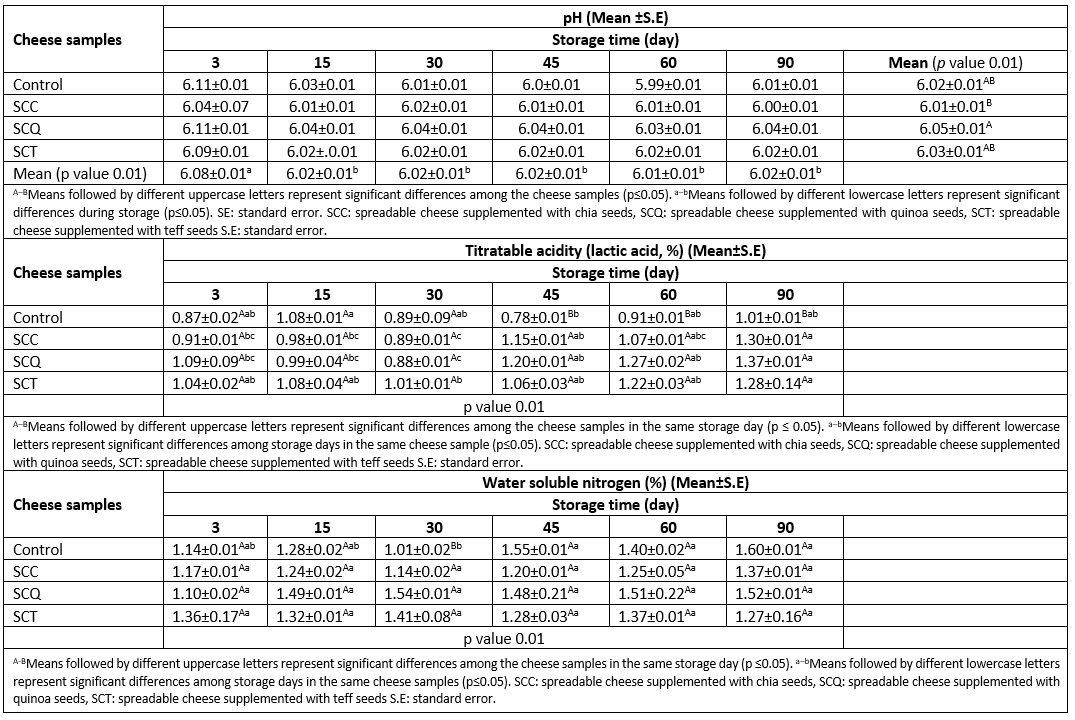
Table 2 lists the variations in pH and titratable acidity of cheese samples during storage. The pH value of cheese samples was affected by the storage time and type of pseudocereal. The interaction effect of the storage time and type of pseudocereal on titratable acidity of the cheese samples was significant (p≤0.05). The pH values of the cheese samples ranged from 5.99 to 6.11, and titratable acidity values ranged from 1.37 to 0.78 during storage. The highest pH value was determined in the SCQ sample, whereas the SCC sample had a lower pH value than the others. A slight increase in titratable acidity was observed in the cheese samples during storage, and no significant differences were observed in the titratable acidities of cheese samples during the first 30 days of storage (p≥0.05). After the first 30 days of storage, the control sample had lower acidity than other cheese samples (Table 2). This could be related to changes in pseudocereal components, such as protein and carbohydrate, and their interactions with other cheese components (emulsifying agents) and microbial flora. Faid (2017) reported a slight increase in titratable acidity of soft cheese samples supplemented with chia seeds during 30 days of storage at 5 °C, a finding similar to that of our study. Titratable acidity values ranged between 0.63 % and 1.28 %. In a study by Mohamed et al. (2020), the pH values of processed cheese samples fortified with different levels of Spirulina maxima ranged between 5.62 and 5.65; these values were lower than those observed in the present study. Similarly, Solhi et al. (2020) reported that the pH values of processed cheese samples fortified with tomato powder at a proportion of 1 %, 2 %, and 4 % increased during 90 days of storage and ranged between 5.49 and 5.80. In a more recent study by Abdelmontaleb et al. (2021), a much higher decrease in the pH values and a much higher increase in titratable acidity of UF soft cheese samples supplemented with quinoa flour compared with control samples without quinoa flour were observed. The pH range in UF soft cheese samples supplemented with quinoa flour was 5.53-6.17. Therefore, the components used for fortification of processed cheese and recipe and ingredients (e.g., emulsifying salts and milk protein) used in the production of processed cheese affect the pH and titratable acidities. Moreover, the slight increase in titratable acidities of the cheese samples during 90 days of storage may be contributed by microbial flora and the interactions of components in the cheese matrix.
Variations in the WSN content of the cheese samples during storage are listed in Table 2. The WSN content slightly increased in all cheese samples; however, the increase was not statistically significant (p<0.05, except for the control sample). The WSN content of the cheese samples ranged from 1.01 % to 1.60 % during storage. The lowest WSN content was observed in control samples on the 30th day of storage, and no significant differences were observed in the WSN content of cheese samples on other storage days. The lowest WSN content of the control samples observed on the 30th day of storage may be ascribed to random error in the WSN analysis. In general, the amount of solubilized proteins due to emulsifying salt activity is higher in processed cheeses (~60 % to 80 %) than in natural cheeses (~5 % to 20 %), and the protein solubilization mostly varies according to cheese formulation and processing conditions. The level of WSN in processed cheese indicates the effectiveness of emulsifying salt in solubilizing casein, which promotes fat emulsification in the cheese matrix and also affects the cheese texture (Lucey et al., 2011; Guinee, 2009). This study’s findings regarding the WSN content in the processed cheese samples are in agreement with those of previous studies (El-Dardiry et al., 2017; Awad et al., 2014; Ismail and Hamad, 2013). In a study by El-Dardiry et al. (2017), the soluble nitrogen content of processed cheese spreads containing different proportions of quinoa paste (10-40 %) ranged from 1.23 % to 2.33 % during 3 months of storage. Awad et al. (2014) reported that the soluble nitrogen content of processed cheese analogs supplemented with 25 %, 50 %, 75 %, and 100 % of lupine paste ranged from 1.75 % to 2.25 %, which was higher than our results. Ismail and Hamad (2013) reported a gradual increase in the WSN content of processed cheese spreads prepared with different cheese and dairy ingredients during 8 weeks of storage. They reported that processed cheese spreads prepared with a higher ratio of ripened Ras and Cheddar cheeses had a higher WSN content than those prepared with a higher ratio of precooked cheese and skim milk powder. The WSN content of processed cheese spreads prepared with ripened Ras and Cheddar cheeses ranged from 0.86 % to 1.06 %, which is similar to our findings.
Table 2. Changes in the pH, titratable acidity (lactic acid %), and water soluble nitrogen (%) of the spreadable processed cheese samples during storage
Color parameters
Color values of foods change depending on several factors, such as the properties of raw materials and ingredients, heat treatment, and storage conditions. Color is particularly associated with the flavor of food products. For instance, adding an appropriate amount of annatto, a natural yellow colorant, to Cheddar cheese milk evokes a better sensory perception from consumers (Sharma et al., 2020). The results of the variance analysis indicated that the storage time and type of pseudocereal interaction affected the color parameters of the cheese samples (p≤0.05, Table 3). The control and SCQ samples had higher L* and chroma values than the other samples at all storage time points, whereas a higher hue value was observed in the control sample than in other samples. L* values of the cheese samples ranged between 77.36 and 90.7, and the value of each sample did not change much during storage. A similar trend was observed in the chroma values of the cheese samples. Significant changes in the hue values were only observed in the SCT samples during storage (p≤0.05, Table 3).
Table 3. Changes in color values of spreadable processed cheese samples during storage
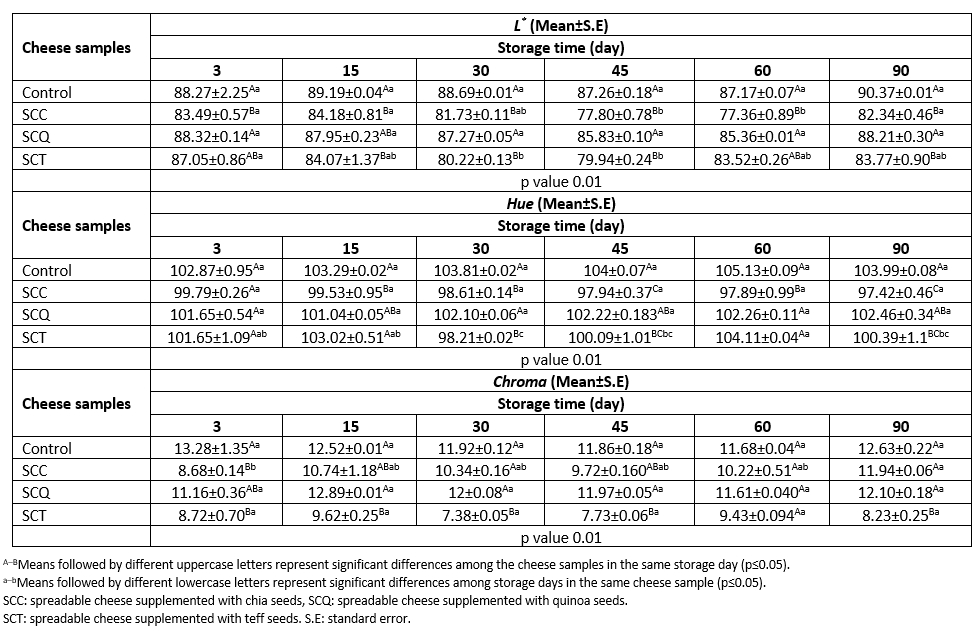
Several researchers have reported a wide range of color values for SPCs supplemented with different ingredients (da Cunha et al., 2010; Mohamed et al., 2020; Solhi et al., 2020). da Cunha et al. (2010) reported that Requeijão cremoso, an SPC, produced by substituting 25 % and 50 % of the dairy fat with vegetable fat had L* values of 85.89 and 86.08 and a values of 10.86 and 8.95, respectively. Abdel-Hamid et al. (2000) reported slight changes in the chroma and hue values of spreadable processed Ras cheese stored at 7 °C and 20 °C for 3 months; the values ranged between 21.74 and 22.1 and -79.35 and -79.90, respectively. Moreover, Khalifa et al. (2020) reported that the L*, chroma, and hue values of low-fat camel milk processed cheese spread supplemented with quinoa flour varied between 70.94 and 84.39, 12.48 and 18.33, and -17.29 and 89.96, respectively, depending on the supplementation ratio of quinoa flour.
Rheological properties
Table 4 lists the rheological parameters of the SPC samples. The apparent viscosity of the cheese samples decreased with increasing shear rate (data not shown). All cheese samples exhibited pseudoplastic behavior. The lowest apparent viscosity was determined in the control samples, whereas the SCT sample had the highest apparent viscosity values for all the shear rates. The Ostwald-de Waele model was used to describe the rheological properties of all cheese samples (R2>0.99). Both K and n values represent non-Newtonian flow behavior characteristics of liquid or semi-liquid foods. Both values were calculated according to the Ostwald-de Waele model by using a rheogram of food. The Ostwald–de Waele model also describes the effect of concentration on the apparent viscosity of food. When ∞>n>1, the liquid food is characterized as dilatant, and the liquid food exhibits pseudoplastic behavior in the case of 0<n<1. Moreover, the higher K value refers to the higher viscosity of non-Newtonian liquid foods (Rao, 2007). Therefore, the type of pseudocereal affected the K and n indices of the cheese samples. The K index of the cheese samples ranged from 2.277 to 2.550 Pa.sn, and the n index ranged from 0.528 to 0.665 (Table 4).
Table 4. Rheological parameters of spreadable processed cheese samples
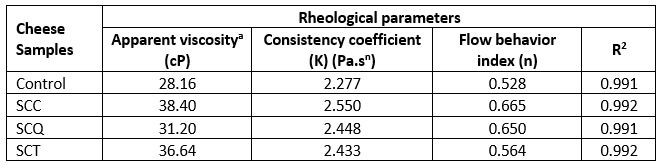
aThe apparent viscosity of the samples was expressed at 6 rpm. R2: determination coefficient. SCC: spreadable cheese supplemented with chia seeds, SCQ: spreadable cheese supplemented with quinoa seeds, SCT: spreadable cheese supplemented with teff seeds.
Several studies have reported large variations in the rheological parameters of SPCs supplemented with certain ingredients (El-Aidie et al., 2021; da Cunha et al., 2012; Dimitreli and Thomareis, 2004). Abdel-Hamid et al. (2000) reported that processed Ras cheese spreads with formulated emulsifying salt mixtures exhibited pseudoplastic behavior; this finding is similar to that of our study. Requeijão Cremoso processed cheese spreads prepared using different types of emulsifying salts, such as sodium citrate, sodium hexametaphosphate, sodium tripolyphosphate, and tetrasodium pyrophosphate, exhibited pseudoplastic behavior, lower n indices ranging from 0.24 to 0.36, and higher K values ranging from 232.9 to 701.7 Pa.sn; these results are similar to our findings. A study (da Cunha et al., 2012) reported that cheese supplemented with sodium hexametaphosphate has the strongest network structure and presented a low value for the flow behavior index, whereas the cheese manufactured with tetrasodium pyrophosphate had higher viscosity with the highest consistency index than those prepared with different emulsifying salts. Another study by Ferrão et al. (2018) reported that the reduction in sodium content and the addition of xylooligosaccharide caused a decrease in the consistency index of the Requeijão Cremoso processed cheese, whereas the reduction in fat content caused an increase in the consistency index. The consistency index and flow behavior index for Requeijão Cremoso processed cheese samples with reduced fat and sodium contents and added xylooligosaccharides ranged from 2.96 to 9.16 and 0.60 to 0.87, respectively; these results are similar to our findings. Similarly, Dimitreli and Thomareis (2004) reported that the K value (0.221-78.607 Pa.sn) and n indices ranged from 0.627 to 0.877 for seven different samples of processed Gouda cheese during processing with a temperature range of 55-95 °C. Overall, the observed differences in the rheological parameters for the processed cheese samples prepared in this study could be attributed to the interactions between pseudocereal ingredients and other cheese components. In addition, the content of polysaccharides and the types of dietary fiber of the pseudocereals may affect the rheological properties of the processed cheese.
Volatile compounds
The volatile composition of the SPC samples is listed in Table 5. A total of 27 volatile compounds, consisting of acids, aldehydes, ketones, esters, and terpenes, were identified. The number of volatile compounds varied in the cheese samples on the 3rd and 90th day of storage. In general, the amounts of acid volatiles in all cheese samples were higher than that of other volatiles; moreover, the cheese samples supplemented with pseudocereals had a higher amount of acidic volatiles than the control cheese sample. Amounts of butanoic acid, hexanoic acid, octanoic acid, and nonanoic acid in the cheese samples ranged from 639 µg/kg to 3284 µg/kg, 711.20 µg/kg to 2723.27 µg/kg, 187.60 µg/kg to 722.71 µg/kg, and 75.42 µg/kg to 206.02 µg/kg, respectively. The amounts of all acidic volatiles were higher in the SCQ samples and lower in the control sample (Table 5). This could be related to the volatile composition of the pseudocereals added to the SPC samples. Several studies have reported that quinoa, chia, and teff seeds and their oils contain different levels of acidic volatiles (Song et al., 2021; Jung et al. 2021; Goersch et al., 2019).
Methyl hexanoate, benzeneacetaldehyde, and ethyl octanoate were detected only in the cheese samples supplemented with pseudocereals and not in the control group. The SCT sample had lower amounts of methyl hexanoate and ethyl octanoate than other samples. The amount of benzeneacetaldehyde was similar in the cheese samples supplemented with pseudocereals. Moreover, β-pinene and γ-caprolactone were only determined in the SCC sample, whereas linalool and naphthalene were only determined in the SCQ sample. The average amounts of β-pinene and γ-caprolactone in the SCC sample on the 90th day of storage were 1.88 µg/kg and 1.22 µg/kg, respectively. The SCQ sample had approximately 1.93 µg/kg of linalool and 2.02 µg/kg of naphthalene during storage (Table 5). Acetoin, 2-heptanone, and 2-nonanone were detected in all cheese samples. However, the amounts of these compounds were higher in the SCC and SCQ samples than in the control and SCT samples. These findings can be attributed to differences in the volatile profile of the pseudocereals and the biochemical changes (e.g., degradation of proteins and lipids) that occurred in the cheese samples during storage (Song et al., 2021; Jung et al. 2021; Zhang et al., 2019; Goersch et al., 2019).
Table 5. Volatile profile of spreadable processed cheese samples during storage
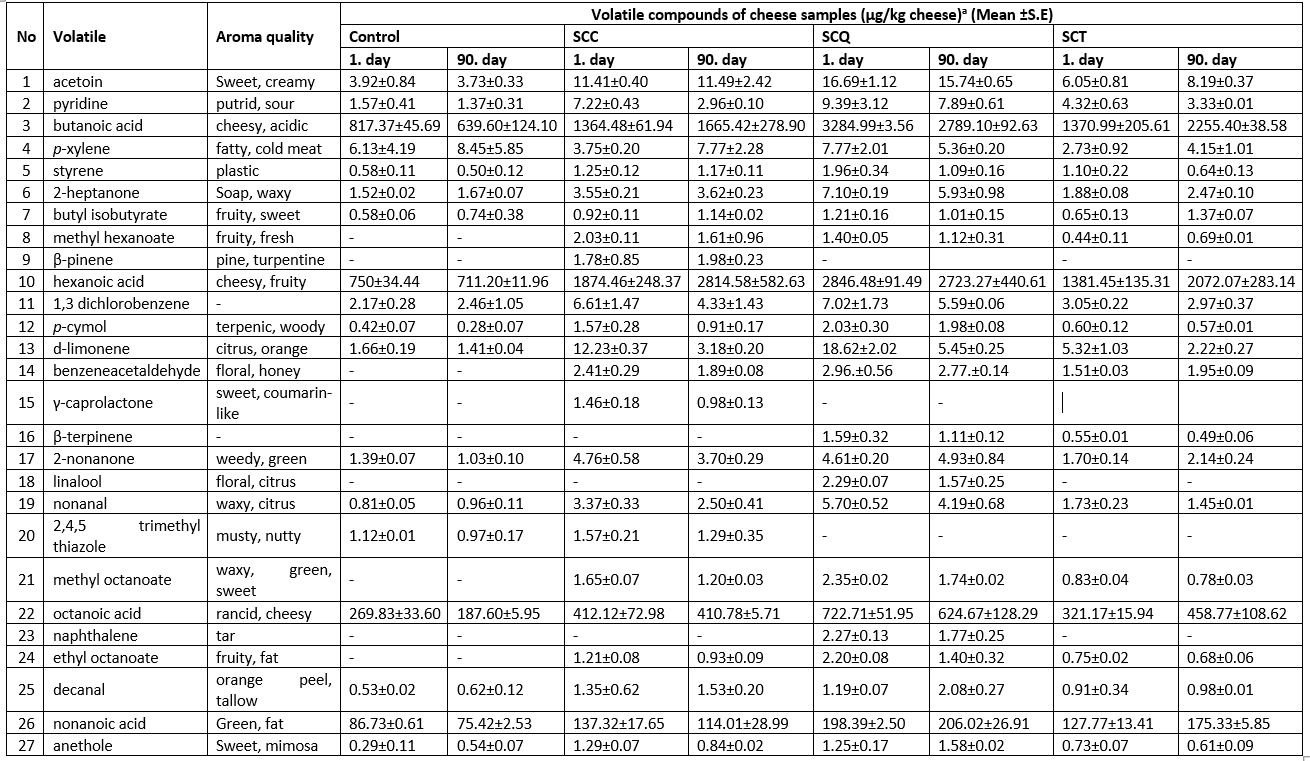
aMean relative abundance = (concentration of internal standard × peak area of compound)/(peak area of the internal standard), - not detected, SCC: spreadable cheese supplemented with chia seeds, SCQ: spreadable cheese supplemented with quinoa seeds, SCT: spreadable cheese supplemented with teff seeds. S.E: standard error.
Multidimensional scaling analysis (MDS) was performed to reveal the similarity and dissimilarities in the overall volatile profile of the cheese samples during storage. The MDS map of the SPC is illustrated in Figure 2. The results of the MDS analysis indicated that the SCT sample stored for 3 days and 90 days had a similar volatile profile to that of the SCQ sample stored for 3 days. The control samples stored for 3 days and 90 days and the SCT sample stored for 3 days contained another group of compounds containing a similar volatile profile. Hence, the SCC sample had a different volatile profile and could be separated from other cheese samples (Figure 2).
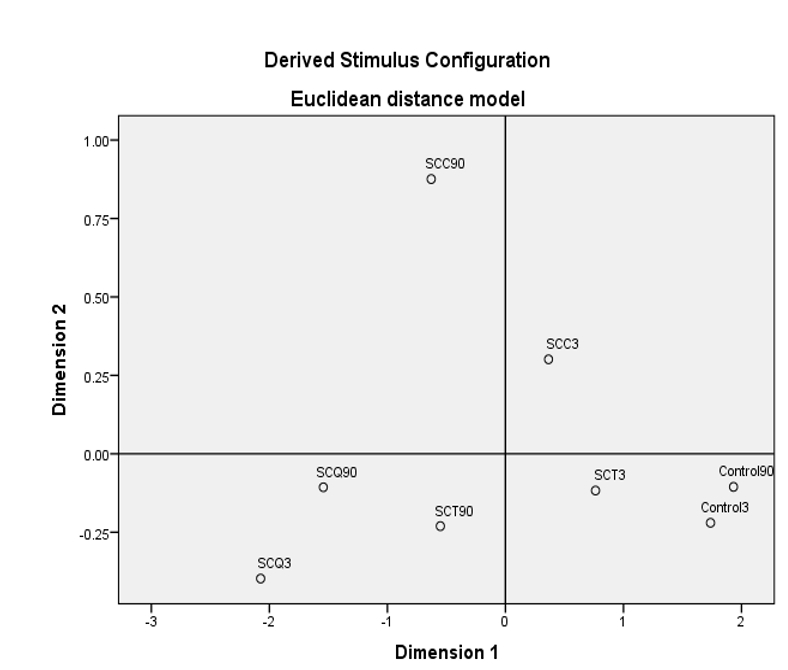
(Dimension 1 and 2 were established for the cheese samples on the basis of volatile profiles by using MDS analysis, Stress:0.00091, SRQ = 1, Control 1: Control cheese sample stored for 3 days, Control 90: Control cheese sample stored for 90 days, SCC1: spreadable cheese supplemented with chia seeds stored for 3 days, SCC90: spreadable cheese supplemented with chia seeds stored for 90 days, SCQ1: spreadable cheese supplemented with quinoa seeds stored for 3 days, SCQ90: spreadable cheese supplemented with quinoa seeds stored for 90 days, SCT1: spreadable cheese supplemented with teff seeds stored for 3 days, SCT90 spreadable cheese supplemented with teff seeds stored for 90 days)
Figure 2. Multidimensional scaling map of spreadable cheese samples in terms of volatile profile during storage
Several studies have been conducted on the volatile profile and sensory properties of different ripened cheeses (De Santis, and Fidaleo, 2022; Štefániková et al., 2020; Hickey et al., 2018). Studies on the aroma and sensory properties of processed cheeses supplemented with pseudocereals or other ingredients have attracted increasing attention in recent years. The evaluation of the identified volatile compounds revealed that these compounds were similar to those reported in the literature for certain types of cheeses and pseudocereals (Jung et al. 2021; Song et al., 2021; Sunesen et al., 2002; Vítová et al., 2012). Sunesen et al. (2002) identified 28 volatile compounds in processed cheese samples stored in different conditions. Acetoin, d-limonene, decanal, nonanal, 2-nonanone, and styrene were determined in commercial processed cheese samples, a result that is similar to our findings. The researchers also reported significantly increased levels of octane and aldehydes (including hexanal, heptanal, octanal, and nonanal) and decreased levels of 2-pentyl-furan in processed cheese samples stored in light than in processed cheese samples stored in the dark. In another study by Vítová et al. (2012), a total of 31 volatile compounds were determined in processed Edam cheese analogs on the basis of different types of fat. Among the volatile compounds, alcohols and fatty acids were predominant. The levels of ethanol, 2-butanol, acetic acid, butanoic acid, acetaldehyde, and 2-propanone were high in Edam cheese analogs. Similarly, Kohama-Kubouchi et al. (2020) reported that processed cream cheese samples manufactured using different mixing temperatures had high amounts of acetaldehyde, hexanal, acetic acid, butanoic acid, 2-pentanone, acetoin, and 2,3-butandione. Regarding the volatiles of pseudocereals, Song et al. (2021) reported that hexanal, acrolein, ethanol, 2-propanol, 2-propanone, propanoic acid, and propyl butanoate were the dominant volatiles in white, black, and red quinoas. A recent study by Yisak et al. (2021) reported that aldehydes were the major volatiles of the white and brown teff samples cultivated in Ethiopia. Furfural, 5-methyl-2-furancarboxaldehyde, and benzeneacetaldehyde were detected in both types of teff seeds at a high level. Tulukcu et al. (2019) reported major volatile compounds as hexanal, sabinene, α-pinene, α-thujone borneol, linalyl acetate, β-pinene, camphene, α-thujene, 2, 4(10)-thujadien, β-myrcene, limonene, eucalyptol, and camphor for some chia genotypes cultivated in Türkiye. The researchers determined a higher proportion of α-pinene (0.63-36.49 %), camphene (3.17-18.02 %), β-pinene (1.66-20.8 %), and eucalyptol (3.27-46.02 %) in the chia samples.
Microbiological properties
The TMAC, TCC, and TYMC were determined during storage to reveal the microbiological stability of the cheese samples. The TCC and TYMC of all cheese samples were <1 log CFU/g cheese during storage (data not shown), whereas the TMAC ranged from 2.21 log CFU/g cheese to 2.76 log CFU/g cheese (Table 6), with a sharp change in the TMAC not being observed in the cheese samples during storage. On the basis of the microbiological criteria for foodstuffs established by Commission Regulation (EC, No 2073/2005) (Anonymous, 2022) and the aforementioned findings, we concluded that the cheese samples had optimal stability in terms of microbiological load. The lower TMAC, TCC, and TYMC may be related to the higher heating temperature used for the manufacturing of processed cheese, relatively higher titratable acidity and possible bacteriostatic activities of the emulsifying salts. In general, 75-85 °C of the heating temperature is applied to the mixture of processed cheese ingredients until a hot uniform molten mass is obtained; moreover, a hot-filling process (>72 °C) with an aseptic condition is applied. These processes ensure the microbial stability of processed cheese and also assist in developing its structural properties (Fox et al., 2017). The findings on the microbial loads of the processed cheese samples in the present study are in good agreement with those of previous studies (El-Shibiny et al., 2013; Muir et al., 1999; Palmas et al., 1999; Rifky et al., 2018; Smigic et al., 2018). In a study by Muir et al. (1999), the numbers of total viable bacteria and TYMC of the processed cheese analogs prepared from different milk protein bases and fat substitutes ranged from 1 log CFU/g cheese to 3.8 log CFU/g cheese and 1 log CFU/g cheese to 1.53 log CFU/g cheese, respectively. The researchers also reported the absence of coliforms in any of the processed cheese analogs investigated in the study. El-Shibiny et al. (2013) reported that processed cheese spreads containing 2 % of rice bran exhibited a TMAC of 4.89 log CFU/g cheese and TYMC of 4.89 log CFU/g cheese; these results are higher than those observed in the present study. The TMAC and TYMC of the processed cheese spread supplemented with incorporated black pepper ranged from 2.34 log CFU/g cheese to 2.87 log CFU/g cheese and 1.1 log CFU/g cheese to 1.39 log CFU/g, respectively, during storage at 4 °C for 7 weeks; these findings are similar to those of the present study. Coliforms were not determined in the cheese samples (Rifky et al., 2018). Similarly, Smigic et al. (2018) reported that the TMAC in the processed cheese samples prepared using whey cheese with or without nisin ranged from 2.34 log CFU/g cheese to 2.87 log CFU/g cheese during 12 weeks of storage at 4 °C and 12 °C.
Table 6. The count of mesophilic aerobic bacteria of spreadable processed cheese samples during storage
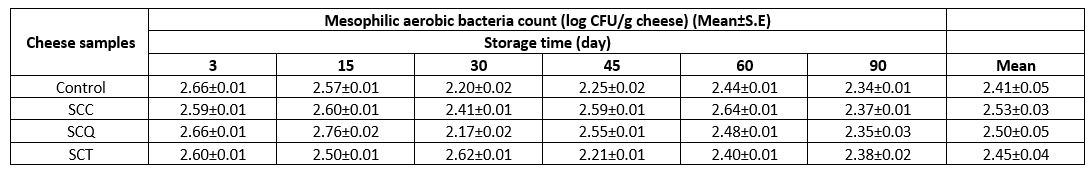
SCC: spreadable cheese supplemented with chia seeds, SCQ: spreadable cheese supplemented with quinoa seeds, SCT: spreadable cheese supplemented with teff seeds. S.E: standard error.
Sensory properties
In the development stages of new processed cheese formulations, knowing the effect of new ingredients on the sensory properties of processed cheese as well as their physicochemical properties is essential. Food products that are not preferred by consumers on a sensory level are considered unsuccessful formulations even if they are suitable in terms of nutritional values and compliance with international regulations. Therefore, to evaluate the consumer preferences of the cheese samples, a consumer test was performed using a 7-point hedonic scale. Significant differences were observed among the samples in terms of some sensory properties (Table 7).
Table 7. Sensory properties of spreadable processed cheese samples
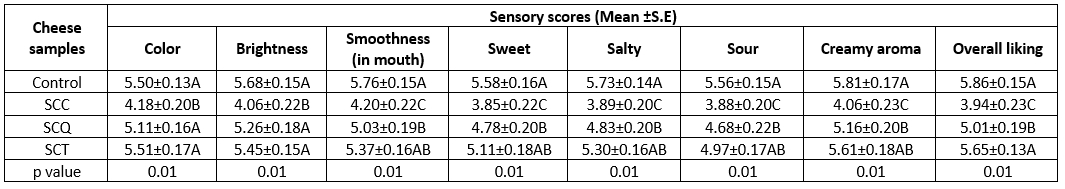
A-BMeans followed by different uppercase letters represent significant differences among the cheese samples in the same sensory property (p≤0.05). SE: standard error. SCC: spreadable cheese supplemented with chia seeds, SCQ: spreadable cheese supplemented with quinoa seeds, SCT: spreadable cheese supplemented with teff seed
The lowest consumer preference scores were obtained for the SCC sample. The consumers preferred the SCQ and SCT samples because of their color and brightness. The control cheese sample was mostly preferred for its smoothness (in the mouth), and no significant differences in consumer preference scores were observed between the SCQ and SCT samples. The control cheese sample was the most preferred cheese sample in terms of basic tastes (sweet, salty, and sour) and creamy aroma, whereas the second and last preferred cheese samples were the SCT and SCQ samples, respectively. The overall liking scores of the cheese samples supplemented with pseudocereals were evaluated. The results revealed that the SCT sample was the most liked SPC, whereas the SCC sample was the least preferred by consumers (Table 7). The lowest consumer preference scores were obtained for the SCC samples, which may be attributed to the relatively darker color of chia seeds than that of other seeds. Moreover, starchy flavor and tannic substances in chia seeds may affect consumer preferences. Kowaleski et al. (2020) reported that increasing the proportion of chia seeds in yogurt can affect consumer acceptance inversely. The yogurt supplemented with 6 % of chia seeds and the yogurt supplemented with 12 % strawberry had higher overall consumer acceptability. The lowest sensory scores and overall acceptability were observed for the yogurt supplemented with 14 % of chia seeds. Similarly, the addition of 0.8 % of chia seeds in ice cream caused a significant reduction in consumer acceptability (Ürkek, 2021).
Conclusions
In this study, the effects of pseudocereal supplementation and storage time on the physicochemical attributes, volatile profile, and sensory properties of the SPC samples were investigated. Pseudocereal addition increased the dry matter content of the cheese samples. The cheese samples supplemented with quinoa and teff had a higher protein content than the cheese samples supplemented with chia. Changes in storage time and the supplementation of pseudocereals in SPC samples altered the color, pH, titratable acidity, and WSN content significantly. However, the rheological behaviors of SPC samples supplemented with pseudocereals did not change. The K and n index values of the cheese samples changed depending on the type of pseudocereals.
Five volatile groups, including acids, aldehydes, ketones, esters, and terpenes, were identified in the cheese samples. The amounts of acidic volatiles were high in all cheese samples supplemented with pseudocereals. The most preferred cheese samples in terms of sensory properties were the SCT and SCQ samples. The SCC samples were less preferred by consumers because of the starchy flavor and tannic substances in chia seeds. The results indicated that pseudocereals, such as chia, quinoa, and teff seeds, could be suitable for the fortification of SPC to increase the physicochemical attributes. Further studies are required to reveal the nutritional value and health claims of processed cheese supplemented with bioactive ingredients.
Acknowledgements
The authors would like to thank Muratbey Food–Milk and Dairy Products Co. (Uşak, Türkiye) for providing the spreadable process cheese samples.
Karakterizacija fizikalno-kemijskih, reoloških, aromatskih i senzorskih svojstava topljenog sira za mazanje s dodatkom chia, quinoa i teff sjemenki
Sažetak
Procijenjena su fizikalno-kemijska, reološka, aromatska i senzorska svojstva topljenog sira za mazanje s dodatkom chia, quinoe i teff sjemenki. Procijenjene su promjene u sastavu, boji, reološkim parametrima, profilu hlapljivosti, senzorskim i mikrobiološkim svojstvima uzoraka sira pohranjenih na 4 °C tijekom 90 dana. Među uzorcima sira uočene su značajne razlike u početnom sadržaju suhe tvari, bjelančevina i masti. Na pH je utjecalo vrijeme skladištenja i vrsta dodane pseudožitarice. Štoviše, vrijeme skladištenja i vrsta interakcije pseudožitarica utjecali su na titracijsku kiselost i parametre boje uzoraka sira. Sadržaj dušika topljivog u vodi blago se povećao u svim uzorcima sira tijekom skladištenja. Uzorci sira s dodatkom pseudožitarica pokazali su pseudoplastično ponašanje. Indeks konzistencije uzoraka sira kretao se od 2,277 do 2,550 Pa.sn, a indeks tečenja od 0,528 do 0,665. Broj ukupnih koliforma i plijesni-kvasaca u svim uzorcima sira bio je <1 log CFU/g sira, a broj ukupnih mezofilnih aerobnih bakterija bio je u rasponu od 2,21 log CFU/g sira do 2,76 log CFU/g sira. U uzorcima sira identificirano je ukupno 27 hlapljivih spojeva, i to kiselina, aldehida, ketona, estera i terpena. Količine butanske, heksanske, oktanske i nonanske kiseline u svim uzorcima sira bile su veće od ostalih hlapljivih tvari, s količinama u rasponu od 639 µg/kg do 3284 µg/kg, 711,20 µg/kg do 2723,27 µg/kg. kg, 187,60 µg/kg do 722,71 µg/kg, odnosno 75,42 µg/kg do 206,02 µg/kg. Najpoželjniji sir u smislu senzorskih svojstava bio je kontrolni uzorak, a zatim SCT, SCQ i SCC uzorci.
Ključne riječi: topljeni sir za mazanje; pseudožitarice; funkcionalna svojstva; profil arome; senzorska analiza
References
Awad, R.A., Salama, W.M., Farahat, A.M. (2014): Effect of lupine as cheese base substitution on technological and nutritional properties of processed cheese analogue. Acta Scientiarum Polonorum Technologia Alimentaria 13, 55-64.https://doi.org/10.17306/J.AFS.2014.1.5
da Cunha, C.R., Alcântara, M.R., Viotto, W.H. (2012): Effect of the type of emulsifying salt on microstructure and rheological properties of "Requeijão Cremoso" processed cheese spreads. Journal of Food Science 77 (8), 176-181.https://doi.org/10.1111/j.1750–3841.2012.02797.x