
Introduction
Kačkavalj is a famous Serbian cheese which belongs to a diverse group of cheeses called pasta filata. They are historically connected and usually produced in countries of the Mediterranean region and named by different names such as Caciocavallo in Italy, Kasseri in Greece, Kačkavalj in former Yugoslavia countries, Kashkaval in Bulgaria and Kasar in Turkey (Guinee et al., 2015; Kindstedt et al., 2004; Kozhev, 2006). This type of cheese has a wide food application, as they are being used as an ingredient in a variety of foods, particularly in pizza (Albenzio et al., 2013).
The most well-known Kačkavalj cheese is the one produced in the municipality of Pirot located in south-east part of Serbia, as well as the other municipalities on Stara Planina Mountain, such as Dimitrovgrad and Knjaževac (Miocinovic and Miloradovic, 2019). Therefore, these popular cheeses called: "Pirotski Kačkavalj", "Staroplaninski Kačkavalj" and "Krivovirski Kačkavalj" have been even certified with a sign of appellation at national level (Ostojic et al., 2012). Additionally, a significance of this cheese type could be seen from fact that the Institute for Standardization of Serbia (1997) established the National Standard for Quality Requirements in order to define and standardize production phases and characteristics of Kačkavalj cheese. It is important to investigate if Kačkavalj cheese comply these requirements of National Standard (National Standard for Quality Requirements). The National Standard defines requirements for two types of Kačkavalj cheese: Kačkavalj and Kačkavalj Krstaš, regarding weight: 5 - 10 kg and up to 3 kg, minimum dry matter content (DM): 56 % and 54 %, respectively. Additionally, the minimum of 45 % fat in dry matter (FDM) is required, as well as the ripening period: minimum 8 and 4 weeks, respectively. Kačkavalj cheeses are produced by both traditional and industrial production scales in different regions of Serbia (Licitra et al., 2017). As other pasta filata cheese production, the specific process of thermal treatment and texturizing is the main characteristic of Kačkavalj cheese production. Before these steps, cheese curd is matured/fermented until pH value reached 5.2 as a result of the activity of indigenous microbiota as in traditional production or added starter culture, typical for industrial production. After proper acidification, the curd is submerged in hot water (whey or salt brine) which contribute to the plastic consistency of these types of cheese (Alichanidis and Polychroniadou, 2008; Kindstedt et al., 2010). During this step, the hot curd is also kneaded by hand or mechanically, which strongly affects the cheese texture.
Pasta filata cheeses, including Serbian Kačkavalj, are characterized by a different period of ripening, depending on the cheese type, which strongly influences the formation of their sensory properties. Proteolysis is one of the most important biochemical processes during cheese maturation, having a great impact on the flavour and texture of cheese (Corrigan et al., 2021; Fox and McSweeney, 1996; Licitra et al., 2017). Following factors affect the proteolysis of cheese: activity of enzyme such as plasmin and chymosin, peptidases and proteinases originating from the starter and non-starter bacteria, time, humidity and temperature of the cheese maturation, cheese pH value and composition, especially salt content (Bonanno et al., 2013; Jovanovic et al., 2007; Miocinovic et al., 2014). The traditional cheese produced from raw milk obtains more distinctive sensorial properties than the ones produced from pasteurised milk (Montel et al., 2014). The microbiota viability is significantly influenced during curd texturizing in hot water. However, the proteinases and peptidases of lactic acid bacteria (LAB) have a significant role in proteolysis during cheese ripening due to their ability to hydrolyse large and intermediate peptides originated from casein to small peptides and amino acids (Hui and Evranuz, 2012).
Studies including analyses of the Serbian Kačkavalj cheeses are quite limited. Hence, this study had objectives to analyse chemical, textural and microbiological characteristics, colour and proteolysis rate of Kačkavalj cheeses found on the market and to investigate the variability degree between different cheeses and to compare their properties to the other similar pasta filata cheeses, as well as to investigate if they are compatible with the National Standard. The comprehensive characterization of Kačkavalj cheese was conducted in order to preserve and have better understanding of the quality of Kačkavalj cheese and to investigate the main characteristics which influences the unique and particular Kačkavalj cheese attributes.
Materials and methods
Cheese samples collection
12 samples of cheese declared as Kačkavalj cheese were purchased from the market in Serbia. All of the collected cheeses were labelled as Kačkavalj indicating that they must be produced and labelled according to National Standard. The transportation of the cheese to the laboratory was conducted in a portable refrigeration system. Thereafter, the cheese samples were labelled and kept at the refrigerator temperature of 4 °C until analysis.
The chemical analysis
All cheese samples were analysed for the chemical composition according to the following methods: fat content according to the method of Van-Gulik (FIL-IDF, 2008); dry matter ( DM) by standard drying method at 102±2 °C (FIL-IDF, 2004); the total protein ( TP) content by analysing total nitrogen (TN) content determined by the Kjeldahl method multiplied by 6.38 (FIL-IDF, 2014); NaCl content according to the Volhard method (FIL-IDF, 1988). Further parameters were calculated, according to the determined characteristics, such as fat in dry matter ( FDM) and moisture in non-fat solids (MNFS). The pH value was determined in all of the cheese samples using a digital pH-meter (Consort, Turnhout, Belgium) in cheese slurry (mixture of 10 g homogenised cheese and 10 mL distilled water) (Ardö and Polychroniadou, 1999). All samples were analysed in triplicate.
Proteolysis assessment
Conducting Urea Polyacrylamide Gel Electrophoresis, the proteolytic changes αS1-casein (αS1-CN) and β-casein (β-CN) can indicate the high activity of rennet that was added during the production, as well as native enzyme plasmin. Urea Polyacrylamide Gel Electrophoresis (UREA PAGE) was conducted according to Andrews (1983). The vertical slab unit TV200YK (Consort, Belgium) with 100 x 200 x 1 mm slabs was used during UREA PAGE conducting, using Tris-glycine electrode buffer at a constant current of 60 mA and a maximum voltage of 300 V during 3 h, in a 4 % stacking gel (pH 7.6) and 12 % separating gel (pH 8.9). The densitometry of gel electrophoretograms was performed using ImageJ program in order to rate the degradation of casein fractions. The area of bands β-CN, αS1-CN, and the degradation products were determined as a percentage of the total band area. All samples were analysed in triplicate.
Cheese samples were analysed by methods of Kuchroo and Fox (1982) and Stadhousers (1960) for water-soluble nitrogen (WSN) and 5 % (v/v) phosphotungstic acid-soluble nitrogen (PTA-SN) content, respectively. They are presented as a percentage of total nitrogen (WSN/TN and PTAN/TN). All samples were analysed in triplicate.
Microbiological analysis
Microbiological analysis was conducted according to Mirkovic et al. (2021). In sterile conditions, 10 mL/g of Kačkavalj cheeses were aseptically sampled, diluted in 90 mL sodium citrate (2 % (w/v)) and homogenized during 3 minutes in a stomacher (Interlab, BagMixer 400P), after which ten-fold dilutions were prepared for microbiological analysis. Appropriate dilution was plated on MRS agar (Merck, Darmstadt, Germany) for lactobacilli (LAB MRS) enumeration, while M17 agar (Merck, Darmstadt, Germany) supplemented with 0.5 % glucose was used for enumeration of lactococci (LAB M17). Mesophilic and thermophilic LAB were incubated at 30 °C and 42 °C during 48 h, respectively, and LAB (MRS) were incubated anaerobically (GasPak Jar, BBL, Kansas, USA). Microbiological analyses were carried out in triplicate.
Texture profile analysis
Texture profile analysis (TPA) was conducted for twelve Kačkavalj cheeses. The cheese samples were cut using a sharp cylindrical cutter. Cheese samples were compressed axially in two coherent cycles with 25 % deformation from the initial height of the sample. The TPA analysis included following textural parameters: hardness, springiness, cohesiveness, chewiness and resilience. The TPA analysis was carried out using a TA.XT Plus Texture Analyzer (Stable Micro System, Godalming, Surrey, UK) containing 5 kg loading cell and P/25 cylinder probe. The data was calculated from the force versus time curve, using the Exponent software provided by the same manufacturer. The TPA analysis was conducted measuring eight samples of each cheese. The texture profile was obtained according to method of Miocinovic et al. (2022) with some modifications.
Colour assessment
The colour assesment of the cheeses was determined using a computer vision system, as described by Tomasevic et al. (2019a, 2019b). Each Kačkavalj cheese was conducted in triplicate with eight replications. According to Milovanovic et al. (2020) the increase of the replicate number improves the precision of the colour assessment.
Statistical analysis
Analysis of variance ( ANOVA) was used to analyse the data of chemical, textural, and microbiological characteristics and the colour coordinates of Kačkavalj cheeses in SPSS program (IBM SPSS Statistics 21). The Tukey’s test was used to estimate the differences between means and were considered significant at p<0.05.
Hierarchical cluster analysis ( HCA) was performed using Ward’s clustering method with squared Euclidean distance interval in order to find potential similarity either dissimilarity/diversity between different Kačkavalj cheeses (Miocinovic et al., 2022).
Results and discussion
Chemical characteristics
The results of chemical characteristics of the Kačkavalj cheese samples are presented in Table 1. The results showed variations within chemical characteristics of Kačkavalj cheeses, which implies that there are different production methods of these cheese types.
Table 1. Chemical characteristics of Kačkavalj cheeses
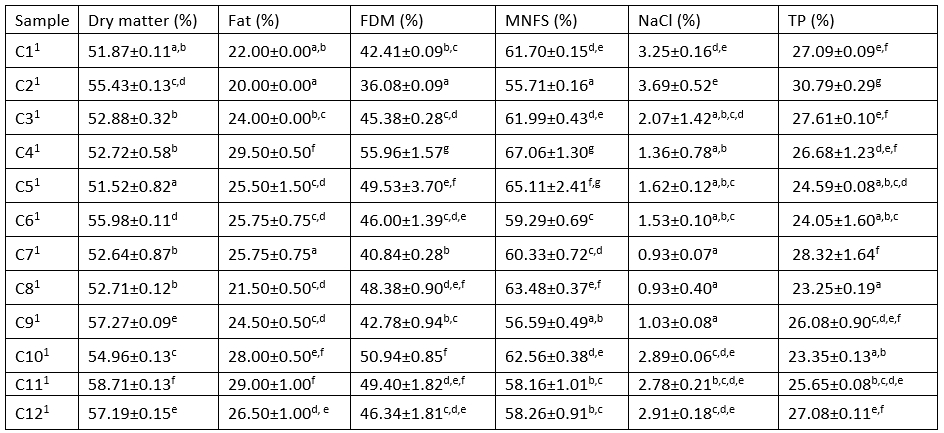
1Values are arithmetic mean ± standard deviation
Different superscript lowercase letters ( a-g) in the same column indicate significant differences (p<0.05)
FDM - fat in dry matter; MNFS - moisture in non-fat substance; TP-total protein
Cheese composition is important in order to investigate if Kačkavalj cheese comply to the National Standard for Quality Requirements (Institute for Standardization of Serbia, 1997). The National Standard defines requirements for two types of Kačkavalj cheese (Kačkavalj and Kačkavalj Krstaš) regarding weight (5 - 10 kg and up to 3 kg), minimum dry matter content (56 % and 54 % DM) and minimum fat in the dry matter (45 % FDM for both) as well as the ripening period (minimum 8 and 4 weeks). In terms of the defined minimum DM, even six of twelve (50 %) investigated cheeses do not comply to the National Standard requirements. According to MNFS that varied from 55.71 % to 67.06 % the most Kačkavalj cheeses belong to the semi hard cheese group. Moreover, all of the investigated cheeses were declared to have a minimum of 45 % FDM, however, it should also be emphasized that four of twelve cheeses (30 %) did not meet the National Standard, i.e. they did not have a minimum of 45 % FDM. According to the results obtained in our study, the term Kačkavalj was used although cheeses were not fully compliant with the National Standard. These findings may trigger a concern by some regulatory agencies in order to improve the control of fulfilling the requirements of the National Standard (Institute for Standardization of Serbia, 1997) and prevent the inadequate labelling of cheese. The lack of fulfilled requirements defined by the National Standard of this type of cheese was most probably associated with different ripening conditions and period, as well as the processing differences. It should be emphasized that the determined lower level of DM was probably strongly connected with product prices. The reason for such results probably lays down in low prices of cheeses when DM is below the required value as a consequence of market situation and consumers purchasing power. The results showed variations within chemical characteristics of Kačkavalj cheeses. This undoubtedly reflects different production methods of this type of cheeses that includes quality and type of raw milk, using of starter cultures, durations and conditions during ripening period etc. Statistical differences (p<0.05) were found in all Kačkavalj cheeses obtained from the Serbian market in terms of the content of dry matter, fat, fat in dry matter, moisture in non-fat substance and NaCl. Analysis of the published data shows a significant variation between the Kashkaval cheeses depending on milk used and region of manufacture. Ivanova et al. (2021) determined the Kashkaval composition at the end of ripening as followed: the content of dry matter 58.21 %; the content of fat 27.5 % and the content of salt 2.2 %. We could observe that these findings are in accordance with the results obtained from different Kačkavalj cheese analysed in this study. The Kashkaval cheeses usually contain fat from 24.5 to 28.0 %; salt from 2.52 to 4.67 % and pH is between 5.1-5.7 (Kamber, 2008; Sahan et al., 2008). The results obtained from our study in terms of fat content showed that 6 cheeses were in accordance with this interval (50 %). The variability of the fat content might be associated to the raw milk fat content used for cheese production. In terms of pH the majority of the investigated cheeses were within the mentioned interval usual for this type of cheese (Figure 1). In another study, the pH values were 5.34 and 5.16 for Kashkaval cheese from Galichnik and Lazaropole (Santa and Srbinovska, 2017) respectively which is in accordance with the obtained results. It could be observed that there were significant variations within the level of salt among investigated Kačkavalj cheeses in our study. Even more, some cheeses (40 %) were characterized with very high salt content probably as consequence of the traditional style manufacture where the high salt content was employed as a means for improving quality of cheese from milks of poor microbiological status (Guinee et al., 2015). Significant variations and high content of NaCl (3.8 %) were also found in study of Mijacevic and Bulajic (2004). Undoubtedly, the high difference between cheeses may influence on the inconsistency in properties of cheese. However, traditional Kačkavalj cheeses (Pirotski Kačkavalj, samples C10, C11 and C12) that are characterized with a sign of appellation at national level must have a high salt level (minimum 2.5 %) according to regulation (Ostojic et al., 2012). Despite that, in the future its necessary to standardize salt content in more narrow interval as well as to think about varieties of this cheese type with reduced salt content which is in agreement with modern diet strategy (Sun et al., 2021).
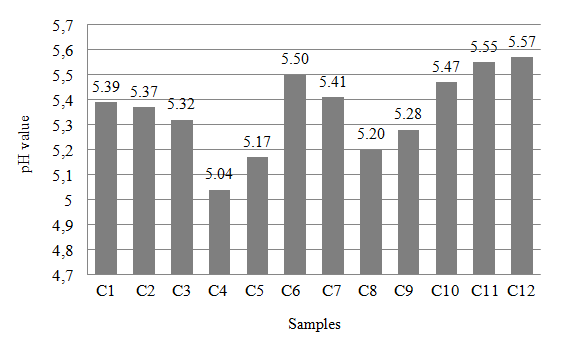
Figure 1. pH value of Kačkavalj cheeses
The results showed that samples contained total protein in the wide range from 23.25 % to 30.79 % (Table 2). Ivanova et al. (2021) determined that the content of total proteins in Kashkaval cheese at the end of ripening was 24.63±1.23 %, which was in accordance with the results obtained in our study. Andronoiu et al. (2015) found that the content of dry matter increased during maturation from 51.45 % to 58.28 %. Compared to our results, almost all of the samples were in compliance, only the sample C11 was slightly higher. According to Santa and Srbinovska (2014) the protein and fat content of Galichki kashkaval cheese after 100 days of ripening were 23.05±1.71 % and 27.87±0.85 % respectively which is in agreement with obtained results.
Table 2. Proteolysis parameters of Kačkavalj cheeses
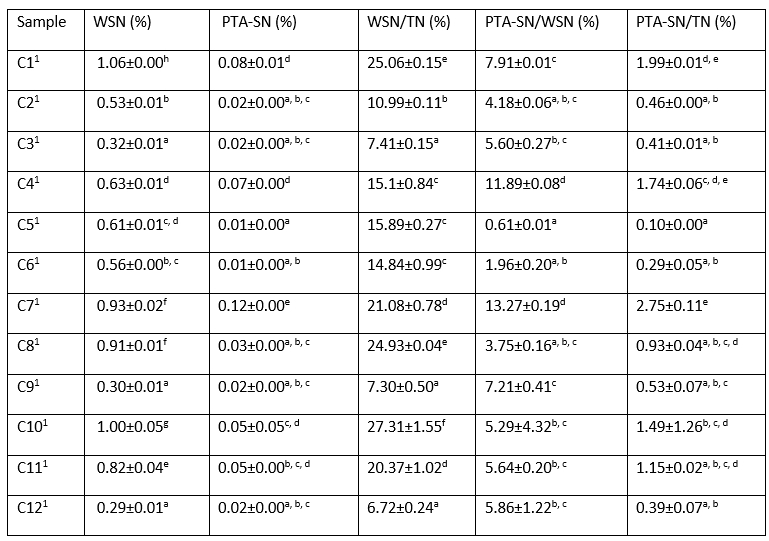
1Values are arithmetic mean ± standard deviation
Different superscript lowercase letters ( a-h) in the same column indicate significant differences (p<0.05)
TP - total protein; TN - total nitrogen; WSN - water-soluble nitrogen; PTA-SN-5% (v/v) phosphotungstic acid-soluble nitrogen
Proteolysis
The proteolysis parameters of investigated Kačkavalj cheeses, WSN/TN (%) and PTA-SN/TN (%) values are presented in Table 2. The ripening index WSN/TN (%) of Kačkavalj cheeses were in a wide range from 6.72 % to 27.31 %, indicating significant variations (p<0.05) and a non-uniform ripening rate. Literature data also showed high variations of ripening index for different types of pasta filata cheeses. Pappa et al. (2019) determined the ripening index of mature Kashkaval cheese to be in a range from 16.6 % to 22.9 %. Kačkavalj produced on traditional way without starter addition is characterized with higher ripening index compared to industrial produced cheeses (Guinee et al., 2015). Sulejmani and Hayaloglu (2016) presented that Macedonian Kashkaval cheeses ripened at 5 °C during 120 days were characterized with a very low rate of proteolyis and ripening index just about 10 %. It is evident that primary proteolysis depends on numerous factors, especially duration and conditions during ripening period, but also the method of cheese production. It is interesting to note that very low value of WSN/TN (%) found in some Kačkavalj cheeses is not connected to their high salt content. This is somewhat surprising but on the other side it had been known that primary proteolysis had been influenced by differences in rennet activity, ripening time and temperature and starter culture types. We noted that some of the investigated Kačkavalj cheeses showed low degree of proteolysis, however most of the cheese samples were in accordance with compared literature values. The free amino acids, dipeptides and tripeptides are soluble in the PTA-SN fraction and they are usually formed by the starter and non-starter culture activity on the casein and peptides (Tarakci, 2004). Thereafter, these fractions are known as the amino nitrogen, which indicates the peptidase activity in a cheese (Cagno et al., 2006). When it comes to PTA-SN/TN, the results of the analysis of Kačkavalj cheeses indicated significant differences (p<0.05). The PTA-SN/TN values of all cheeses were found to be in a range from 0.10 % to 2.75 %, (Table 2). These results were in accordance with the results of the study Pappa et al. (2019) who reported the range of PTA-SN/TN from 1.1 % to 2.5 % of 30 days - 180 days of Kashkaval cheese ripening. In another study, the range for the PTA-SN/TN (%) in Dil pasta filata cheese was from 0.94 % to 1.68 % (Hayaloglu and Karabulut, 2013). Futhermore, a wide range of WSN/TN and PTA-SN/TN values within investigated Kačkavalj cheeses could be noticed, which might be the result of variety of: the milk composition and quality, the used thermal treatments, microbiota and their activity in proteolysis, the cheese composition, the time and the conditions of the ripening.
Urea Polyacrylamide Gel Electrophoresis was used in order to obtain proteolysis profile of the Kačkavalj cheeses. The obtained results of casein fractions are presented in Table 3. The αS1-CN (%) fraction of all investigated cheese samples was in a range of the minimum of 19.96 % and the maximum of 30.52 %. The β-CN (%) fraction of all cheese samples is between the minimum of 19.28 % and the maximum of 27.98 %. In agreement with the electrophoretic for most hard-cheese varieties including Cheddar, Mozzarella, and Gouda, the concentration of intact β-CN was notably higher than that of αs1-CN in all cheeses. The protein bands with low mobility through electrophoresis gel were formed which corresponded to degradation products of αS1-CN (%) and β-CN (%). The degradation products of αS1-CN (%) as can be seen from Table 3 is between the minimum of 26.36 % and the maximum of 38.84 % and the degradation products β-CN (%) is between the minimum of 14.88 % and the maximum of 22.78 %. The results show the hydrolysis of αS1-casein and β-casein and the formation of degradation products which imply to the activity of both residual chymosin and plasmin (Guinee et al., 2015; Miocinovic et al., 2012).
Table 3. Casein fractions of Kačkavalj cheeses (% of total band area)

1Values are arithmetic mean ± standard deviation
Different superscript lowercase letters ( a-j) in the same column indicate significant differences (p<0.05)
αS1-CN - αS1-casein; β-CN - β-casein
Microbiological analysis
Cell count of LAB in Kačkavalj cheeses is presented in Table 4. Obtained results showed that all Kačkavalj cheeses had cell count above 6 log cfu/g for mesopihilic and thermophilic LAB, except for the number of thermophilic LAB (MRS) in sample C3 (5.54 log cfu/g) and C5 (5.79 log cfu/g), and for the thermophilic LAB (M17) in sample C8 (5.26 log cfu/g) and C11 (5.98 log cfu/g), which were lower. Statistical analysis showed that there were significant differences between Kačkavalj samples for both mesophilic and thermophilic LAB (p<0.05). The cell count indicates that as for chemical characteristics, cheese manufacture is differing in different Serbian regions. Likewise, some Kačkavalj cheeses were manufactured with starter culture, while some were traditionally made from raw milk. Determined cell count of mesophilic and thermophilic LAB is in accordance with previous research on Pirotski kačkavalj ( Danilovic et al., 2020; Mijacevic et al., 2005). In Pirotski Kačkavalj cheese, cell count of mesophilic and thermophilic LAB at the end of ripening was above 6 log cfu/g. Pappa et al. (2019) observed also a cell count of mesophilic and thermophilic LAB above 6 log cfu/g after 90 days of Kashkaval cheese ripening.
Table 4. Cell count of mesophilic and thermophilic LAB in Kačkavalj cheeses
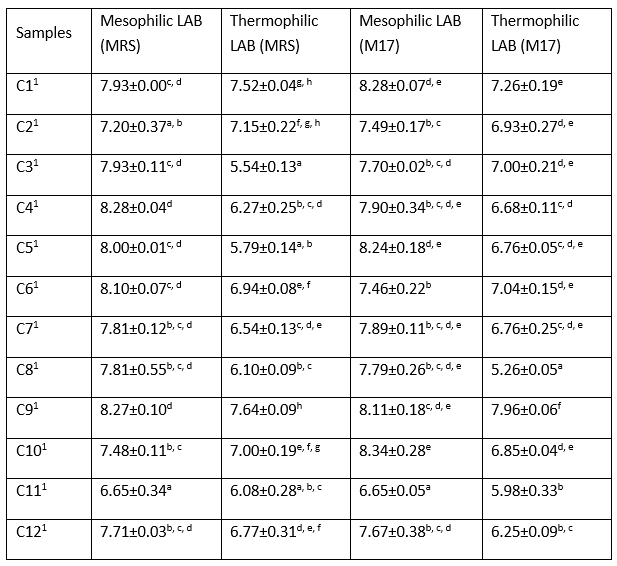
1Values are arithmetic mean ± standard deviation
Different superscript lowercase letters ( a-h) in the same column indicate significant differences (p<0.05)
Textural profile analysis
The TPA test is regularly conducted in order to imitate the actions during chewing (Dinkçi et al., 2011). The TPA parameters such as hardness, springiness, cohesiveness, chewiness and resilience of the analysed cheeses and their correlations with compositional parameters are presented in Table 5 and 6. The results indicated the wide range of values, from 827 to 5232 in terms of hardness which is the one of the main parameters of textural characteristics of cheese. Cheese samples C1 and C5 showed statistically significantly lower values than all other analysed cheese samples (p<0.05). This texture property is mostly result of moisture in non-fat dry matter as was shown with high negative correlation coefficient.
Table 5. Texture profile analysis of Kačkavalj cheeses
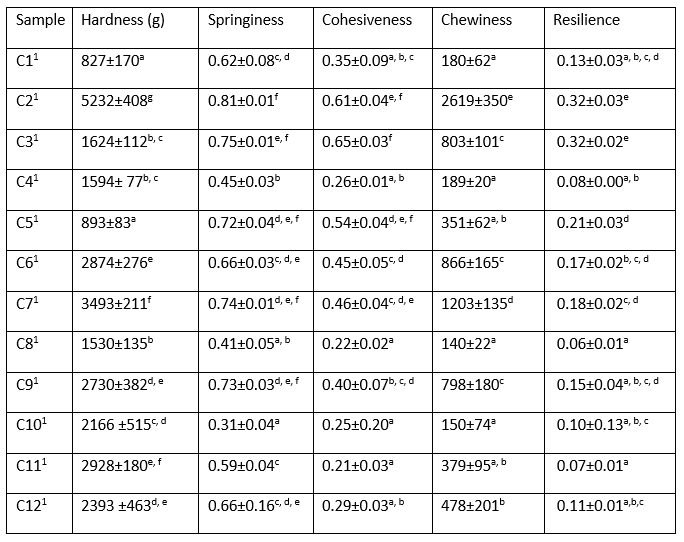
1Values are arithmetic mean ± standard deviation
Different superscript lowercase letters ( a-f) in the same column indicate significant differences (p<0.05)
Table 6. Correlations among texture profile analysis and some of chemical characteristics of Kačkavalj cheeses
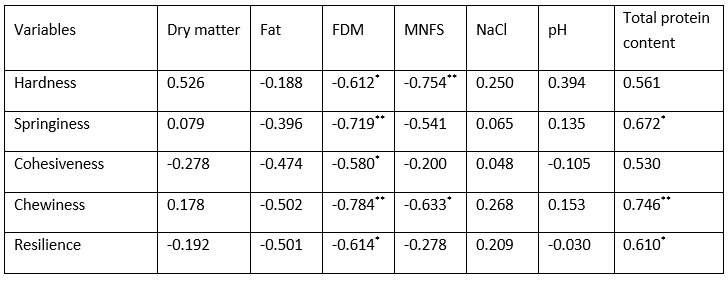
*Correlation is significant at the 0.05 level (2-tailed)
**Correlation is significant at the 0.01 level (2-tailed)
Regarding the correlation among texture profile analysis parameters and chemical properties, it is interesting that some significant correlations were found. Springiness of Kačkavalj cheeses were within wide interval from 0.31 to 0.81 and was negatively correlated to FDM (-0.719) and MNFS (-0.541). The values of springiness were notably lower than those (0.26-0.52) reported by Guinee et al. (2015) probably as a consequence of the lower degree of compression (25 %) in our study. Cohesiveness, chewiness and resilience were also negative correlated to FDM. It is interesting to note that traditional made Pirotski Kačkavalj (C10, C11 and C12 samples) was less cohesive than the most other. The positive correlation was found between total protein content and springiness, resilience (0.05 level) and chewiness (0.01 level). On the other hand, the negative correlation was noted between fat in dry matter content and all analyzed TPA parameters. Furthermore, negative correlation was also noted between moisture in non-fat substance and chewiness (0.05) and hardness (level 0.01). The parameters such as protein and moisture content are known to have significant effects on textural parameters (Eroglu et al., 2015).
Colour assessment
The colour assessment of the Kačkavalj cheeses was determined using a computer vision system. The L* value is the parameter which represents lightness from black (0) to white (100) of the cheeses and the higher L* means that product is brighter. Concerning this parameter, the results from our study showed that L* values were between 87.25 and 92.08 and there were no significant differences within all investigated cheeses (p<0.05). According to Dinkçi et al. (2011) the L* value varied from 85.38 to 87.25 during the ripening of Kashar cheese, which was slightly lower than the value interval from our study. However, the differences in L* values could be noted as the cheese maturation proceeds and results in the cheese becoming darker due to Maillard browning reaction that occurs during maturation ( Jo et al., 2018; Dinkçi et al., 2011). The colour variations can also be affected by many variables such as genetic and non-genetic factors (Milovanovic et al., 2020). The a* value represents the colour range from red (+) to green (-) and the b* value represents the colour range from yellow (+) to blue (-). Furthermore, there were significant differences (p<0.05) in both, the a* and b* values between cheese samples. The a* and b* values were in an interval from 0.00 to 0.92 and from 11.79 to 22.67, respectively. In another study, Eroglu et al. (2015) determined L*, a*, and b* values of Kashar that were between 63.90 and 79.03, -1.19 and 1.18, 7.04 and 21.44, respectively. These results were similar to the findings in our study, besides the L* values which were lower in our investigated cheese samples. The cheese samples variances in the composition, particularly fat content, could be the reason for the colour values variances (Eroglu et al., 2015).
Table 7. CIELAB colour coordinates (L*, a*, b*) of Kačkavalj cheese
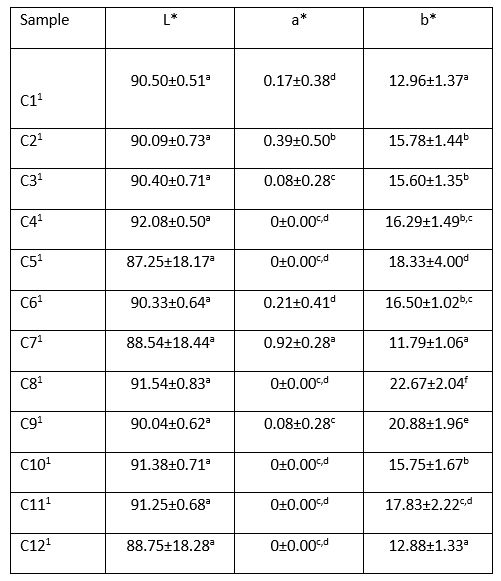
1Values are arithmetic mean ± standard deviation
Different superscript lowercase letters ( a-f) in the same column indicate significant differences (p<0.05)
Hierarchical cluster analysis (HCA)
The hierarchical cluster analysis ( HCA) of data obtained from all parameters of the Kačkavalj cheeses is presented in Figure 2. All investigated Kačkavalj cheeses are grouped into three clusters. Due to the applied data of all parameters obtained in this study it could be observed that the majority of cheese samples from one cluster belong to specific region. Especially the cheese samples number C10, C11 and C12 which are made in the same region of the municipality of Pirot and are clustered on the same position on the HCA dendrogram. Therefore, this indicates that the region of origin of raw material, the environment, as well as traditional cheese technology and manual kneading the curd by hand plays the important role in the final cheese properties.
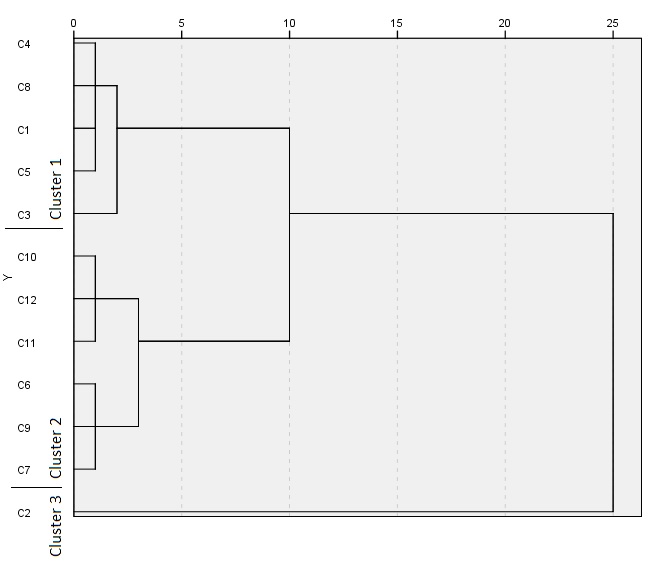
Figure 2. Dendrogram from HCA of data obtained from all parameters of the Kačkavalj cheeses
Conclusion
Based on the main cheese characteristics, the broad range of variations were found among 12 Serbian Kačkavalj cheeses. The composition of analysed Kačkavalj cheeses showed high variations which could be the result of variety of the: milk composition and quality, raw material, thermal processing methods, microbiota, cheese composition, conditions and time of the ripening. The colour assessment showed no high variations in the L* values within Kačkavalj cheeses, however they were noted in both, the a* and b* values. The differences concern all the analysed parameters: sensory, microbiological, chemical, texture and colour, suggesting a lack of quality standardization of this type of cheese, which is probably associated with processing differences as well as with ripening conditions and duration. The results also indicate that the term Kačkavalj is used although some of the investigated cheeses are not fully compliant with the National Standard for Quality Requirements (Institute for Standardization of Serbia, 1997). Therefore, the awareness of preventing of inadequate cheese labelling should be raised.
Acknowledgments
The authors thank the Ministry for Education, Science and Technological Development of the Republic of Serbia for funding this research.
Funding
Funding of this research was conducted through agreement 451-03-68/2022-14/200116 by Ministry for Education, Science and Technological Development of the Republic of Serbia.
Parametri kvalitete kačkavalj sira u tipu pasta filata iz Srbije i procjena usklađenosti sa zakonskim kriterijima
Sažetak
Svrha ove studije bila je ispitati kemijska i mikrobiološka svojstva, boju, teksturu i stupanj proteolitičkih promjena srpskog kačkavalj sira kako bi se utvrdio stupanj varijabilnosti između sireva, usporedila njihova svojstva s drugim sličnim sirevima parenog tijesta i utvrdilo jesu li u skladu sa zakonski postavljenim kriterijima za ovu vrstu sira. Utvrđen je širok raspon varijacija između ispitivanih svojstava kačkavalj sireva. Sastav je ukazao na velike varijacije u udjelu ukupne suhe tvari koji se kretao od 51,52 % do 58,71 %, udjela mliječne masti od 20,00 % do 29,50 % i udjela masti u suhoj tvari od 36,08 % do 55,96 %, udjela NaCl od 0,93 % do 3,69 % te udjela ukupnih proteina od 23,25 % do 30,79 %. Parametri proteolize u sirevima kačkavalj značajno su se razlikovali. Ispitivanja boje pokazala su značajne razlike u vrijednostima a* i b*, međutim u vrijednostima L* nije bilo značajnih razlika (p>0,05). Tradicionalni sir kačkavalj predstavlja dio nacionalne baštine pa je stoga provedena sveobuhvatna karakterizacija kako bi se istražile varijacije kvalitete između kačkavalj sireva iz Srbije. Prema rezultatima studije, izraz kačkavalj se koristi iako neki sirevi nisu u potpunosti usklađeni s Nacionalnim standardom. Potrebno je unaprijediti kontrolu ispunjavanja zahtjeva Nacionalnog standarda, kao i podizanje svijesti i prevenciju neadekvatnog deklariranja sira.
Ključneriječi: kačkavalj sir; usporedba karakteristika; proteoliza; mikrobiološka svojstva; usklađenost sa zakonskim kriterijima