
Introduction
Protein is the most expensive component of dairy animals' diet, so excessive feeding of crude protein can be expensive for producers and unprofitable for milk production. Increasing the crude protein concentration in dairy animals' diets can often increase milk production. However, the efficiency of using protein for milk production decreases when the amount of protein in the diet is increased. To maximize milk yield, farmers often feed dairy animals imbalanced diets regarding digestible protein and energy supply. This can result in protein intake exceeding recommendations or requirements. The consequences are negative effects on production efficiency (increased feeding costs) and milk processing characteristics (poorer milk coagulation properties), environmental pollution (increased nitrogen emissions to soil), and reduced fertility (Godden et al., 2001; Guo et al., 2004; Mellado et al., 2004; Biswajit et al., 2011).
Urea is a natural component of blood and other body fluids such as milk, saliva, urine, and gastric and intestinal juices. It is formed in the liver as the final metabolite of earlier microbial protein degradation in the rumen. Determination of MU concentration is used to monitor nutrition and adequacy of the protein content of the diet (Kampl and Stolla, 1995; Hristov et al., 2011; Hristov et al., 2015). In addition, MU concentration can also be used to monitor nitrogen excretion from the body, as the body attempts to remove excess nitrogen by synthesizing urea.
One of the relatively simple ways to determine a balanced ration for dairy animals is to determine the milk urea concentration. Urea concentration in cow's milk is determined by systematic control of milk yield in Croatia and is monitored regularly. Based on the available literature data, it was found that urea concentration in goat milk and the factors for its variability have not been sufficiently studied and the desired range of urea concentration in goat milk has not been established. Because of its importance in assessing the nutritional status and optimizing the ration of dairy goat breeds, its determination in goat milk is a necessity. Due to the numerous specific sources of variability, such as apocrine milk secretion, seasonal estrus, or different goat breeding systems, its optimal value is not easy to determine. Therefore, it is not surprising that relatively few data on the relationship between urea concentration and dairy goat production indicators can be found in the literature.
Urea concentration in urine, blood, and milk are closely related. It has been shown that urea concentration in milk is lower than in plasma and has a high correlation (Cabiddu et al., 1999; Bava et al., 2001), which is due to the free and easy diffusion of the urea molecule through the udder epithelium. Precisely because of the high correlation between values in blood and milk, easier availability, and less diurnal variation, the method of determining MU concentration is preferred over determination in blood (Cannas et al., 1998; Shephers and Meijer, 1998).
MU concentration is influenced by numerous environmental factors such as stage of lactation, parity, season, productivity, and milking time (Schepers and Meijer, 1998; Giaccone et al., 2007; Abdouli et al., 2008), but the most important factors affecting urea formation remain the amount of crude protein intake from the diet and the ratio of crude protein intake to energy, as well as the ratio of degradable and non-degradable proteins in the rumen (Marenjak et al., 2004; Bonanno et al., 2008).
Based on the results of urea concentration in goat milk, it is possible to correctly diagnose possible disorders that are primarily caused by inadequate feeding (ratio of available energy to protein in the diet, which negatively affects the production status of dairy cows, and excessive nitrogen release to the soil). In order to make such a test financially worthwhile and to avoid the negative biological effects of too low or too high urea concentration in goat milk, limit values should be established.
Therefore, the aim of this study was to determine the optimal protein content in the concentrate mix for Alpine goats, the most common dairy breed in Croatia, as well as the desired range of urea levels in goat milk from the point of view of its quality.
Materials and methods
Milk and feed samples
A total of 72 milk-producing alpine goats were included in the study, which was conducted on the family farm in Šemovci, Varaždin County. The goats selected for the study did not show any visible signs of clinical mastitis and were kept indoors throughout the year. The basic ration of the goats consisted of clover-grass mix hay and concentrate mix containing 12 % CP. After the separation of the kids from does mothers, a two-week period of adaptation to feeding treatments with a concentrate with different proportions of crude proteins began in such a way that experimental concentrate mix was gradually increased by 250 g/week. This was done in order to avoid the negative effect of a sudden change in the composition of the meal (a sudden increase in the proportion of CP in the mixture) on the metabolic processes in the rumen of goats. The goats consumed the concentrate mix in the milking parlour during morning and evening milking at a rate of 0.5 kg/meal, while the bulking portion of the diet was given ad libitum. After a two-week pre-treatment period during which all goats were fed a mix containing 12 % crude protein, they were randomly divided into three separate groups of similar size (24 animals each). The control group of goats (FM-16) received a concentrate mix with optimal crude protein content (16 %) according to The Nutrient requirements of goats (1981). The second group received a concentrate mix with 14 % crude protein (FM-14) and the third group received a concentrate mix with 18 % crude protein (FM-18). All three concentrate mixtures were isoenergetic. The study lasted from the 35th day of milking (after weaning of the kids) until dry-off (270-280th day of lactation).
The raw material composition of all concentrate mixtures was as follows: 30 % corn, 15 % wheat, 10 % barley, 6 % oats, and 39 % concentrate mix with varying percentages of crude protein (Table 1). The chemical composition of the feed is shown in Table 1.
Table 1. The chemical composition of goats feed
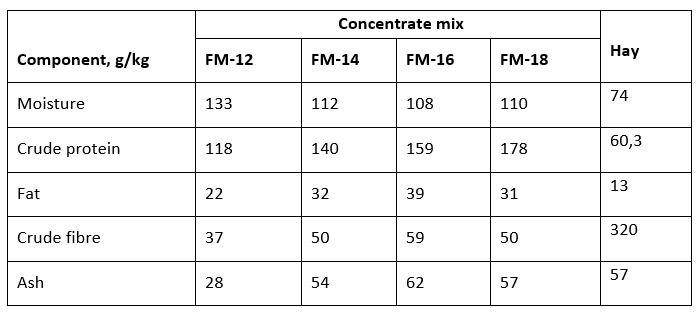
FM-12 = concentrate mix with 12 % crude protein fed to goats during the pre-treatment, the chemical composition represents the average of all three groups during the pre-treatment; FM-14 = concentrate mix with 14 % crude protein; FM-16 = concentrate mix with 16 % crude protein; FM-18 = concentrate mix with 18 % crude protein
Milk production of goats was controlled by the AT method (ICAR Recording Guidelines (2016) by manual milking. The average time interval between two consecutive controls was 30 days, with an allowable variation of 28-34 days. Milk sampling was performed once a month, and the milk yield of each goat was controlled by 7 or 8 controls (depending on the duration of lactation), or until the amount of milk per milking was not less than 200 mL. A total of 503 goat milk samples were collected.
During the pre-treatment period and before the start of the study, a milk sample from each udder half was placed in sterile test tubes with a volume of 10 mL for bacteriological examination. After the detected presence of pathogenic microorganisms, the goats were treated with antibiotics and the results were not included in the further analysis until the time of cure. The amount of milk milked per goat was determined by estimating the amount of milk measured with a measuring cup, which was converted to mass (kg) using the correction factor (1.030) for the density of goat milk prescribed in the Regulations for Determining the Composition of Raw Milk (2017).
Feed analysis
The percentage of dry matter, ash, crude protein (N x 6.25), crude fibre, and other ingredients was determined in the food samples after grinding to a size of 1 mm. Chemical composition analyses of the feed were performed before the beginning and at the end of the study. In the samples of concentrate mixtures and hay, the percentage of moisture was determined by the loss of mass during drying (HRN ISO 6496:2001), crude protein using the standard Kjeldahl method (HRN EN ISO 5983:2010), fat by the modified extraction method using the analyser ANKOM XT 15 (HRN ISO 6492:2001), crude fibres by the intermediate filtration method using the FOSS Fibre Cap analyser (HRN EN ISO 6865:2001) and crude ash by dry ashing method (HRN ISO 5984:2004).
Milk analysis
In the goat milk samples, the percentage of milk fat and protein was determined by the infrared spectrometry method on the Milkoscan FT 120 analyser (HRN ISO 9622:2001), total proteins by the Kjeldahl method on the Kjeltec 2300 analyser (HRN EN ISO 8968-1:2014), casein by the Kjeldahl method, on the Kjeltec 2300 analyser (HRN ISO 17997-2:2010), urea concentration according to the reference method of differential pH-meter on the CL -10 analyser, EFA 2000 - Hamilton, Bonaduz, Switzerland, the percentage of non-protein nitrogen according to the Kjeldahl method, on Kjeltec 2300 analyser (HRN EN ISO 8968-4:2016).
Statistical analyses
In order to determine the optimal level of crude protein in the concentrate mix, the obtained results were divided into 6 classes with an equal number of samples according to the determined MU concentration (≤30.00; 30.01-35.00; 35.01-40.00; 40.01-45.00; 45.01-50.00; >50 mg/100 mL). Statistical data processing was performed using the SAS V8 statistical package (SAS STAT, 2015). The collected data were analysed by applying the MIXED procedure, using a repeated measures model with crude protein content in the concentrate mix as the independent variable, while the following variables were included as dependent variables in the studied model: MU concentration, daily milk yield, percentage of milk fat, protein, casein, and non-protein nitrogen fractions. To calculate the correlation coefficients between the studied variables, the procedure CORR was used. To determine the dependence of a dependent variable on one or more independent variables, a regression model, i.e. the REG procedure, was used.
Results and discussion
The proportion of crude protein in the concentrate mix
Table 2 presents the least squares means of daily milk yield data and chemical analysis data of goat milk samples from each group of goats fed concentrate mixtures with varying protein content.
Table 2. Daily milk yield and changes in chemical composition of goat milk as a function of crude protein content in concentrate mix (LSM ± SE)
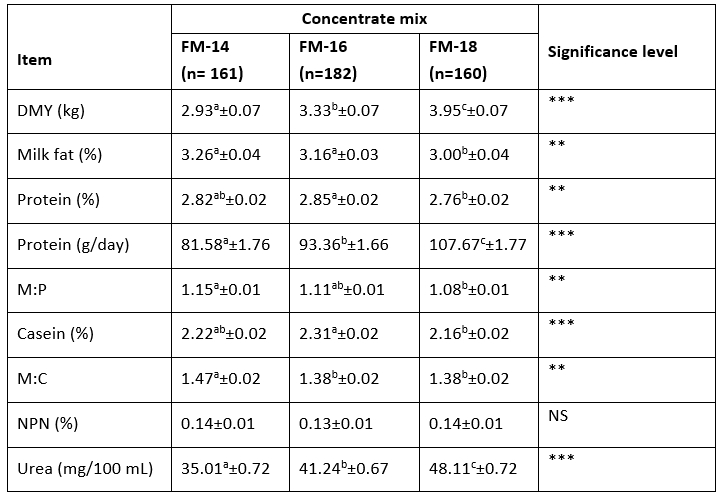
DMY = daily milk yield; M:P = milk fat and protein ratio; M:C = milk fat and casein ratio; NPN = non-protein nitrogen; LSM = least square mean; SE = standard error; a,b,c = average values in the same row marked with different letters significantly differ ** (p<0.01), *** (p<0.001); NS = non-significant; FM-14 = goats fed a concentrate mix with 14 % crude protein; FM-16 = goats fed concentrate mix with 16% crude protein; FM-18 = goats fed concentrate mix with 18 % crude protein
Increasing the protein level in the concentrate mix significantly increased daily milk yield, from 2.93 kg in the FM-14 group to 3.95 kg in the FM-18 % protein group (Table 2). A smaller difference in daily milk yield (≈400 g) was found between goats in the FM-14 and FM-16 groups. Similar results on increasing daily milk yield in goats by increasing the percentage of CP in the concentrate mix were obtained by Meng et al. (2016).
Information on milk urea concentration is particularly important for controlling protein contents in animal rations (Hristov et al., 2011; 2015). However, reduced protein intake can lead to changes in the proportions of individual milk components (Lee et al., 2012; Giallongo et al., 2015). Thus, feeding a higher proportion of CP in the concentrate mix resulted in a significant increase in MU concentration in this study (from 35.01 mg/100 mL in the FM-14 group to 48.11 mg/100 mL in the FM-18 group). In a similar study conducted on Sannen goats in Italy, where goats were fed 11.4 % CP and 17.8 % CP in the ration, the average MU concentration determined was 42.12 mg/100 mL and 49.61 mg/100 mL, respectively (Superchi et al., 2007). Conversely, in the extensive management system, increasing the crude protein content in the supplemental ration had no effect on increasing the milk urea concentration (Cabiddu et al., 1999; Bava et al. al, 2001; Todaro et al., 2005; Bonanno et al., 2008).
Bonanno et al. (2008) proposed the following equation to determine the optimal crude protein content in goat rations: % of CP in dry matter = 6.91 + 0.61 x MU concentration. The projection of the optimal proportion of CP in the ration was made by including the MU concentration of 28 to 32 mg/100 mL recommended by Brun-Bellut et al. (1991). According to these authors, the optimal amount of CP in goat diets is 18 to 19 %. However, Rapetti et al. (2009) consider that the urea concentration in goat milk is higher than that assumed by Bonanno et al. (2008), so they recommend a relatively high level of CP in the diet. Due to the fact that the actual urea concentration in goat milk is higher, the same authors consider that such protein content in the diet does not increase the production capacity. Moreover, they point out that in such cases there is inevitably an excessive excretion of nitrogen from the organism, which pollutes the environment.
Relationship between MU concentration, yield and chemical composition of goat milk
To determine the relationship between MU concentration and daily milk yield and chemical composition of milk, the collected goat milk samples were divided into 6 classes based on the determined MU concentration, which is shown in Table 3.
Table 3. Daily milk yield and chemical composition of milk as a function of MU concentration of Alpine goats (LSM ± SE)
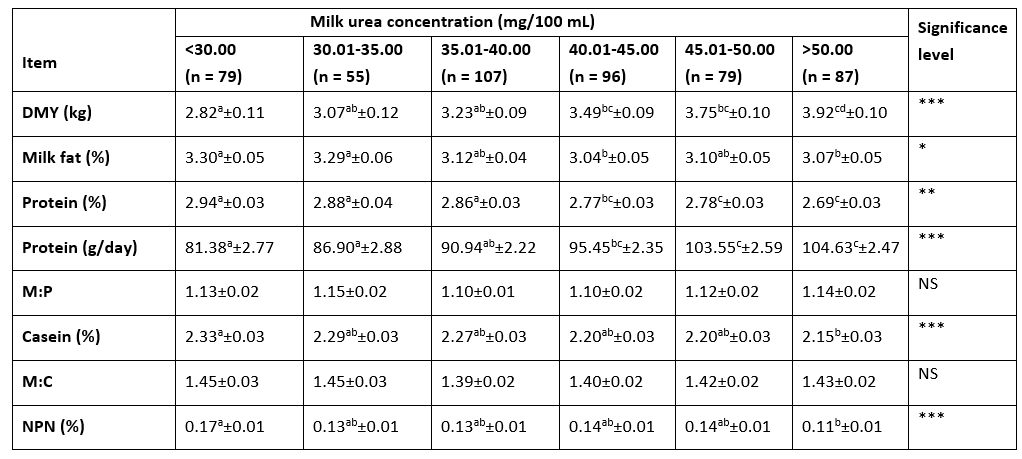
DMY = daily milk yield; M:P = milk fat and protein ratio; M:C = milk fat and casein ratio; NPN = non-protein nitrogen; LSM = least square mean; SE = standard error; a,b,c,d = average values in the same row marked with different letters significantly differ * (p<0.05), ** (p<0.01), *** (p<0.001); NS = non-significant
A significant relationship was found between MU concentration and daily milk yield and most indicators of milk chemical composition, M:P, and M:C ratios (Table 3). Significant (p<0.001) increase in daily milk yield, as well as daily protein yield, was found only at urea concentrations higher than 40 mg/100 mL. The lowest daily milk yield was obtained at urea concentration less than 30.00 mg/100 mL. Protein content gradually decreased at higher milk urea concentrations, and the significantly lowest value of protein content in milk was determined at a milk urea concentration of 50 mg/100 mL. A significant decrease in the percentage of milk fat and casein was found at a urea concentration higher than 40 mg/100 mL. The highest percentage of NPN was found at the lowest MU concentration (<30.00 mg/100 mL), i.e., the lowest percentage of NPN was found at a MU concentration higher than 50 mg/100 mL. At urea concentration < 30 mg/100 mL, the lowest daily milk yield (2.82 kg) and daily amount of protein produced (81.38 g) and the highest percentage of protein and casein were determined. Čobanović et al. (2019) conducted a similar study, but they divided the milk samples into 4 classes based on the MU concentration in the milk (I: 10-20 mg/100 mL; II: 20.01-30.00 mg/100 mL; III: 30.01-40.00 mg/100 mL; IV: > 40.00 mg/100 mL). In their research, they found that milk samples with MU concentration higher than 40 mg/100 mL had the highest percentage of protein and milk fat, but the lowest daily milk yield.
Table 4 shows the distribution of goat milk samples as a function of protein content and MU concentration
Table 4. Distribution of goat milk samples as a function of protein content and MU concentration
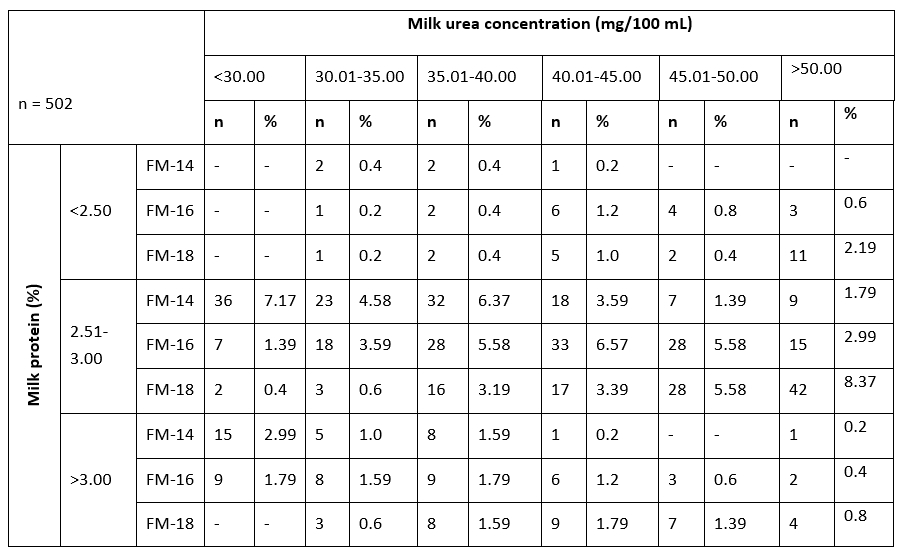
FM-14 = goats fed a concentrate mix with 14 % crude protein; FM-16 = goats fed concentrate mix with 16 % crude protein; FM-18 = goats fed concentrate mix with 18 % crude protein
MU concentrations in the range of 35 to 50 mg/100 mL and protein levels in the range of 2.5 to 3.0 % were found in 207 (41.24 %) of the milk samples tested. Of these, 27.54 % of the samples were from goats fed a concentrate mix containing 14 % CP, 43.00 % of the samples were from goats fed a mix containing 16 % CP, i.e. 29.46 % of the milk samples were from goats fed a concentrate mix containing 18 % CP.
Figure 1 shows the changes in daily milk yield and protein content in milk as a function of MU concentration according to classes specified in Table 3.
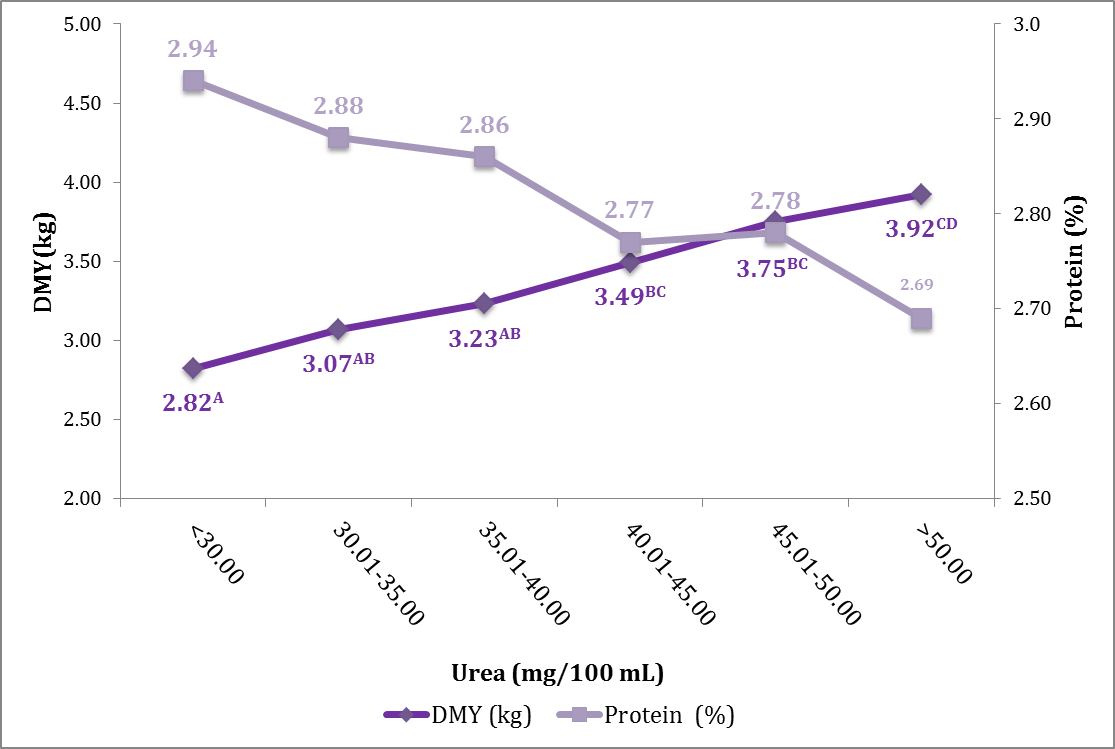
Figure 1. Correlation of MU concentration with daily milk yield and protein content in milk
In the fourth class, where the MU concentration ranged from 40.01 to 45.00 mg/100 mL, a statistically significant increase in daily milk yield and total protein was observed compared with the first three classes. However, the percentages of milk fat and protein were statistically significantly lower compared to the other classes (Figure 1). Based on the calculated inflection point of daily milk yield and milk protein content, it is very likely that the optimal MU concentration in Alpine goats is between 40.00 and 45.00 mg/100 mL and not higher than 45.00 mg/100 mL.
Assuming that the optimal amount of CP in goat concentrate mixtures can be determined based on the MU concentration, samples were divided into 6 classes and 9 subclasses. The division into 6 classes was based on MU concentration. The subclasses are determined based on the percentage of milk protein and the percentage of CP in the concentrate mix. The highest percentage (24.90 %) of goats whose milk had a urea concentration greater than 40.00 mg/100 mL were fed a concentrate mix containing 16 % CP. Slightly less (19.92 %) in the goats fed a concentrate mix containing 18 % CP. In other words, this means that increasing the CP content in the concentrate mix above 16 % had no significant effect on the increase in the production and chemical composition of milk. Moreover, MU concentration higher than 45 mg/100 mL increases the cost of goat milk production, decreases fertility, and interferes with metabolic processes in the body. Physiologically, an imbalanced diet in terms of energy and protein availability is the cause of the imbalance of the natural microbial population of the rumen. In fact, for the optimal functioning of the microorganisms in the rumen, an amount of nitrogen is required that ensures the lowest ammonia losses and the synthesis of amino acids necessary for the proper functioning of the organism. However, for the synthesis of microbial protein in goat feeding, energy is required in addition to protein. Thus, an excessive amount of protein and/or a lack of energy in the goat ration leads to excessive excretion of nitrogen in the milk or urine, and daily milk production does not increase (Olmos Colmenero and Broderick, 2006).
Table 5. Correlation coefficients between daily milk yield and chemical composition of goat milk
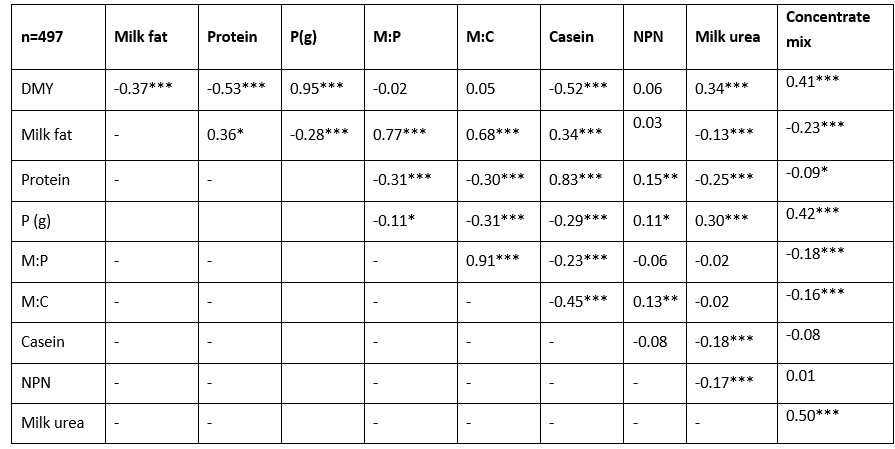
DMY = daily milk yield; P (g) = daily milk protein yield; M:P = milk fat and protein ratio; M:C = milk fat and casein ratio; NPN = non-protein nitrogen; Concentrate mix = crude protein level in concentrate mix; * (p<0.05), ** (p<0.01), *** (p<0.001)
In our study, a positive correlation coefficient (r = 0.50) was found between the MU concentration and the percentage of crude protein in the concentrate mix. However, notwithstanding the high correlation coefficient observed, only 25.09 % of the total variance (r = 0.2509) in MU concentration was explained by the proportion of CP in the concentrate mix. At the same time, non-nutritional factors explained 14.6 % of the total variability in MU concentration of Alpine goats. However, based on the results of Cannas et al. (1998) and Bonanno et al. (2008), who explained 56-65 % of the total variance of urea concentration in goat milk by the proportion of CP in the diet, it can be argued with high probability that urea concentration in goat milk is mainly determined by the proportion of CP in the diet.
A significant (p<0.001) positive correlation coefficient was found between milk urea concentration and daily milk yield (r = 0.34) as well as between milk urea concentration and the amount of protein produced (r = 0.30), which is also supported by the results of studies on goat milk (Todaro et al., 2005; Bonanno et al., 2008) or cow milk (Arunvipas et al., 2003; Johnson and Young, 2003; Rajala-Schultz and Saville, 2003; Jílek et al., 2006.).
Negative correlation coefficients (p<0.001) were found between MU concentration and protein content (r = -0.25), casein (r = -0.18), NPN (r = -0.17) and milk fat (r = -0.13). A relatively weak negative correlation was found between the percentage of CP in the concentrate mix and the percentage of protein in milk (r = -0.09; p<0.05). These results are in agreement with the results of Bava et al. (2001), but not with the results of Soryal et al. (2004). Indeed, Soryal et al. (2004) reported a positive effect of fortified feed on the percentage of protein and casein in goat milk. However, these data refer to the extensive rearing of goats by feeding on pasture. In this study, statistically significant negative correlation coefficients were found between daily milk yield and percentage of protein (r = -0.53) and casein in milk (r = -0.52). These results can be explained by the "dilution effect", in which the protein percentage increases with decreasing milk yield (Todaro et al., 2005).
Conclusions
Based on the results of this study, the following conclusions can be drawn: The optimal amount of CP in the concentrate mix for Alpine goats can be considered to be 16 %, at which the milk urea concentration is 40 mg/100 mL on average. MU concentration between 40 and 45 mg/100 mL is a good indicator of a balanced ration for Alpine goats and balanced microbial metabolic processes in the rumen, so there is the least variation in the daily amount, and chemical composition of milk. Feeding goats with concentrate mixtures containing more than 16 % CP increases the cost of goat milk production, and there is a high probability of decreasing fertility and disturbing metabolic processes in the rumen. In practice, MU concentration between 40 and 45 mg/100 mL can be used as an additional qualitative indicator for controlling the milk production of Alpine goats.
Acknowledgments
The authors would like to thank the owner of the family farm Kovačić for the implementation of the experimental part of the research.
Koncentracija uree u mlijeku kao alat za optimizaciju udjela sirovih proteina u obroku mliječnih koza: put do održive proizvodnje mlijeka
Sažetak
Koncentracija uree u mlijeku bila je predmetom mnogobrojnih istraživanja u svrhu procjene uravnoteženosti udjela energije i proteina u obrocima mliječnih krava, međutim ne u tolikoj mjeri u obrocima mliječnih koza. Cilj ovog istraživanja bio je utvrditi povezanost između koncentracije uree u mlijeku i udjela sirovih proteina (SP) u obroku Alpina koza kako bi se smanjilo prekomjerno izlučivanje dušika iz organizma. Istraživanje je provedeno u stadu od 72 koze koje su slučajnim odabirom podijeljene u tri jednake skupine (24 koza/skupini) od kojih je svaka hranjena krmnom smjesom (KS) s različitim udjelom SP: 14 %, 16 % i 18 %. Prikupljeni uzorci mlijeka poslužili su za utvrđivanje osnovnog kemijskog sastava nakon čega je uslijedilo izračunavanje omjera mliječne masti i proteina. Statistička analiza provedena je korištenjem procedure MIXED računalnog programa SAS V8. Koze hranjene KS sa 16 % SP dnevno su proizvele 0,4 kg mlijeka više (p<0,001) nego koze hranjene KS sa 14 % SP uz istovremeno višu koncentraciju uree u mlijeku; 41,24 mg/100 mL naspram 35,01 mg/100 mL (p<0.001). Na temelju izračunate točke preklapanja krivulja dnevne proizvodnje mlijeka i udjela proteina u mlijeku, optimalnim se smatra raspon koncentracije uree od 40,00 do 45,00 mg/100 mL mlijeka te predstavlja dobar pokazatelj uravnoteženog obroka mliječnih koza.
Ključne riječi: alpina koza; urea u mlijeku; optimalna vrijednost; kvaliteta mlijeka; sirovi protein