Skoči na glavni sadržaj

Izvorni znanstveni članak

https://doi.org/doi.org/10.32909/kg.20.35.2

Dvostruka percepcija izgleda bazena Jadranskoga mora na ranonovovjekovnim geografskim i pomorskim kartama

Tome Marelić ; Sveučilište u Zadru, Odjel za geografiju


Puni tekst: hrvatski pdf 1.423 Kb

str. 21-41

preuzimanja: 0

citiraj

Puni tekst: engleski pdf 1.423 Kb

str. 20-40

preuzimanja: 0

citiraj

Preuzmi JATS datoteku


Sažetak

Primjena kartografskih mreža na geografskim i pomorskim kartama, inicijalno razvijena u helenističkom razdoblju, bila je (ponovno otkriveni) novitet ranonovovjekovnim kartografima iz zapadne Europe. U istraživanju se nastojalo kvantitativnim putem ustanoviti točnost sfernih koordinata preuzetih s odabranih geografskih i pomorskih karata. Rezultati istraživanja upućuju na to da su kartografi koji su izrađivali geografske karte bili u velikoj mjeri oslonjeni na prostorne podatke Klaudija Ptolemeja, no da su uspjeli ostvariti određeni napredak po pitanju točnosti prikaza. Pomorske karte s kartografskom mrežom pokazuju značajno veću točnost prikaza geografskih dužina, što upućuje na to da su koristili druge izvore prostornih podataka kao grafičke predloške; vjerojatno portulanske karte koje su otprije postojale.

Ključne riječi

ranonovovjekovne geografske karte; ranonovovjekovne pomorske karte; točnost prikaza na kartama; Jadransko more

Hrčak ID:

303880

URI

https://hrcak.srce.hr/303880

Datum izdavanja:

28.4.2023.

Podaci na drugim jezicima: engleski

Posjeta: 392 *


Notes

[1] φ0 stands for the standard parallel

[2] Late medieval and early modern attempts to reconstruct the (lost) cartographic content of Geographike Hyphegesis.

[3] Throughout the majority of the manuscript, the terms geographical maps and nautical charts were simplified into maps and charts.

[4] When normal cylindrical projection is set with φ0=36° as standard parallel (“the Marinus of Tyre projection”), the parallels φ=36° (N and S) are plotted on a map true-to-scale with (all) meridians. Since their circumference is shorter than the circumference of meridians (with their antimeridians) by the factor of cos 36° = 0.809 (if Earth is approximated as a sphere), such map shows apparent longitudinal “compression” in comparison with plate carrée (the same projection, but with φ0=0°) in a way that the longitudinal equal-degree intervals are mapped shorter than their latitudinal counterparts by the factor of 0.809.

[5] Examples: Corcyra Melaena next to Curzola, Epidamaus and Dyrrachium next to Durazzo, Lissicus next to G.(olfo) del Drin, Diomedeae Insulae next to Isole de Tremiti, or Iapigium and Salentium next to Capo S Maria o d’Otranto.

[6] Maps and charts were georeferenced on a modern map of the Mediterranean (shapefile), downloaded from marineregions.org. (Claus et al. 2017).

[7] This method is, for example, the only possible way to georeference portolan charts that do not contain graticules. For additional information, see (Nicolai 2014, andMarelić 2022,2023b).

[8] Spherical corrections of the residuals [km] were obtained as: |dLON|[km]= ||[°] x 111.132 x cos (midLAT, and |dLAT|[km]= ||[°] x 111.092, in which the factor 111.092 [km] represents ∆lat at φ = 43°+-30' (the approximate central latitude of the Adriatic Sea) on the WGS84 ellipsoid, derived from the formulae: ∆lat = 1111132.954 - 559.882 x cos2φ + 1.175 x cos4φ. The midLAT stands for the mid-latitude between the reference point and its corresponding (georeferenced) identical point.

[9] The transcript of Ptolemy’s Book 2: Chapter 15 and Book 3: Chapter 1 and Chapter 12 (Stevenson 1991: 68, 72, 85), contains 82 locations for the Adriatic Sea area (43 were rejected).

[10] According to Ptolemy’s coordinates, the most northern location in the Adriatic Sea area is Alvona (Labin), φ=45.0°N, whose actual latitude (on WGS84) is φ=45.1°N. The actual latitude of Tergestrium (Trieste) – the most northern location in reality, with φ=45.6°N (located 0.6° norther than Alvona) – is, according to Ptolemy, φ=44.9°N (0.2° southern of Alvona).

[11] It is important to note here that the coordinate-dataset extracted from Stevenson’s translation of Ptolemy’s book is different from the dataset of 45 locations that were used for all the remaining analyses (compare locations inFigure 5 with locations inFigure 14).

[12] The root mean-squared error (RMSE) of their coordinates was computed by using the formulae: RMSE|dLON| = √(Σni=1=1i-~λi)2)/(n-1), RMSE|dLAT| = √(Σni=1=1i-~φi)2)/(n-1). The −1 is in the denominator because the longitude and latitude for each location were extracted and added to the dataset independently and because the selected dataset (of 45 points) does not constitute the entire amount of coordinates that could (possibly) be extracted.

[13] The majority of selected maps and charts are territory-wise limited to the extent of the Adriatic Sea basin. The E–W shift of longitudes (Δλ0) was computed and applied

[14] SeeFigure 14

[15] For example, Bellin’s nautical chart Carte de la Mer Méditerranée en Trois Feuilles (1745), was also made with the application of (non-conformal) normal equidistant cylindrical projection φ0=36°. For additional information, seeMarelić 2023b: 9, 12.

[16] Their longitudinal accuracy is expressed in the relative context (obtained upon “calibrating” them to the Greenwich prime meridian with the application of E–W shift Δλ0).

[17] One toise (fathom) was 1.949 metres in length (Treese 2018: 129).

[18] According to Picard, Earth’s equatorial circumference consists of 9,000 lieües de 25 au degré (Picard 1671: 23).

[19] Coronelli’s computed Miglia di Italia appears to be more similar to miglio of Naples of 1,846 m (Treese 2018: 145), than to miglio of Venice of 1,738.7 m (Meyers Konversations-Lexikon 1897: 80).

[20] Coronelli’s computed Leghe di Spagna seems to be closer to the Portuguese legoa of 6,173 m, than it is to the Spanish legua royal of 6,687 m (Treese 2018: 129, 167).

[21] The map scale on normal equidistant cylindrical projection is true along its standard parallel (φ0) and all meridians. In order to retain the rectangular shape of the map, i.e., the equal length of displayed parallels, those with latitudes greater that φ0 are, thus, plotted increasingly “stretched” (on a smaller scale), while parallels with latitudes lower than φ0 are plotted increasingly “compressed” (on a larger scale). For additional explanation see note 4 and (Snyder 1993: 5−8).

[1] φ0 predstavlja stiardnu paralelu

[2] Kasnosrednjovjekovne i ranonovovjekovne rekonstrukcije (izgubljenog) kartografskog sadržaja Geographike Hyphegesis.

[3] U većem dijelu rukopisa, sintagma geografska karta skraćena je u pojam karta, dok je sintagma pomorska karta zadržana.

[4] Kada je uspravna ekvidistantna cilindrična projekcija zadana s φ0=36° kao stiardnom paralelom („projekcija Marina iz Tira“), paralele φ=36° (S i J) se na karti preslikavaju u zadanom mjerilu karte zajedno sa (svim) meridijanima. Budući da je njihov opseg manji od opsega meridijana (zajedno s njihovim antimeridijanima) za faktor cos 36° = 0.809 (ako se Zemlja aproksimira kuglom), takva karta prikazuje prividnu „kompresiju“ prikaza geografske dužine u usporedbi s plate carrée (ista projekcija, no zadana s φ0=0°) tako da su stupanjski intervali geografske dužine prikazani kraći u odnosu na jednake stupanjske intervale geografske širine za faktor 0,809.

[5] Primjeri: Corcyra Melaena pored Curzola, Epidamaus i Dyrrachium pored Durazzo, Lissicus pored G.(olfo) del Drin, Diomedeae Insulae pored Isole de Tremiti, ili Iapigium i Salentium pored Capo S Maria o d’Otranto.

[6] Karte su georeferencirane na suvremenu kartu Sredozemlja (shp datoteka), preuzetu s marineregions.org (Claus i dr. 2017).

[7] Ta je metoda, primjerice, jedini mogući način za georeferenciranje portulanskih karata na kojima kartografska mreža nije ucrtana. Za dodatne informacije (Nicolai 2014, iMarelić 2022,2023b).

[8] Sferne korekcije reziduala [km] izvedene su s pomoću izraza: : |dLON|[km]= ||[°] x 111.132 x cos (midLAT, te |dLAT|[km]= ||[°] x 111.092, u kojem faktor 111,092 [km] predstavlja ∆lat pri φ = 43°+-30' (približna srednja geografska širina Jadranskog mora) na elipsodu WGS84, dobivena putem izraza: ∆lat = 1111132.954 - 559.882 x cos2φ + 1.175 x cos4φ. Oznaka midLAT predstavlja srednju geografsku širinu između referentne točke i pripadajuće joj (georeferencirane) identične točke.

[9] Transkript Ptolemejeve Knjige 2: Poglavlje 15 i Knjige 3: Poglavlje 1 i Poglavlje 12 (Stevenson 1991: 68, 72, 85),), sadrži 82 lokaliteta za prostor Jadranskog mora (43 su odbačena).

[10] Prema Ptolemejevim koordinatama, najsjevernija točka na Jadranskom moru je Alvona (Labin), φ=45,0°S, koja zapravo (na WGS84) iznosi φ=45,1°S. Stvarna geografska širina Trsta (Tergestrium) – najsjevernije točke u stvarnosti, s φ=45,6°S (smještena 0,6° sjevernije od Alvone) – je, prema Ptolemeju, φ=44,9°S (0,2° južnije od Alvone).

[11] Ovdje je važno napomenuti da se skup podataka o koordinatama koji je preuzet iz Stevensonovog prijevoda Ptolemejeve knjige razlikuje od skupa od 45 lokaliteta koji se koristio za sve preostale analize (usporediti lokalitete na slici 5 s lokalitetima naslikama 14).

[12] Srednja kvadratna pogreška (RMSE) očitanih koordinata je dobivena s pomoću izraza: RMSE|dLON| = √(Σni=1=1i-~λi)2)/(n-1), RMSE|dLAT| = √(Σni=1=1i-~φi)2)/(n-1).. Vrijednost −1 nalazi se u nazivniku zbog toga što su vrijednosti geografskih dužina i širina za svaki pojedini lokalitet preuzete nezavisno i zbog toga što skup od 45 lokaliteta ne predstavlja ukupnu količinu koordinata koju je (bilo) moguće preuzeti.

[13] Većina odabranih karata je ograničena na prikaz Jadranskoga mora. Longitudinalni pomak (Δλ0) izračunan je i primijenjen da bi se izgled prikaza prostora na njima “eksponirao” u relativnim iznosima, tj. neovisno o apsolutnoj nuli (koju se, u slučaju geografske dužine, arbitrarno određuje).

[14] Vidislike 14.

[15] Primjerice, Bellinova pomorska karta Carte de la Mer Méditerranée en Trois Feuilles (1745) je također izrađena u uspravnoj ekvidistantnoj cilindričnoj projekciji φ0=36° (koja nije konformna). Za više informacija, vidiMarelić 2023b: 9, 12..

[16] Točnost prikaza grografskih dužina na njima iskazana je u relativnim međuodnosima (dobivenim nakon njihove “kalibracije” na greeenwichki početni meridijan s pomoću pomaka Δλ0).

[17] Jedan toise (hvat) iznosi 1,949 metara (Treese 2018: 129).

[18] Prema Picardu, Zemljin opseg na ekvatoru iznosi 9000 lieües de 25 au degré (Picard 1671: 23).

[19] Coronellijeva izračunana Miglia di Italia je po iznosu bliža Napuljskoj milji od 1846 m (Treese 2018: 145) nego Venecijanskoj milji od 1738,7 m (Meyers Konversations-Lexikon 1897: 80).

[20] Coronellijeva izračunana Leghe di Spagna je po iznosu bliža portugalskoj ligi (legoa) od 6173 m, nego španjolskoj ligi (legua royal) od 6687 m (Treese 2018: 129, 167).

[21] Mjerilo karte u uspravnoj ekvidistantnoj cilindričnoj projekciji valjano je uzduž standardnih paralela φ0 i uzduž svih meridijana. Da bi se zadržao pravokutni izgled karte, tj. jednaka duljina svih prikazanih paralela, paralele koje imaju veću geografsku širinu od φ0 se, stoga, preslikavaju sve „istegnutijima“ (u krupnijem mjerilu) idući prema polovima, dok se paralele čija je geografska širina manja od φ0 preslikavaju sve više „komprimiranijima“ (u sitnijem mjerilu) idući prema ekvatoru. Za dodatna pojašnjenja, pogledati bilješku 4 i (Snyder 1993: 5−8).

References / Literatura


Baletti C, Gottardi C (2015) Analytical methods for the projective content of Coronelli’s central Europe maps. In: Arbore-Popescu G, Dabalà C (eds) The cartography of the Danube and the surrounding areas in and after the times of Vincenzo Maria Coronelli and Luigi Ferdinando Marsili. Corila,Venice, 23-33, 87-93.


Bayer C, Potůčková M, Čábelka M (2010) Cartometric Analysis of Old Maps on the Example of Vogt’s Map. In: Gartner G, Ortag F (eds) Cartography in Central and Eastern Europe. Springer, 509-524


Berggren JL, Jones A (2000) Ptolemy's Geography: an Annotated Translation of the Theoretical Chapters. Princeton University Press,Princeton and Oxford


Campbell T (1987) Portolan charts from the late thirteenth century to 1500. In: Harley JB, Woodward D (eds) The History of Cartography, Volume 1 – Cartography in Prehistoric, Ancient and Medieval Europe and the Mediterranean. University of Chicago Press,Chicago, 371-463


Claus S, De Hauwere N, Vanhoorne B, Souza Dias F, Oset García P, Schepers L, Hernandez F, Mees J (Flanders Marine Institute) (2017) (Flanders Marine Institute).MarineRegions.org


Gaspar JA , author. (2010) From the Portolan Chart of the Mediterranean to the Latitude Chart of the Atlantic: Cartometric Analysis and Modelling [doctoral dissertation], Universidade Nova de Lisboa, Lisbon.


Gautier Dalché P (1987) The Reception of Ptolemy’s Geography (End of the Fourteenth to Beginning of the Sixteenth Century). In: Woodward D (ed) The History of Cartography, Volume 3, Part 1 – Cartography in the European Renaissance. University of Chicago Press,Chicago, 285-364


Kagan RL, Schmidt B (2007) Maps and the Early Modern State: Official Cartography. In: Woodward D (ed) The History of Cartography, Volume 3, Part 1 – Cartography in the European Renaissance. University of Chicago Press,Chicago, 661-679


Keuning J (1955) The history of geographical map projections until 1600. Imago Mundi: The International Journal for the History of Cartography, 12, , 1-24. https://doi.org/doi:10.1080/03085695508592085


Livieratos E (2006) Graticule versus point positioning in Ptolemy cartographies. e-Perimetron, 1, 1, 51-59. https://doi.org/ISSN 1790-3769


Livieratos E, Tsorlini A, Boutoura C (2007) Coordinate analysis of Ptolemy’s Geographia Europe Tabula X with respect to geographic graticule and point positioning in a Ptolemaic late 15th century map. e-Perimetron, 2, 2, 80-91. https://doi.org/ISSN 1790-3769


Livieratos E, Tsorlini A, Boutoura C, Manoledakis m (2008) Ptolemy’s Geographia in digits. e-Perimetron, 3, 1, 22-39. https://doi.org/ISSN 1790-3769


Loomer SA , author. (1987) A Cartometric Analysis of Portolan Charts: A Search for Methodology [doctoral dissertation], The University of Wisconsin, Madison.


Marelić T , author. (2020) Točnost prikaza Jadranskog mora na portulanskim kartama [doctoral dissertation], Sveučilište u Zadru, Zadar.


Marelić T (2022) Conformal Cylindrical Properties of Adriatic Sea Basin Renderings on Portolan Charts. The Cartographic Journal, 59, 2, 83-101. https://doi.org/doi: 10.1080/00087041.2021.1956263


Marelić T (2023a) Certain arguments against the hypothesis that portolan charts were genuine late-medieval cartographic products. International Journal of Cartography (Online First paper, published on March 29th 2023), https://doi.org/doi: 10.1080/23729333.2022.2163146


Marelić T (2023b) Geometric stalemate and de-evolution of Adriatic Sea representations on early modern age nautical charts. The Cartographic Journal (Online First paper, published on May 11th 2023), 1-14. https://doi.org/doi: 10.1080/00087041.2023.2172533


Marx C (2011) On the precision of Ptolemy’s geographic coordinates in his Geographike Hyphegesis. History of Geo- and Space Sciences, 2, 1, 29-37. https://doi.org/doi: 10.5194/hgss-2-29-2011


Marx C (2012) Rectification of the ancient geographic coordinates in Ptolemy’s Geographike Hyphegesis. History of Geo- and Space Sciences, 3, 1, 99-112. https://doi.org/doi: 10.5194/hgss-3-99-2012


Marx C (2016) The western coast of Africa in Ptolemy’s Geography and the location of his prime meridian. History of Geo- and Space Sciences, 7, 1, 27-52. https://doi.org/doi: 10.5194/hgss-7-27-2016


(1897) Meyers Konversations-Lexikon , Vol. 12 (5. izdanje) . Bibliographisches Institut,Leipzig i Beč


Modenov PS, Parkhomenko AS (1965) Geometric Transformations (English translation Slater, MBP). Academic Press,New York, London


Nicolai R , author. (2014) A Critical Review of the Hypothesis of a Medieval Origin for Portolan Charts, [doctoral dissertation], Universiteit Utrecht, Utrecht.


Nicolai R (2015) The Premedieval Origin of Portolan Charts: New Geodetic Evidence. ISIS, 106, 3, 517-543. https://doi.org/doi: 10.1086/683532


Picard J , author. (1671) Mesure de la terre [par l'abbé Picard], Paris .


Snyder JP (1993) Flattening the Earth: Two Thousand Years of Map Projections. The University of Chicago Press,Chicago and London


Stevenson EL (1991) Claudius Ptolemy: The Geography. Dover Publications Inc.,New York


Treese SA (2018) History and Measurement of the Base and Derived Units. Springer International Publishing AG, https://doi.org/doi: 10.1007/978-3-319-77577-7_1


Triplat Horvat M , author. (2014) Kartografska analiza karata Papinske Države J. R. Boškovića i Ch. Mairea [doctoral dissertation] University of Zagreb, Faculty of Geodesy, Zagreb.


Tupikova I (2014) Ptolemy’s Circumference of the Earth, TOPOI – Towards a Historical Epistemology of Space. Max Planck Institute for the History of Sciences; Preprint: 464


Viličić M , author. (2019) Kartografska analiza karte Stjepana Glavača iz 1673. godine [doctoral dissertation] University of Zagreb, Faculty of Geodesy, Zagreb.


Wagner H (1896) The Origin of the Mediaeval Italian Nautical Charts, Report of the Sixth International Geographical Congress, London: Royal Geographical Society, 1896, 695−705, Reprinted in: Acta Cartographica, Vol. V/1969. Theartvm Orbis Terrarvm ltd.,Amsterdam 476-485.


Woodward D (1987) Medieval Mappaemundi. In: Harley JB, and Woodward D (eds) The History of Cartography, Volume 1 – Cartography in Prehistoric, Ancient and Medieval Europe and the Mediterranean. University of Chicago Press,Chicago, 286-370.


Woodward D (2007) Cartography and the Renaissance: Continuity and Change. In: Woodward, D (ed) The History of Cartography, Volume 3, Part 1 – Cartography in the European Renaissance. University of Chicago Press,Chicago, 3-24.


This display is generated from NISO JATS XML with jats-html.xsl. The XSLT engine is libxslt.


1 Introduction

One of the most critical events in the history of cartography that marked the Renaissance, was the Western European re-discovery of Claudius Ptolemy’s (circa 90-168 AD) Geographike Hyphegesis (Manual of geography, usually known simply as Geography) – a comprehensive and detailed artefact of Hellenistic geography and cartography – that had until then been in the possession of Byzantine scholars (Gautier Dalché 2007: 285–287). Two significant novelties introduced by that incidence were the (re)defining of the locations on Earth’s surface in spherical geometry, and the quantitative (re)approach to mapmaking by using mathematically defined map projections. His book contains instructions on how to construct the map projections he recommends for mapping the whole oikumene or its larger segments – “Ptolemy’s first projection” (normal equidistant conic projection φ0=36°)[1], and “Ptolemy’s second projection” (normal pseudoconic projection). Some of his larger-scale regional maps were also constructed by using normal equidistant cylindrical projection φ0=36°, attributed to Marinus of Tyre (first century AD), his predecessor and the source for the majority of the spatial data contained in Geographike Hyphegesis (Keuning 1955: 9−10, 13−16;Snyder 1993: 5-8, 10−14;Berggren and Jones 2000: 23−41;Marx 2011: 29). Such turn of events caused a paradigm shift in cartography in a way that it provided a “geometrization” of space (Kagan and Schmidt 2007: 663), and remained the fundamental aspect of mapmaking even to this day. Prior to the transfer of Ptolemy’s legacy into Western Europe, its cartographic production mainly consisted of mappaemundi, subjectively drawn maps of the known world, imbued with religious symbolism (Woodward 1987: 286−291), and portolan charts, the earliest known nautical charts which, as far as known, suddenly “emerged” in the late thirteenth century, and whose origins are still not fully understood (Campbell 1987: 380−384;Nicolai 2015: 538−543,Marelić 2023a: 20−21).

2 Related Cartometric Research

Although the cartometric analysis was initially introduced in the late nineteenth century by Hermann Wagner (Wagner 1896 (1969): 480), studies related to the history of cartography involving its application have begun to become more frequent in recent decades due to the development and increased availability of GIS software tools. The examples of extensive cartometric approach to nautical charts include doctoral studies made by Scott Allen Loomer (Loomer 1987) Joaquim Gaspar (Gaspar 2010), Roel Nicolai (Nicolai 2014) and Tome Marelić (Marelić 2020). Cartometric analyses of old geographical maps were, for example, performed by Tomáš Bayer with associates (Bayer et al. 2010), Marina Triplat Horvat (Triplat Horvat 2014) and Marina Viličić (Viličić 2019). A sole existing example of a cartometric approach to Vincenzo Maria Coronelli’s geographical maps (whose map of the Adriatic Sea, created in 1688, was selected for this research) is a study performed by Caterina Balletti and Caterina Gottardi. They claim that, according to their methodology, a definitive conclusion about which map projection could be assigned to his maps of Central Europe cannot be drawn (Baletti and Gottardi 2015: 31−33).

Sophisticated analyses of Claudius Ptolemy’s coordinates were performed by Evangelos Livieratos with associates (Livieratos 2006;Livieratos et al. 2007,2008), Christian Marx (Marx 2011;2012;2016), and Irina Tupikova (Tupikova 2014). Livieratos performed research in which he computationally compared the accuracy of geometric layouts represented on the old maps with the quantitative data extracted from their graticules. His conclusion is that two ptolemaic maps[2] of Crete he examined (one from the fourteenth, and one from the seventeenth century) geometrically correspond well to Ptolemy’s coordinates datasets he used for the research (Livieratos 2006: 58−59).

3 Scope and Methodology

The aim of the research is to determine the geometrical properties of the Adriatic Sea basin’s coastline renderings on selected graticule-equipped geographical maps and nautical charts produced in the early modern age (before the era of systematic geodetic and hydrographic surveys), according to their longitudinal and latitudinal data. The main research sample consists of three geographical maps and three nautical charts (Table 1).[3]

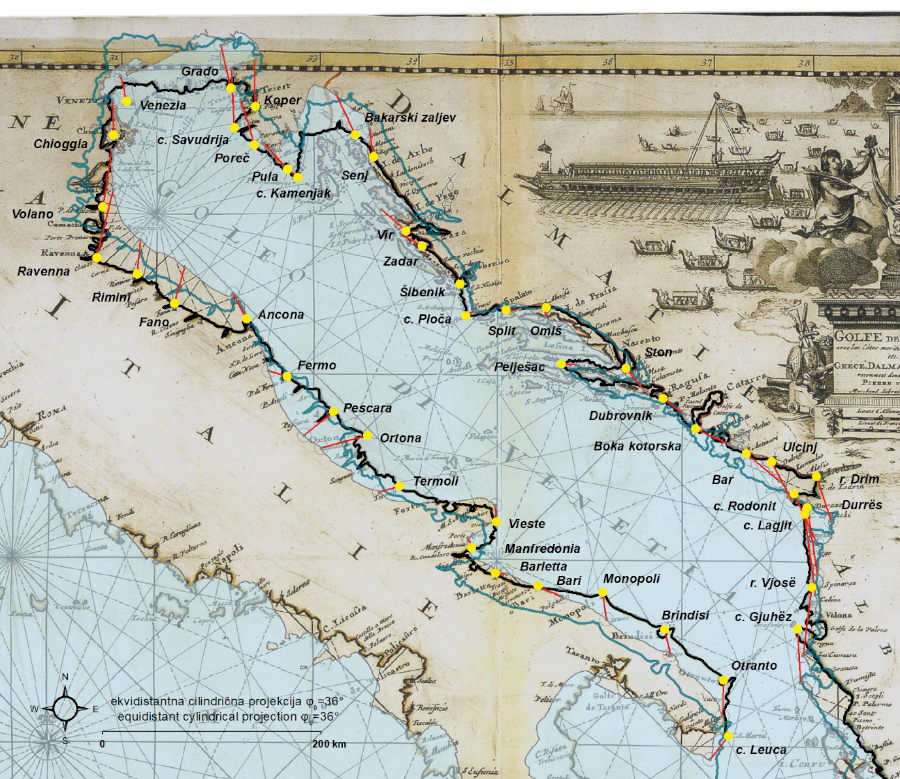
Giacomo Gastaldi’s Italiae Novissima Descriptio map (1570) is one of the earliest more detailed, and presumably more accurate early modern maps on which the Adriatic Sea and its surrounding areas are displayed. The dashes in its map frame, representing the degrees of longitude, appear to be slightly tilted and mirrored towards its central meridian, and those which represent the degrees of latitude are equally spaced, which indicates that it was intentionally made in a “Ptolemy’s first projection”. Pierre Duval’s Golfe de Venise map (1664) resembles the aesthetics of contemporary nautical charts to a certain extent, by containing a 16-point wind rose at its centre, a compass rose painted in its south-eastern part, and its spatial data focused on the coastline rendering (Figure 1), which suggests that he might have been influenced by nautical charts available at his disposal. However, even at the level of mere observation, it is noticeable that a map could not be used for navigational purposes. The first reason is its significant longitudinal “stretch”, which implies the usage of Ptolemy’s longitudinally inaccurate data on locations (Marx 2011: 36;2012: 100). The second reason is the geometry of its graticule – the LON/LAT (λ/φ) ratio of its equal-degree intervals is about 0.8, meaning that it was intentionally made in normal equidistant cylindrical projection φ0=36°, which is not conformal.[4] A similar graphical appearance of the Adriatic Sea, and an identical LON/LAT ratio of 0.8, exist on Vincenzo Maria Coronelli’s Golfo di Venezia map (1688). It also contains a wind rose, but its body of geographical data is (besides being substantially more detailed in comparison with Duval’s map) evenly distributed across its entire spatial extent (Figure 3). His map also contains several place names written in duplicates, with Hellenistic Greek names written near their Italian counterparts,[5] which implies that he, at least partly, relied on Ptolemy’s geographical data.

Table 1. Elementary information about the maps and charts selected as the research sample. The composite chart DUD_1646 consists of three sheets:Carta Particolare del mare Adriatico che comincia con il capo di Ancona è Finisce con L'Isola Lesina nello Isteso Mare (North Sdriatic; 708x492 mm), Carta Particolare del mare Mediterraneo che comincia con Ciuita vecchia è Finisce con il Capo S. Maria in Calabria (Central Adriatic; 755x498 mm) and Carta Particolare del mare Mediterraneo che comincia con Budua in Dalmatia è Finisce con Corfu nelo Stato Venetiano (South Adriatic; 386x519 mm). Since the Nort Adriatic sheet differs from the remaining two scale-wise, it was shrunk by 78,9% (along its both axes) to fit properly into the composite. / Tablica 1. Osnovne informacije o geografskim i pomorskim kartama upotrijebljenima u istraživanju.Kompozitna karta DUD_1646 sastavljena je od tri lista: Carta Particolare del mare Adriatico che comincia con il capo di Ancona è Finisce con L'Isola Lesina nello Isteso Mare (sjeverni Jadran; 708x492 mm), Carta Particolare del mare Mediterraneo che comincia con Ciuita vecchia è Finisce con il Capo S. Maria in Calabria (srednji Jadran; 755x498 mm) i Carta Particolare del mare Mediterraneo che comincia con Budua in Dalmatia è Finisce con Corfu nelo Stato Venetiano (južni Jadran; 386x519 mm). List s prikazom sjevernog Jadrana razlikuje se od preostala dva u mjerilu te je, u svrhu uklapanja u kompozit, umanjen na 78,9% (uzduž obje osi) svoje izvorne veličine.
kig-22-20-g7.jpg

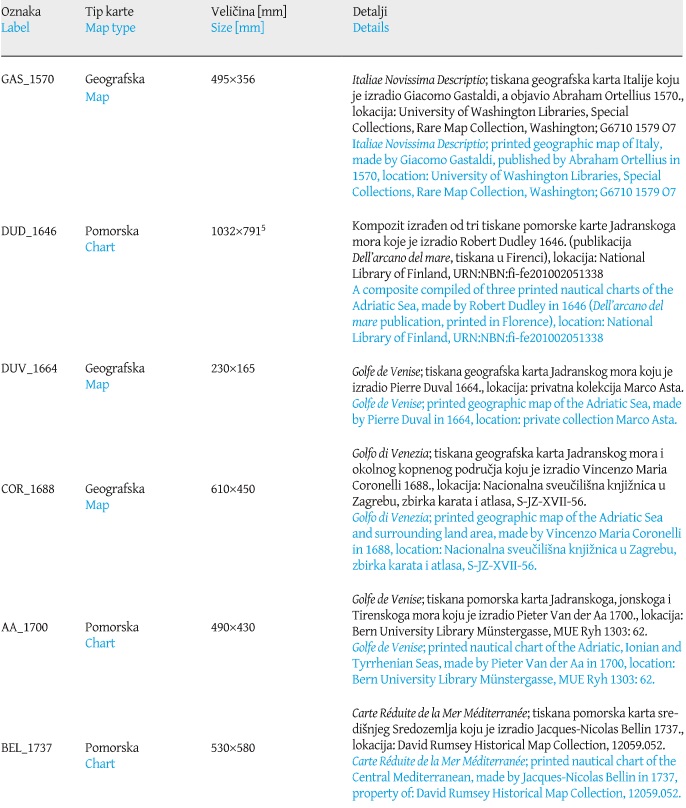
Figure 1. Residual vectors (red) of identical points (yellow) for Pierre Duval’s 1664 map, georeferenced by using the coordinates extracted from the map and with the application of its proprietary E–W shift (Δλ0). The thick black line represents its vectorized coastline, while the thick semi-transparent red line represents its vectorized coastline generated upon its geometrical best-fit. Map source: private collection Marco Asta. Basemap shapefile source: marineregions.org (Claus et al. 2017). / Slika 1. Vektori reziduala (crveno) identičnih točaka (žuto) na karti Pierra Duvala iz 1664., georeferenciranih upotrebom koordinata preuzetih s karte uz primjenu odgovarajućeg longitudinalnog pomaka (Δλ0). Široka crna linija predstavlja vektoriziranu obalnu crtu, dok široka poluprozirna crvena linija označava vektoriziranu obalnu crtu pri dodatnom georeferenciranju na temelju optimalnog geometrijskog podudaranja. Izvor karte: privatna kolekcija Marco Asta. Izvor pozadinskih shp datoteka: marineregions.org (Claus et al. 2017).
kig-22-20-g1.jpg

A sample of printed nautical charts – which were produced approximately during the same period as the selected maps and contain graticules as well – includes Robert Dudley’s three-sheet representation of the Adriatic Sea published in his book Dell’arcano del mare (1646), Pieter Van der Aa’s Golfe de Venise (1700), and Jacques-Nicolas Bellin’s Carte Réduite de la Mer Méditerranée (1737). Those three charts were already cartometrically examined to a certain extent (Marelić 2023b), but the accuracy of their spherical coordinates was not discussed in the wider context which also includes some other contemporary cartographic sources with graticules.

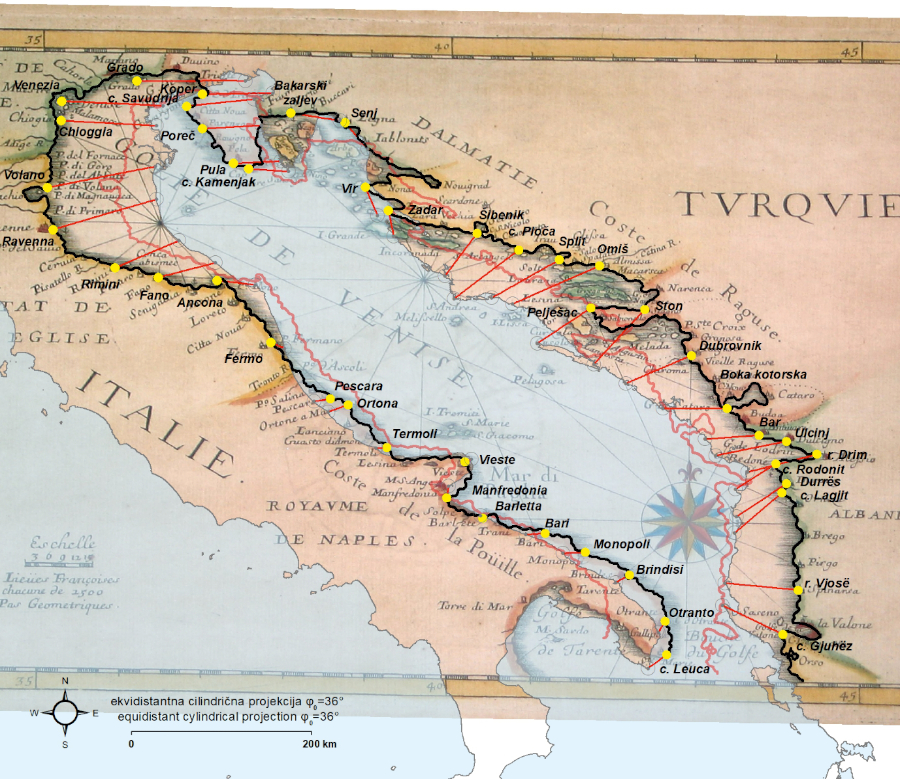
Figure 2. Residual vectors (red) of identical points (yellow) for Robert Dudley’s 1646 chart, georeferenced by using the coordinates extracted from the chart and with the application of its proprietary E–W shift (Δλ0). The thick black line represents its vectorized coastline, while the thick semi-transparent blue line represents its vectorized coastline generated upon its geometrical best-fit. Chart source: National Library of Finland. Basemap shapefile source: marineregions.org (Claus et al. 2017). / Slika 2. Vektori reziduala (crveno) identičnih točaka (žuto) na pomorskoj karti Roberta Dudleya iz 1464., georeferenciranih upotrebom koordinata preuzetih s karte uz primjenu odgovarajućeg longitudinalnog pomaka (Δλ0). Široka crna linija predstavlja vektoriziranu obalnu crtu, dok široka poluprozirna plava linija označava vektoriziranu obalnu crtu pri dodatnom georeferenciranju na temelju optimalnog geometrijskog podudaranja. Izvor karte: National Library of Finland. Izvor pozadinskih shp datoteka: marineregions.org (Claus et al. 2017).
kig-22-20-g2.jpg

In order to examine the accuracy of selected maps and charts, they were georeferenced (subjected to LSE; the least squares estimation of residuals) in QGIS, across a standardized sample of 45 identical points per unit (representing the same 45 locations in reality, seeFigure 14), and with the application of Helmert transformation (Modenov and Parkhomenko 1965: 77−93) to preserve their original geometry in relative terms. Since LSE is performed in Euclidean geometry and requires a map projection to be assigned to the reference dataset[6] in advance, three map projections were selected for the task: normal equidistant cylindrical projection φ0=36° (CYL36), normal equidistant conic projection φ0=36° (CON36) and Mercator projection φ0=36° (MERC36). The former two were selected due to the selected maps’ apparent resemblance with the Hellenistic cartographical approach, while the Mercator projection was selected because it appears to be the geometrical basis of late medieval and early modern manuscript (portolan) charts, as well as the majority of early modern printed nautical charts (Loomer 1987: 144−146;Nicolai 2014: 253, 387,Marelić 2022: 98−99,2023b: 5−7).

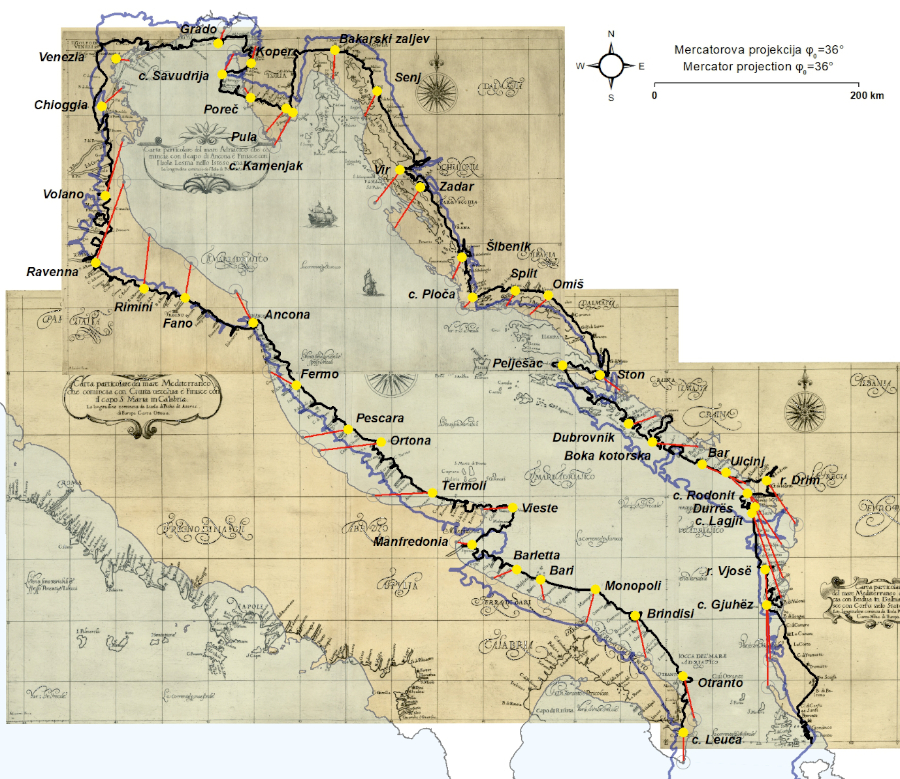
Figure 3. Residual vectors (red) of identical points (yellow) for Vincenzo Maria Coronelli’s 1688 map, georeferenced by using the coordinates extracted from the map and with the application of its proprietary E–W shift (Δλ0). The thick black line represents its vectorized coastline, while the thick semi-transparent purple line represents its vectorized coastline generated upon its geometrical best-fit. Map source: Nacionalna sveučilišna knjižnica u Zagrebu, Zbirka karata i atlasa, S-JZ-XVII-56. Basemap shapefile source: marineregions.org (Claus et al. 2017). / Slika 3. Vektori reziduala (crveno) identičnih točaka (žuto) na karti Vincenza Marie Coronellija iz 1688., georeferencirane upotrebom koordinata preuzetih s karte uz primjenu odgovarajućeg longitudinalnog pomaka (Δλ0). Široka crna linija predstavlja vektoriziranu obalnu crtu, dok široka poluprozirna ljubičasta linija označava vektoriziranu obalnu crtu pri dodatnom georeferenciranju na temelju optimalnog geometrijskog podudaranja. Izvor karte: Nacionalna sveučilišna knjižnica u Zagrebu, zbirka karata i atlasa, S-JZ-XVII-56. Izvor pozadinskih shp datoteka: marineregions.org (Claus et al. 2017).
kig-22-20-g3.jpg

The georeferencing of maps and charts was performed in two separate ways. The first, and merit-wise more significant for the research, is by using their proprietary LON and LAT values (manually extracted and plotted as GIS point-datasets) as “pseudo-reference points” and comparing them to their corresponding LON and LAT reference values on a WGS84 ellipsoid. The second way, in which the selected locations on charts and maps are used as identical points is purely geometric in nature and was conducted in order to determine the best-fit of their coastline renderings, regardless of the coordinates’ values assigned to them.[7] Since both scenarios yield their results in Euclidean geometry of (reference) map surface in scale 1:1 (determined by the parameters of its selected map projection), the displacements (residuals) of identical points need to be spherically corrected in addition in order to nullify their map projection-induced distortions, and their angular displacements (d |LON| [°], d| LAT| [°]) need to be transformed into geodesic distances on the WGS84 ellipsoid surface (d|LON| [km], d|LAT| [km]).[8]

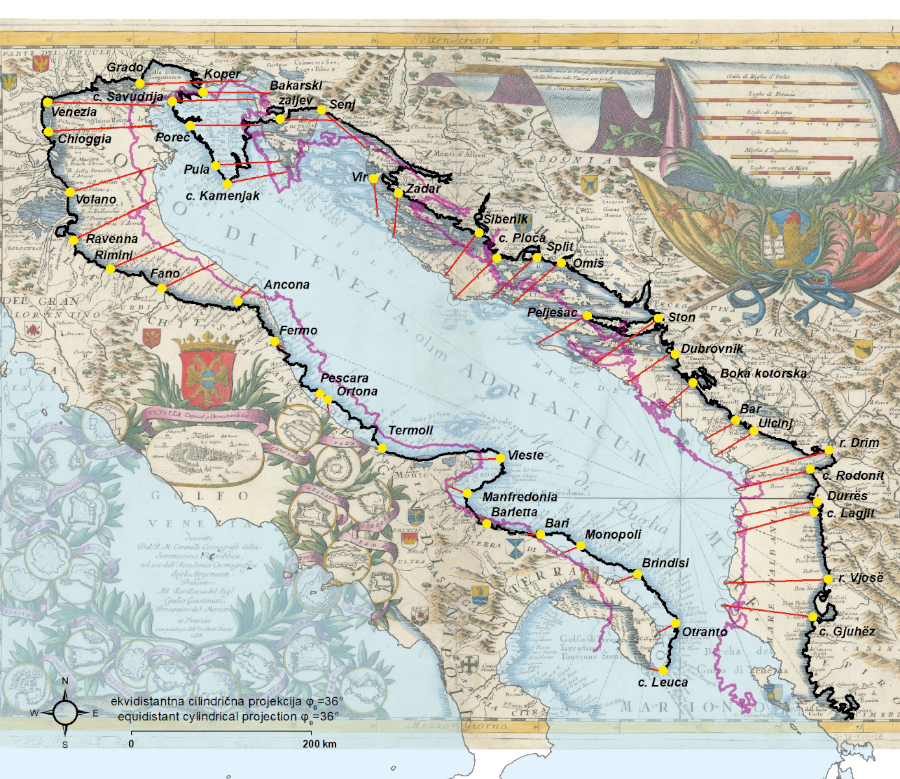
Figure 4. Residual vectors (red) of identical points (yellow) for Pieter Van der Aa’s 1700 chart, georeferenced by using the coordinates extracted from the chart and with the application of its proprietary E–W shift (Δλ0). The thick black line represents its vectorized coastline, while the thick semi-transparent blue line represents its vectorized coastline generated upon its geometrical best-fit. Chart source: Bern University Library Münstergasse, MUE Ryh 1303: 62. Basemap shapefile source: marineregions.org (Claus et al. 2017). / Slika 4. Vektori reziduala (crveno) identičnih točaka (žuto) na pomorskoj karti Pietra Van der Aa iz 1700., georeferenciranih upotrebom koordinata preuzetih s karte uz primjenu odgovarajućeg longitudinalnog pomaka (Δλ0). Široka crna linija predstavlja vektoriziranu obalnu crtu, dok široka poluprozirna plava linija označava vektoriziranu obalnu crtu pri dodatnom georeferenciras nju na temelju optimalnog geometrijskog podudaranja. Izvor karte: Bern University Library Münstergasse, MUE Ryh 1303: 62. Izvor pozadinskih shp datoteka: marineregions.org (Claus et al. 2017).
kig-22-20-g4.jpg

4 The Accuracy of Coordinates on Maps and Charts

The accuracy of spherical coordinates observed on maps and charts, and extracted as point datasets, was examined in three different analyses. The first analysis is the comparison of their proprietary longitudinal and latitudinal extents for the Adriatic Sea basin area to its corresponding extent on WGS84. The second analysis is an assessment of the accuracy of the map coordinates compared to a point-dataset extracted from the transcript of Ptolemy’s Geographike Hyphegesis (Stevenson 1991). To achieve this, 39 locations that showed higher identification reliability (Figure 5)[9] were pinpointed on maps (34 locations on GAS_1570, 32 on DUV_1664, and 38 on COR_1688 map), and extracted as point-datasets attributed with their proprietary LON and LAT values. The third analysis is the estimation of the accuracy of the coordinates extracted from maps and charts by comparing them to their reference counterparts, as well as to the “pseudo-coordinates” of their LSE-generated geometrical best-fit, obtained in parallel. In addition, certain possibilities for calculating map scale factors for longitude-wise poorly accurate map(s) are presented.

4.1 Differences in the Perceived Extent of the Adriatic Sea

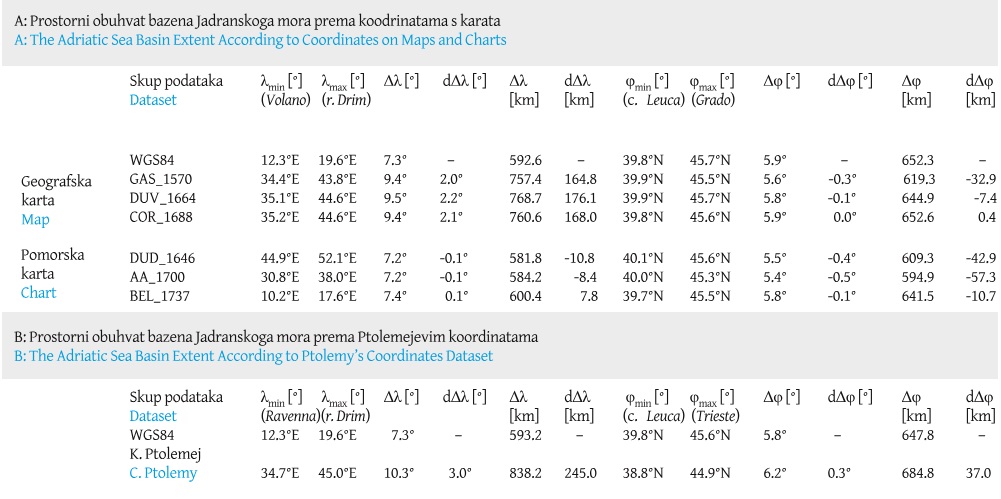
The reference extent of the Adriatic Sea basin on WGS84 was measured between its longitudinal and latitudinal endpoints (Table 2). The longitudinal extent error (dΔλ) of the Adriatic Sea on maps (+2.1°, or +169.6 km on average) is significantly greater than that on charts (a fraction of a degree, or only −3.8 km on average). On the other hand, the latitudinal extent error (dΔφ) on maps (being −0.1°, or −13.3 km on average), is smaller than that on charts (−0.3°, or −37.0 km on average). Its extent, according to Ptolemy’s data, and measured between its proprietary endpoints; the mouth of river Drim – Ravenna (E–W extent), and Trieste – cape Leuca (N–S extent)[10], is the most erroneous coordinates-dataset by far, especially longitude-wise.

Table 2. Adriatic Sea basin extent derived: A: according to its longitudinal and latitudinal endpoints extracted from and 45-point dataset of identical points used to georeference maps and charts, and B: according to Ptolemy’s coordinates dataset. / Tablica 2. Prostorni obuhvat bazena Jadranskoga mora dobiven: A: iz 45 točaka korištenih za georeferenciranje karata i B: prema Ptolemejevim koordinatama.
kig-22-20-g8.jpg

4.2 Comparison of Maps’ Coordinates with Ptolemy’s Data

The longitude values, with regards to their display on all three selected maps, seem to be very similar to one another, as well as to Ptolemy’s coordinates. For example, the longitude of Ravenna (λ=12.3°E on WGS84) is λ=34.7°E in Ptolemy’s dataset, λ=34.9°E on Gastaldi’s map (1570), λ=35.1°E on Duval’s (1664) map, λ=35.2°E on Coronelli’s (1688) map. Ptolemy’s dataset was (in order to perform the correction of its prime meridian) longitudinally (E–W) shifted by Δλ=−25.2°, which corresponds to the longitude of Santa Antão; the westernmost island of the Cape Verde archipelago – an adjustment which was previously applied by Marx in his quantitative analysis of Ptolemy’s coordinates for the Adriatic Sea basin (Marx 2012: 100). The same E–W shift (solely for the purpose of this analysis) was selected to longitude-wise adjust the coordinates of Ptolemy’s locations identified and pinpointed on each of the three maps (Figure 5) [11]

In comparison with WGS84, Ptolemy’s coordinates showed RMSE|dLON| accuracy of 1.7° (136.8 km), and RMSE|dLAT| accuracy of 0.6° (63.9 km).[12] In comparison with Ptolemy’s dataset, the geometric centres of Ptolemy’s locations on maps, computed and plotted as point-datasets, showed RMSE| dLON| of 1.7° (135.2 km), and RMSE|dLAT| of 0.8° (86.4 km), while in comparison with the reference WGS84 coordinates, their average results are RMSE| dLON| of 1.4° (111.2 km), and RMSE|dLAT| of 0.3° (35.3 km). Both the longitudinal and latitudinal accuracy of the map coordinates proved to be higher than those of Ptolemy. Also, map coordinates proved to be more similar to the reference data than to Ptolemy’s data, which suggests that certain progress in the spatial perception of selected place-locations on the Adriatic Sea basin’s coastline had occurred during the period of map production, or slightly earlier. Geometric centres of identical points on each of the three maps show that significant longitudinal corrections have been made for the northernmost part of the Adriatic Sea, while the southernmost subset of coordinates shows significant latitudinal corrections.

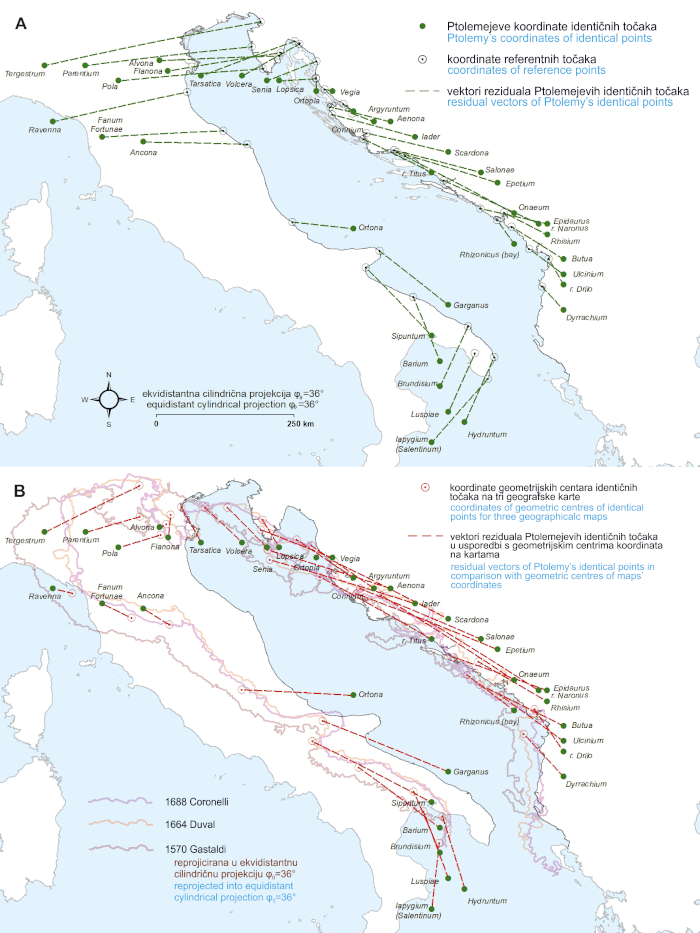
Figure 5. The displacement (residual) vectors of Claudius Ptolemy’s locations for the Adriatic Sea basin in comparison: A. with their modern reference counterparts, and B: with the geometric centres of coordinates on three maps (georeferenced by using the coordinates extracted from them). Each dataset is longitudinally shifted by Δλ0=−25.2°. Ptolemy’s coordinates-dataset source:Stevenson 1991. Basemap shapefile source: marineregions.org (Claus et al. 2017). / Slika 5. Vektori odmaka (reziduala) Ptolemejevih lokaliteta za bazen Jadranskoga mora u usporedbi: A: s njihovim referentnim vrijednostima i B: s geometrijskim centrima koordinata na tri geografske karte (georeferencirane na vrijednosti koordinata preuzetih izravno s karata). Svaki skup podataka je longitudinalno pomaknut za Δλ0=−25,2°. Izvor Ptolemejevih koordinata:Stevenson 1991. Izvor pozadinskih shp datoteka: marineregions.org (Claus et al. 2017).
kig-22-20-g5.jpg

4.3 Doubly Perceived Shape of the Adriatic Sea

The coordinates of selected 45 locations on each map and chart and plotted in GIS software as point-datasets, were compared to their corresponding reference values on WGS84 (Figure 14,Figure 6) in order to compute their RMSE|dLON| and RMSE|dLAT| values [km]. In order to minimize their prime meridian misalignments, an individual optimal E–W shift (Δλ0) for each map and chart was computed as the average of biased displacements between the longitudes extracted from it and the longitudes of their corresponding reference points.[13] In addition, each map and chart was compared to “pseudo-coordinates” of its LSE-generated identical points,[14] which are the product of two-dimensional conformal scale-wise and orientation-wise (θLSE) adjustment of each map and chart in order to achieve their geometric best-fit according to the shape of the Adriatic Sea basin as it is rendered on them (semi-transparent coastline renderings inFigure 14, section B inTable 3).

Table 3. Accuracy of coordinates extracted from charts and maps.The central meridian on Gastaldi's map is λ0=36°E. Its nearest identical point (out of 45) is Fano, so the reference projection (normal equidistant conic λ0=36°) to which its coordinates' data was compared was, thus, modified in a way that the reference longitude of Fano on WGS84 was selected as its central meridian (λ0=13,0°E, plotted as a vertical line) / Tablica 3. Točnost koordinata preuzetih s karataSrednji meridijan na Gastaldijevoj karti je λ0=36°I. Njemu najbliža identična točka (od 45) je Fano, pa je referentna projekcija (uspravna ekvidistantna konusna φ0=36°), s kojom su koordinate s karte uspoređene, modificirana tako da je referentna geografska dužina Fana na WGS84 odabrana kao srednji meridijan projekcije (λ0=13,0°I, prikazana kao vertikalna linija).
kig-22-20-g9.jpg

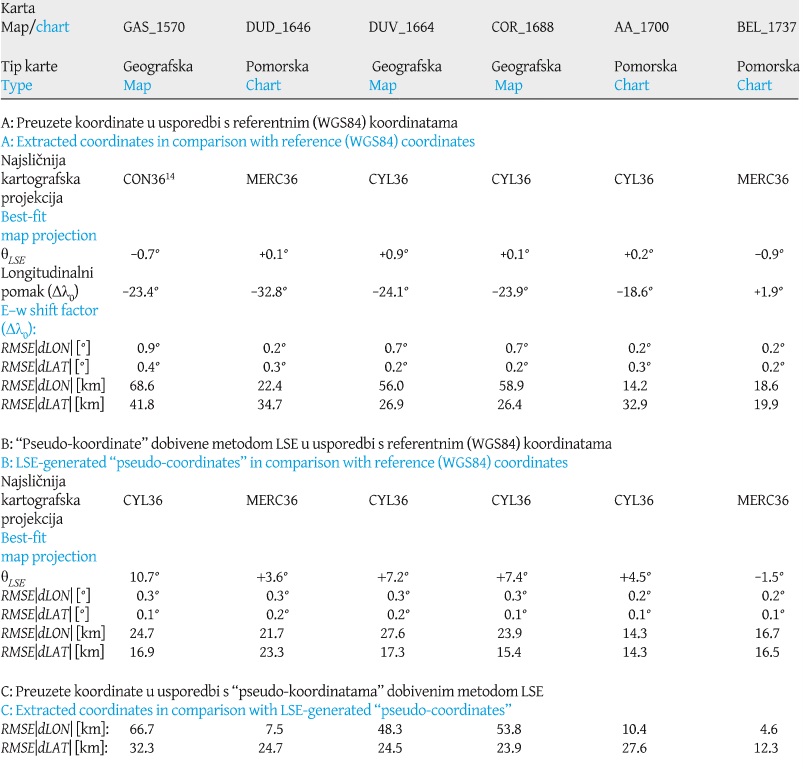
When selected maps and charts are georeferenced by using the coordinates extracted from them as “pseudo-reference points”– that is, the coordinates believed-to-be-true by their authors – each one’s best-fit map projection proved to be the map projection in which they were deliberately made; normal equidistant conic φ0=36° for Gastaldi’s map (1570), normal equidistant cylindrical φ0=36° for Duval’s (1664) and Coronelli’s (1688) map, as well as for Van der Aa’s (1700) chart, and Mercator projection for the charts made by Dudley (1646) and Bellin (1737) (section A inTable 3). Van der Aa’s decision to create a nautical chart by applying a map projection that is not conformal to it (thus lacking the property of potting loxodromes as straight lines, desired in navigation) is rather unusual, but it is not the sole incidence of such practice.[15] Also, their LSE-induced rotations (θLSE) obtained from this procedure are negligible. The longitudinal accuracy of maps’ coordinates (in comparison with the reference WGS84 dataset) is significantly low – their average RMSE|dLON| is 61.1 km – while their latitudinal accuracy is relatively high, with the average RMSE|dLAT| value of 31.7 km. The latitudinal accuracy of maps is similar to the latitudinal accuracy of charts’ coordinates, which is, on average 29.2 km, unlike their longitudinal accuracy which is, somewhat to a surprise, significantly high – 18.4 km on average, thus being 60% greater than their latitudinal accuracy.

The purely geometrical approach to the georeferencing of selected maps and charts (section B inTable 3) yields somewhat intriguing results. The “pseudo-coordinates” (hypothetical, and geometry-wise ideal coordinates, derived directly from the shape of their Adriatic Sea rendering) at which the identical points on selected charts “land” after the completion of their geometric-georeferencing are longitude-wise significantly similar to their believed-to-be-true values (with a difference of only 7.5 kilometres on average). On the other hand, the comparison of coordinates extracted from maps to their “pseudo-coordinates” reveals their average longitudinal “offset” of 56.3 kilometres (section C inTable 3). Also, the LSE-induced rotations of geometrically-georeferenced maps are significant; +7.2° for Duval’s map (1664), and +7.4° for Coronelli’s (1688) map, in comparison with +0.9° and 0.1°, respectively, obtained by georeferencing them with regards to their proprietary coordinates’ dataset (“pseudo-reference points”). The accuracy of coordinates on charts (in comparison with their reference WGS84 values) proved to be very similar to the accuracy of their coordinates obtained from the geometrical best-fit of their coastlines, predominantly because of their considerably high longitudinal accuracy. This immense similarity of the results yielded from two separate and distinctively different methodological approaches explicitly demonstrates that both the perceived shape of the Adriatic Sea basin, as well as the values of coordinates assigned to selected locations are significantly more accurate[16]in comparison with the corresponding features on maps (compare thick black vectorized coastlines with semi-transparent colour-coded coastlines inFigure 14 and section A, and B inFigure 6).

Figure 6. Vectorized coastlines of Adriatic Sea representations: A: on three maps, and B: on three charts, georeferenced by using the coordinates extracted from them, and with the application of their proprietary E – W shift (Δλ0). Basemap shapefile source: marineregions.org (Claus et al. 2017). / Slika 6. Vektorizirana obalna crta prikaza Jadranskog mora na: A. tri geografske karte i B. tri pomorske karte, georeferencirane na koordinate preuzete s njih uz primjenu odgovarajućeg longitudinalnog pomaka (Δλ0). Izvor pozadinskih shp datoteka: marineregions.org (Claus et al. 2017).
kig-22-20-g6.jpg

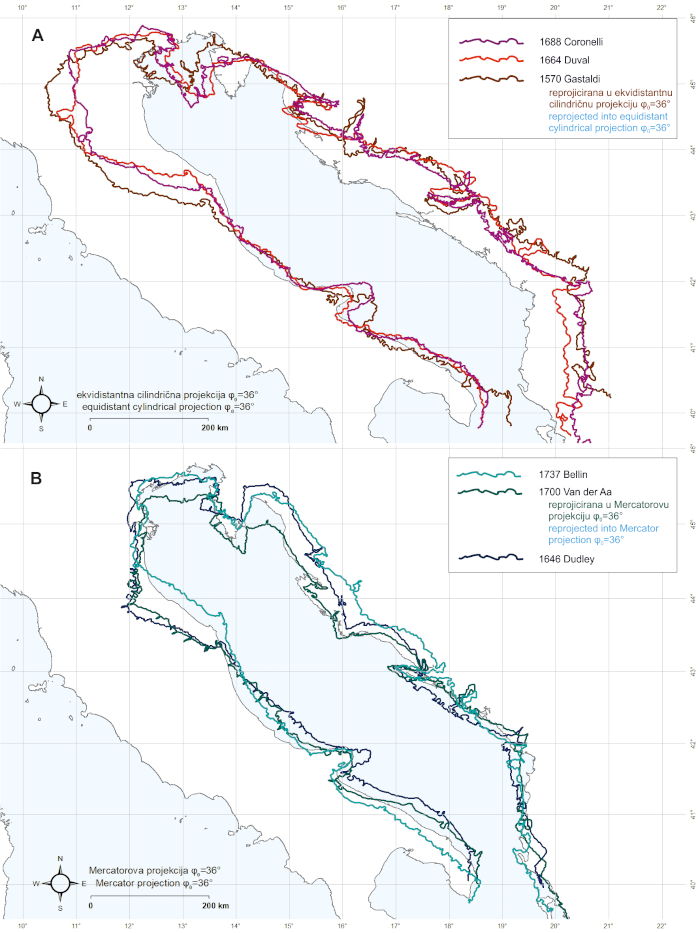
When the renderings of the Adriatic Sea basin’s coastline on selected maps are visually compared to its renderings on selected charts (displayed in the same map scale and aligned longitude-wise;Figure 6) it can be clearly observed that two rather different perceptions of its appearance existed in two separate “cartographic realms” in parallel. Simply put; if its actual shape, which shows rather a similar width along the majority of its geometric (NW–SE) axis, were imagined as a simplistic drawing of a (tilted) rectangle, then its shape – as it was perceived by the cartographers who created geographic maps – could be imagined as a “banana” or a “cucumber”. In a similar manner, its shape – as it was perceived by the authors of nautical charts – could be imagined as a (tilted) “funnel” (that widens towards the NW) – a “geometric footprint” which already existed on portolan charts (Marelić 2022: 95-96,2023b: 8-13).

4.4 Map Scale of Longitude-Wise Poorly Accurate Geographical Maps

Due to significant longitudinal errors on early modern maps, it is reasonable to discuss the possible ways of computing their map scale. Some methodological possibilities will be shown in the example of Coronelli’s (1688) map, which, despite its detailed geographic content, state-of-the-art aesthetics, and six scale-bars (each calibrated in its own unit of distance), shows significant longitudinal inaccuracy (Figure 3,Figure 6) and best geometric fit with normal equidistant cylindrical projection φ0=36°, whose standard parallel is located beyond its spatial extent.

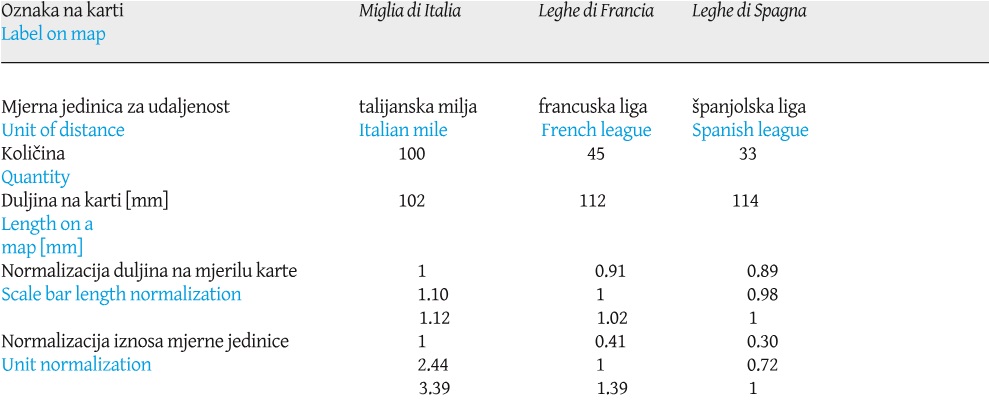
In order to compute its scale factor, the first step is to assume Coronelli’s perceived size of the Earth and the lengths of the distance units he used. Three scale bars on the COR_1688 map were considered for that matter: A: Miglia di Italia (Italian miles; 100 units, 102 mm in length), B: Leghe di Francia (French leagues; 45 units, 112 mm in length), and C: Leghe di Spagna (Spanish leagues; 33 units, 114 mm in length). Their unit-quantities ratio (100:45:33), corrected by their length-on-the-map ratio (102:112:114 mm) suggest, for example, that 1 Italian mile was (according to his map) equal to 0.41 French leagues and to 0.30 Spanish leagues (Table 4). If we assume that Coronelli used Earth’s equatorial circumference of 40,035,578.4 metres (20,541,600 toises),[17] calculated by the French astronomer and geodesist Jean Picard in 1669 (Picard 1671: 23), and that by Leghe di Francia he referred to Picard’s Lieüe de 25 au degré (25 leagues per degree) of 4,448 m (2,282 toises),[18] then the other two units should be of 1,823 m (Miglia di Italia),[19] and 6,182 m (Leghe di Spagna).[20] By the application of that criterion, 1 mm on his map scale bar corresponds to 0.17 km in reality, which yields a map scale of 1:1,787,725, or about 1:1,800,000 as its rounded value. However, neither the latitude of true scale nor his great longitudinal errors were considered to obtain this number.

Table 4. Computed interrelations between selected units of distance as represented on the scale bars of Coronelli’s map (1688). / Tablica 4. Izračunani međuodnosi između odabranih mjernih jedinica za udaljenost s obzirom na njihov prikaz na Coronellijevoj karti (1688).
kig-22-20-g10.jpg

If we assume that his map was believed by him to be error-free, and take into account its best geometric fit in comparison with the CYL36 projection, it means that its map scale is true along all meridians and (only) along the parallel φ=36° (which has a circumference of 32,389,463.3 m, according to Picard’s measurements, and is not displayed on the map), and that its longitudinal scale-factor errors increase with distance to the north (within the map’s extent). The mid-latitude of his map is 42°40'N (42.67°N, positioned 6.67° north of its latitude of true scale), with a circumference of 29,436,942.8 m (the perimeter of parallel φ=36° is 10% greater). This means that, if his scale bars were calibrated according to the circumference of parallel φ=36° then its longitudinal scale factor should be divided by a factor 1.10, which (for the Adriatic Sea mid-latitude) yields an “actual” longitudinal scale along its mid-parallel of 1:1,625,204[21] (1:1,625,000 as its rounded value), while its latitudinal scale remains the same.

If, additionally, we take into account his errors of the Adriatic Sea’s longitudinal extent of +2.36° (32.2% greater than its extent in reality), of which he most likely was not aware, this means that the longitudinal scale factor (which has already been divided by 1.10) should be additionally divided by 1.32, which yields an “actual” longitudinal map scale along its mid-parallel of 1:1,209,229 (1:1,210,000 as its rounded value). If we assume that Coronelli had not tailored his scale bars in accordance with φ=36° as its latitude of true scale (because it is not its mid-latitude), then its longitudinal scale factor should be divided by 1.32 exclusively, which yields a rounded longitudinal scale along its mid-parallel of 1:1,354,337 (1:1,355,000 as its rounded value). His latitudinal extent error is negligible (only 0.0012°) and was thus not considered in any of these computations. Whatever particular value should be used to describe his map scale is arbitrary; these paragraphs serve mainly to emphasize the parameters which may affect its determination and as a methodology proposal on how to determine the map scale of (poorly accurate) old maps according to these criteria. >

5 Conclusions

The implementation of graticules on maps and charts, although it actually was a rediscovery of methodology that was already developed in the Hellenistic period, was a novelty to Western European cartographers of the early modern age. Research results showed that at the time of reinvention of the “graticule-equipped cartography”, two parallel paths of cartographic renderings (of the Adriatic Sea basin) existed simultaneously. The cartographers who created the geographical maps relied significantly on the preserved geographic opus of Claudius Ptolemy, while those who were producing the nautical charts seemed to be mainly inspired by the geometry of portolan charts. Both of those two “spatial layout matrices” were already in existence at the time, and since these maps and charts were made before the era of systematic geodetic and hydrographic surveys, their authors were constrained with the inherited materials at their disposal, supplemented with trial-and-error attempts to “enhance the image of the world”.

Although the examined maps showed considerable geometric improvements in comparison with Ptolemy’s geographical data, the values of longitudes assigned to their locations were still significantly less accurate than those on nautical charts. The methodology of this research cannot detect or explain the cause-and-effect order of those improvements – perhaps their authors were comparing Ptolemy’s longitudinally overexaggerated data with longitude-wise more ‘compact’ extents displayed on portolan charts and sought to create their “optimal graphic blend”. Whichever course of action had happened, and in order to avoid speculative assumptions, additional research should be conducted on that matter.

Acknowledgements

This research is a part of scientific project IP-2020-02-5339 Early Modern Nautical Charts of the Adriatic Sea: Information Sources, Navigation Means and Communication Media (NACHAS) funded by the Croatian Science Foundation.

Notes

[1] φ0 stands for the standard parallel

[2] Late medieval and early modern attempts to reconstruct the (lost) cartographic content of Geographike Hyphegesis.

[3] Throughout the majority of the manuscript, the terms geographical maps and nautical charts were simplified into maps and charts.

[4] When normal cylindrical projection is set with φ0=36° as standard parallel (“the Marinus of Tyre projection”), the parallels φ=36° (N and S) are plotted on a map true-to-scale with (all) meridians. Since their circumference is shorter than the circumference of meridians (with their antimeridians) by the factor of cos 36° = 0.809 (if Earth is approximated as a sphere), such map shows apparent longitudinal “compression” in comparison with plate carrée (the same projection, but with φ0=0°) in a way that the longitudinal equal-degree intervals are mapped shorter than their latitudinal counterparts by the factor of 0.809.

[5] Examples: Corcyra Melaena next to Curzola, Epidamaus and Dyrrachium next to Durazzo, Lissicus next to G.(olfo) del Drin, Diomedeae Insulae next to Isole de Tremiti, or Iapigium and Salentium next to Capo S Maria o d’Otranto.

[6] Maps and charts were georeferenced on a modern map of the Mediterranean (shapefile), downloaded from marineregions.org. (Claus et al. 2017).

[7] This method is, for example, the only possible way to georeference portolan charts that do not contain graticules. For additional information, see (Nicolai 2014, andMarelić 2022,2023b).

[8] Spherical corrections of the residuals [km] were obtained as: |dLON|[km]= ||[°] x 111.132 x cos (midLAT, and |dLAT|[km]= ||[°] x 111.092, in which the factor 111.092 [km] represents ∆lat at φ = 43°+-30' (the approximate central latitude of the Adriatic Sea) on the WGS84 ellipsoid, derived from the formulae: ∆lat = 1111132.954 - 559.882 x cos2φ + 1.175 x cos4φ. The midLAT stands for the mid-latitude between the reference point and its corresponding (georeferenced) identical point.

[9] The transcript of Ptolemy’s Book 2: Chapter 15 and Book 3: Chapter 1 and Chapter 12 (Stevenson 1991: 68, 72, 85), contains 82 locations for the Adriatic Sea area (43 were rejected).

[10] According to Ptolemy’s coordinates, the most northern location in the Adriatic Sea area is Alvona (Labin), φ=45.0°N, whose actual latitude (on WGS84) is φ=45.1°N. The actual latitude of Tergestrium (Trieste) – the most northern location in reality, with φ=45.6°N (located 0.6° norther than Alvona) – is, according to Ptolemy, φ=44.9°N (0.2° southern of Alvona).

[11] It is important to note here that the coordinate-dataset extracted from Stevenson’s translation of Ptolemy’s book is different from the dataset of 45 locations that were used for all the remaining analyses (compare locations inFigure 5 with locations inFigure 14).

[12] The root mean-squared error (RMSE) of their coordinates was computed by using the formulae: RMSE|dLON| = √(Σni=1=1i-~λi)2)/(n-1), RMSE|dLAT| = √(Σni=1=1i-~φi)2)/(n-1). The −1 is in the denominator because the longitude and latitude for each location were extracted and added to the dataset independently and because the selected dataset (of 45 points) does not constitute the entire amount of coordinates that could (possibly) be extracted.

[13] The majority of selected maps and charts are territory-wise limited to the extent of the Adriatic Sea basin. The E–W shift of longitudes (Δλ0) was computed and applied

[14] SeeFigure 14

[15] For example, Bellin’s nautical chart Carte de la Mer Méditerranée en Trois Feuilles (1745), was also made with the application of (non-conformal) normal equidistant cylindrical projection φ0=36°. For additional information, seeMarelić 2023b: 9, 12.

[16] Their longitudinal accuracy is expressed in the relative context (obtained upon “calibrating” them to the Greenwich prime meridian with the application of E–W shift Δλ0).

[17] One toise (fathom) was 1.949 metres in length (Treese 2018: 129).

[18] According to Picard, Earth’s equatorial circumference consists of 9,000 lieües de 25 au degré (Picard 1671: 23).

[19] Coronelli’s computed Miglia di Italia appears to be more similar to miglio of Naples of 1,846 m (Treese 2018: 145), than to miglio of Venice of 1,738.7 m (Meyers Konversations-Lexikon 1897: 80).

[20] Coronelli’s computed Leghe di Spagna seems to be closer to the Portuguese legoa of 6,173 m, than it is to the Spanish legua royal of 6,687 m (Treese 2018: 129, 167).

[21] The map scale on normal equidistant cylindrical projection is true along its standard parallel (φ0) and all meridians. In order to retain the rectangular shape of the map, i.e., the equal length of displayed parallels, those with latitudes greater that φ0 are, thus, plotted increasingly “stretched” (on a smaller scale), while parallels with latitudes lower than φ0 are plotted increasingly “compressed” (on a larger scale). For additional explanation see note 4 and (Snyder 1993: 5−8).

[1] φ0 predstavlja stiardnu paralelu

[2] Kasnosrednjovjekovne i ranonovovjekovne rekonstrukcije (izgubljenog) kartografskog sadržaja Geographike Hyphegesis.

[3] U većem dijelu rukopisa, sintagma geografska karta skraćena je u pojam karta, dok je sintagma pomorska karta zadržana.

[4] Kada je uspravna ekvidistantna cilindrična projekcija zadana s φ0=36° kao stiardnom paralelom („projekcija Marina iz Tira“), paralele φ=36° (S i J) se na karti preslikavaju u zadanom mjerilu karte zajedno sa (svim) meridijanima. Budući da je njihov opseg manji od opsega meridijana (zajedno s njihovim antimeridijanima) za faktor cos 36° = 0.809 (ako se Zemlja aproksimira kuglom), takva karta prikazuje prividnu „kompresiju“ prikaza geografske dužine u usporedbi s plate carrée (ista projekcija, no zadana s φ0=0°) tako da su stupanjski intervali geografske dužine prikazani kraći u odnosu na jednake stupanjske intervale geografske širine za faktor 0,809.

[5] Primjeri: Corcyra Melaena pored Curzola, Epidamaus i Dyrrachium pored Durazzo, Lissicus pored G.(olfo) del Drin, Diomedeae Insulae pored Isole de Tremiti, ili Iapigium i Salentium pored Capo S Maria o d’Otranto.

[6] Karte su georeferencirane na suvremenu kartu Sredozemlja (shp datoteka), preuzetu s marineregions.org (Claus i dr. 2017).

[7] Ta je metoda, primjerice, jedini mogući način za georeferenciranje portulanskih karata na kojima kartografska mreža nije ucrtana. Za dodatne informacije (Nicolai 2014, iMarelić 2022,2023b).

[8] Sferne korekcije reziduala [km] izvedene su s pomoću izraza: : |dLON|[km]= ||[°] x 111.132 x cos (midLAT, te |dLAT|[km]= ||[°] x 111.092, u kojem faktor 111,092 [km] predstavlja ∆lat pri φ = 43°+-30' (približna srednja geografska širina Jadranskog mora) na elipsodu WGS84, dobivena putem izraza: ∆lat = 1111132.954 - 559.882 x cos2φ + 1.175 x cos4φ. Oznaka midLAT predstavlja srednju geografsku širinu između referentne točke i pripadajuće joj (georeferencirane) identične točke.

[9] Transkript Ptolemejeve Knjige 2: Poglavlje 15 i Knjige 3: Poglavlje 1 i Poglavlje 12 (Stevenson 1991: 68, 72, 85),), sadrži 82 lokaliteta za prostor Jadranskog mora (43 su odbačena).

[10] Prema Ptolemejevim koordinatama, najsjevernija točka na Jadranskom moru je Alvona (Labin), φ=45,0°S, koja zapravo (na WGS84) iznosi φ=45,1°S. Stvarna geografska širina Trsta (Tergestrium) – najsjevernije točke u stvarnosti, s φ=45,6°S (smještena 0,6° sjevernije od Alvone) – je, prema Ptolemeju, φ=44,9°S (0,2° južnije od Alvone).

[11] Ovdje je važno napomenuti da se skup podataka o koordinatama koji je preuzet iz Stevensonovog prijevoda Ptolemejeve knjige razlikuje od skupa od 45 lokaliteta koji se koristio za sve preostale analize (usporediti lokalitete na slici 5 s lokalitetima naslikama 14).

[12] Srednja kvadratna pogreška (RMSE) očitanih koordinata je dobivena s pomoću izraza: RMSE|dLON| = √(Σni=1=1i-~λi)2)/(n-1), RMSE|dLAT| = √(Σni=1=1i-~φi)2)/(n-1).. Vrijednost −1 nalazi se u nazivniku zbog toga što su vrijednosti geografskih dužina i širina za svaki pojedini lokalitet preuzete nezavisno i zbog toga što skup od 45 lokaliteta ne predstavlja ukupnu količinu koordinata koju je (bilo) moguće preuzeti.

[13] Većina odabranih karata je ograničena na prikaz Jadranskoga mora. Longitudinalni pomak (Δλ0) izračunan je i primijenjen da bi se izgled prikaza prostora na njima “eksponirao” u relativnim iznosima, tj. neovisno o apsolutnoj nuli (koju se, u slučaju geografske dužine, arbitrarno određuje).

[14] Vidislike 14.

[15] Primjerice, Bellinova pomorska karta Carte de la Mer Méditerranée en Trois Feuilles (1745) je također izrađena u uspravnoj ekvidistantnoj cilindričnoj projekciji φ0=36° (koja nije konformna). Za više informacija, vidiMarelić 2023b: 9, 12..

[16] Točnost prikaza grografskih dužina na njima iskazana je u relativnim međuodnosima (dobivenim nakon njihove “kalibracije” na greeenwichki početni meridijan s pomoću pomaka Δλ0).

[17] Jedan toise (hvat) iznosi 1,949 metara (Treese 2018: 129).

[18] Prema Picardu, Zemljin opseg na ekvatoru iznosi 9000 lieües de 25 au degré (Picard 1671: 23).

[19] Coronellijeva izračunana Miglia di Italia je po iznosu bliža Napuljskoj milji od 1846 m (Treese 2018: 145) nego Venecijanskoj milji od 1738,7 m (Meyers Konversations-Lexikon 1897: 80).

[20] Coronellijeva izračunana Leghe di Spagna je po iznosu bliža portugalskoj ligi (legoa) od 6173 m, nego španjolskoj ligi (legua royal) od 6687 m (Treese 2018: 129, 167).

[21] Mjerilo karte u uspravnoj ekvidistantnoj cilindričnoj projekciji valjano je uzduž standardnih paralela φ0 i uzduž svih meridijana. Da bi se zadržao pravokutni izgled karte, tj. jednaka duljina svih prikazanih paralela, paralele koje imaju veću geografsku širinu od φ0 se, stoga, preslikavaju sve „istegnutijima“ (u krupnijem mjerilu) idući prema polovima, dok se paralele čija je geografska širina manja od φ0 preslikavaju sve više „komprimiranijima“ (u sitnijem mjerilu) idući prema ekvatoru. Za dodatna pojašnjenja, pogledati bilješku 4 i (Snyder 1993: 5−8).


1. Uvod

Jedan od najvažnijih događaja u povijesti kartografije koji je obilježio razbolje renesanse bilo je (ponovno) otkrivanje djela Geographike Hyphegesis (Geografski priručnik, poznatiji i kao Geografija) koje je izvorno napisao Klaudije Ptolemej (otprilike 90.−168.) – opsežnog i detaljnog artefakta helenističke geografije i kartografije – koje je do tog razdoblja bilo u posjedu bizantskih učenjaka (Gautier Dalché 2007: 285–287). Dva značajna noviteta uvedena povodom toga događaja bila su (re)definiranje lokaliteta na Zemljinoj površini s pomoću sfernih koordinata te (ponovno) kvantitativno pristupanje izradi karata upotrebom matematički definiranih kartografskih projekcija. Njegova knjiga sadrži i upute za konstruiranje kartografskih projekcija koje preporučuje za izradu karata čitave ekumene ili njezinih većih dijelova – „Ptolemejeve prve projekcije“ (uspravne ekvidistantne konusne projekcije φ0=36°),[1] i „Ptolemejeve druge projekcije“ (uspravne pseudokonusne projekcije). Neke od njegovih karata krupnijeg mjerila bile su izrađene u uspravnoj ekvidistantnoj cilindričnoj projekciji φ0=36°, čije se otkriće pripisuje Marinu iz Tira (prvo stoljeće), Ptolemejevom prethodniku i izvoru najvećeg dijela prostornih podataka sadržanih u Geographike Hyphegesis (Keuning 1955: 9−10, 13−16;Snyder 1993: 5-8, 10−14;Berggren i Jones 2000: 23−41;Marx 2011: 29). Spomenuti slijed događaja izazvao je obrat paradigme u kartografiji tako da je omogućio „geometrizaciju“ prostora (Kagan i Schmidt 2007: 663) te se zadržao kao temeljni pristup izradi karata i do danas. Prije prijenosa Ptolemejeve ostavštine u zapadnu Europu, kartografska produkcija toga prostora u pravilu se sastojala od mappamundi, subjektivno izrađenih karata poznatog svijeta, prožetih religijskom simbolikom (Woodward 1987: 286−291) i portulanskih karata, najstarijih poznatih pomorskih karata koje su se, koliko je poznato, iznenada „pojavile“ u kasnom trinaestom stoljeću i čije inicijalno porijeklo još uvijek nije poznato u potpunosti (Campbell 1987: 380−384;Nicolai 2015: 538−543,Marelić 2023a: 20−21).

2. Srodna kartometrijska istraživanja

Iako je kartometrijsku analizu inicijalno primijenio Hermann Wagner u krajem 19. stoljeća (Wagner 1896 (1969): 480), studije vezane uz povijest kartografije u kojima je primijenjena postale su zastupljenije posljednjih desetljeća zbog razvoja i povećane dostupnosti softvera za GIS. Primjeri ekstenzivnog kartometrijskog pristupa pomorskim kartama uključuju doktorske disertacije koje su izradili Scott Allen Loomer (Loomer 1987) Joaquim Gaspar (Gaspar 2010), Roel Nicolai (Nicolai 2014) i Tome Marelić (Marelić 2020). Kartometrijske analize starih geografskih karata izvršili su, primjerice, Tomáš Bayer sa suradnicima (Bayer i dr. 2010), Marina Triplat Horvat (Triplat Horvat 2014) i Marina Viličić (Viličić 2019). Jedini primjer kartometrijskog pristupa geografskim kartama koje je izradio Vincenzo Maria Coronelli (čija je karta Jadranskog mora iz 1688. odabrana za ovo istraživanje) je studija koju su provele Caterina Balletti i Caterina Gottardi, koje tvrde da na temelju primijenjene metodologije nije moguće sa sigurnošću odrediti koju je kartografsku projekciju koristio pri izradi njegove karte srednje Europe (Baletti i Gottardi 2015: 31−33).

Sofisticirane analize Ptolemejevih koordinata izvršili su Evangelos Livieratos sa suradnicima (Livieratos 2006;Livieratos i dr. 2007,2008), Christian Marx (Marx 2011;2012;2016), i Irina Tupikova (Tupikova 2014). Livieratos je proveo i istraživanje u kojem je računski usporedio točnost geometrijskog prikaza na starim kartama s kvantitativnim podatcima koje je preuzeo iz njihovih kartografskih mreža. Njegov zaključak je da dvije ptolemejske karte[2] Krete koje je istraživao (jedna iz četrnaestog i jedna iz sedamnaestog stoljeća) geometrijski odgovaraju podatcima o koordinatama kojima se koristio u istraživanju (Livieratos 2006: 58−59).

3. Obuhvat i metodologija

Cilj istraživanja bio je ustanoviti geometrijske značajke prikaza obalne crte bazena Jadranskoga mora na odabranim geografskim i pomorskim kartama na kojima je ucrtana kartografska mreža izrađenih u ranom novom vijeku (prije provođenja sustavnih geodetskih i hidrografskih izmjera) na temelju njihovih podataka o geografskim dužinama i širinama. Temeljni uzorak sastoji se od tri geografske i tri pomorske karte (tablica 1).[3]

Karta Italiae Novissima Descriptio koju je izradio Giacomo Gastaldi 1570. jedna je od najranijih razmjerno detaljih, i vjerojatno razmjerno točnih ranonovovjekovnih karata Jadranskoga mora i okolnog prostora. Crtice u njezinom okviru, koje predstavljaju stupnjeve geografske dužine, doimaju se blago nagnutima i zrcalno usmjerenima prema srednjem meridijanu, dok su crtice koje predstavljaju stupnjeve geografske širine međusobno jednako udaljene, što aludira na to da je karta izvorno izrađena u „Ptolemejevoj prvoj projekciji“. Karta Golfe de Venise (1664) Pierra Duvala estetski asocira na istodobno izrađivane pomorske karte budući da u središtu sadrži ružu vjetrova sa 16 smjerova i kompasnu ružu u svojem jugoistočnom dijelu, a podatci o prikazanom prostoru koncentrirani su uglavnom uz prikaz obalne crte (slika 1), što upućuje na to da je vjerojatno bio inspiriran pomorskim kartama koje je imao na raspolaganju. Međutim, čak i na razini opažanja, vidljivo je da se ta karta ne može koristiti u navigacijske svrhe. Prvi razlog je izrazito „istegnuće“ prikaza geografske dužine, što asocira na uporabu Ptolemejevih podataka o lokalitetima koji, po tom pitanju, sadrže izrazito nisku točnost (Marx 2011: 36; 2012: 100). Drugi razlog je geometrija njezine kartografske mreže – LON/LAT (λ/φ) omjer jednakih stupanjskih intervala je otprilike 0,8, što znači da je ciljano izrađena u uspravnoj ekvidistantnoj cilindričnoj projekciji φ0=36°, koja nije konformna.[4] Sličan grafički prikaz Jadranskog mora te identični omjer LON/LAT od 0,8 postoji i na karti Golfo di Venezia (1688) koju je izradio Vincenzo Maria Coronelli. Karta također sadrži ružu vjetrova, no geografski podatci prikazani na njoj su (osim što su značajno detaljniji u usporedbi s Duvalovom kartom) ravnomjerno raspoređeni po čitavom polju karte (slika 3). Coronellijeva karta sadrži i manji broj dvostruko navedenih toponima, tako da su helenistička imena napisana pored lokaliteta koji su imenovani i na talijanskom jeziku,[5] što upućuje na to da se pri izradi karte koristio Ptolemejevim geografskim podatcima.

Uzorak pomorskih karata – koje su izrađene u približno sličnom razdoblju kao i odabrane geografske karte te također sadrže kartografsku mrežu – uključuju prikaz Jadranskog mora na tri lista koji je izradio Robert Dudley i koji je objavljen u knjizi Dell’arcano del mare (1646), kartu Golfe de Venise (1700), koju je izradio Pieter Van der Aa te kartu Réduite de la Mer Méditerranée (1737) koju je izradio Jacques-Nicolas Bellin. Te su karte prethodno kartometrijski analizirane do određene mjere (Marelić 2023b), no točnost njihovih sfernih koordinata nije bila razmotrena u širem kontekstu koji uključuje druge kartografske izvore s kartografskim mrežama izrađene tijekom toga razdoblja.

U svrhu određivanja njihove točnosti, odabrane karte su georeferencirane (podvrgnute metodi LSE; po metodi najmanjih kvadrata reziduala) s pomoću QGIS-a, na stiardiziranom uzorku od 45 točaka po karti (koje predstavljaju istih 45 lokaliteta u stvarnosti; vidislike 14) i primjenom Helmertove transformacije (Modenov i Parkhomenko 1965: 77−93) da bi se sačuvalo njihovu izvornu geometriju u relativnim odnosima. Budući da se LSEizvodi u euklidskoj geometriji i zahtjeva postojanje unaprijed zadane kartografske projekcije,[6] tri projekcije su odabrane za tu svrhu: uspravna ekvidistantna cilindrična φ0=36° (CYL36), uspravna ekvidistantna konusna φ0=36° (CON36) te Mercatorova φ0=36° (MERC36). Prve dvije odabrane su zbog sličnosti geografskih karata s helenističkom kartografijom, dok je Mercatorova projekcija odabrana zbog toga što predstavlja geometrijsku osnovu izrade kasnosrednjovjekovnih i ranonovovjekovnih rukopisnih pomorskih (portulanskih) karata te većine ranonovovjekovnih tiskanih pomorskih karata (Loomer 1987: 144−146;Nicolai 2014: 253, 387,Marelić 2022: 98−99,2023b: 5−7).

Georeferenciranje karata izvedeno je na dva različita načina. Prvi način, i u užem smislu važniji za ovo za istraživanje, je uz upotrebu vrijednosti LON i LAT (ručno preuzetih s karata i ucrtanih kao točkaste podatke u GIS) kao „pseudo-referentne točke“, koje su potom uspoređene s njihovim pripadajućim referentnim vrijednostima LON i LAT na elipsoidu WGS84. Drugi način, u kojem su odabrani lokaliteti na kartama upotrijebljeni kao identične točke, po svojoj je prirodi u potpunosti geometrijski, a proveden je u svrhu određivanja optimalnog preklapanja prikaza obalne crte na tim kartama, bez obzira na vrijednosti koordinata koje su im na karti dodijeljene.[7] Budući da su rezultati oba scenarija dobiveni u euklidskoj geometriji (referentne) karte u mjerilu 1:1 (definirane parametrima odabrane kartografske projekcije), potrebno je naknadno izvršiti sfernu korekciju odmaka (reziduala) identičnih točaka u svrhu anuliranja distorzija uzrokovanih projekcijom, a njihove kutne odmake (d |LON| [°], d| LAT| [°]) potrebno je pretvoriti u udaljenosti uzduž geodetskih linija na plohi elipsoida WGS84 (d|LON| [km], d|LAT| [km]).[8]

4. Točnost koordinata na geografskim i pomorskim kartama

Točnost sfernih koordinata očitanih s karata i preuzetih kao skup točkastih podataka, određena je s pomoću tri različite analize. Prva analiza je usporedba njihovog obuhvata geografske dužine i širine za bazen Jadranskoga mora s njegovim obuhvatom na WGS84. Druga analiza sastoji se od određivanja točnosti koordinata na geografskim kartama u usporedbi sa skupom točkastih podataka koji predstavljaju koordinate preuzete iz Ptolemejeve Geographike Hyphegesis (Stevenson 1991). U tu svrhu, 39 lokaliteta koje je bilo moguće identificirati s većom pouzdanosti (slika 5)[9] ucrtano je na geografske karte (34 lokaliteta na karti GAS_1570, 32 na DUV_1664 i 38 na karti COR_1688), kojima su, potom, očitane koordinate i preuzete kao skup točkastih podataka atribuiranih odgovarajućim vrijednostima LON i LAT. Treća analiza je određivanje točnosti koordinata na kartama pri njihovoj usporedbi s pripadajućim referentnim vrijednostima, kao i u usporedbi s pripadajućim „pseudo-koordinatama“ dobivenim usporedno na temelju optimalnog preklapanja prikaza obalne crte putem metode LSE. U nastavku je opisano nekoliko mogućnosti za računanje mjerila geografskih karata s malom točnošću prikaza geografskih dužina.

4.1. Razlike u percepciji prostornog obuhvata Jadranskoga mora

Referentni prostorni obuhvat bazena Jadranskoga mora na elipsoidu WGS84 izmjeren je između krajnjih točaka u smjeru S–J i I–Z (tablica 2). Pogreška obuhvata geografske dužine (dΔλ) na geografskim kartama (u prosjeku +2,1° ili +169,6 km) je značajno veća od pogreške na pomorskim kartama (fragment stupnja, tj. samo −3,8 km u prosjeku). Međutim, pogreška obuhvata geografske širine (dΔφ) je na geografskim kartama (u iznosu od −0,1°, ili −13,3 km u prosjeku) manja nego na pomorskim kartama (−0,3° ili −37,0 km u prosjeku). Njegov obuhvat prema Ptolemejevim podatcima i mjeren između krajnjih točaka toga skupa koordinata: ušće rijeke Drim – Ravenna (obuhvat I–Z) te Trst – rt Leuca (obuhvat S–J)[10], predstavlja skup podataka s najvećim iznosima pogrešaka, poglavito po pitanju geografske dužine.

4.2. Usporedba koordinata s geografskih karata i Ptolemejevih podataka

Vrijednosti geografskih dužina, s obzirom na to kako su prikazane na trima geografskim kartama, čine se vrlo sličnima međusobno, ali i u odnosu na Ptolemejeve koordinate. Primjerice, geografska dužina Ravenne (λ=12,3°I na WGS84) iznosi λ=34,7°I u Ptolemejevim podatcima, λ=34,9°I na Gastaldijevoj karti (1570), λ=35,1°I na Duvalovoj karti (1664) te λ=35,2°I na Coronellijevoj karti (1688). Ptolemejevi podatci su (u svrhu korekcije početnog meridijana) longitudinalno pomaknuti za Δλ=−25,2°, koji odgovara geografskoj dužini otoka Santa Antão; najzapadnijeg u Kapverdskom arhipelagu – prilagodba kakvu je prethodno primijenio Marx u svojoj kvantitativnoj analizi Ptolemejevih koordinata za bazen Jadranskoga mora (Marx 2012: 100). Isti longitudinalni pomak (isključivo za potrebe ove analize) odabran je da bi se optimizirale koordinate Ptolemejevih lokaliteta identificiranih i ucrtanih na svakoj od tri geografske karte (slika 5).[11]

U usporedbi s WGS84, Ptolemejeve koordinate pokazale su RMSE|dLON| točnost od 1,7° (136,8 km) i RMSE|dLAT| točnost od 0,6° (63,9 km).[12] U usporedbi s Ptolemejevim podatcima, geometrijski centri Ptolemejevih lokaliteta na kartama, izračunani i ucrtani kao skup točkastih podataka, pokazuju RMSE|dLON| od 1,7° (135,2 km) i RMSE|dLAT| od 0,8° (86,4 km), dok u odnosu na WGS84 njihova RMSE|dLON| točnost iznosi 1,4° (111,2 km) uz RMSE|dLAT| točnost od 0,3° (35,3 km). Točnost prikaza geografskih dužina i geografskih širina na kartama veća je od točnosti Ptolemejevih podataka. Također, koordinate na kartama su točnije u odnosu na referentne vrijednosti nego u odnosu na Ptolemejeve podatke, što upućuje na to da je određeni napredak u prostornoj percepciji položaja odabranih lokaliteta na obali Jadranskoga mora nastao u razdoblju izrade tih karata ili ponešto ranije. Geometrijski centri identičnih točaka na trima kartama pokazuju da su značajne korekcije vrijednosti geografskih dužina urađene na krajnjim sjevernim dijelovima prikaza, dok su na krajnjim južnim dijelovima prikaza urađene značajne korekcije vrijednosti geografskih širina.

4.3. Dvostruka percepcija izgleda Jadranskoga mora

Koordinate 45 lokaliteta odabranih sa svake karte i ucrtanih u GIS-u kao točkasti skup podataka uspoređene su s pripadajućim referentnim vrijednostima na WGS84 (slike 14,slika 6) u svrhu računanja RMSE|dLON| i RMSE|dLAT| [km]. Da bi se minimizirala razlika u odabiru početnog meridijana, pojedini longitudinalni pomak (Δλ0) izračunan je za svaku kartu kao prosječni iznos (stvarnih) razlika između vrijednosti geografskih dužina na njoj i vrijednosti referentnih geografskih dužina za odabrane lokalitete.[13] Također, svaka karta je uspoređena i s „pseudo-koordinatama“ identičnih točaka naknadno dobivenih s pomoću metode LSE,[14] koje su produkt dvodimenzionalne konformne transformacije svake od karata uz promjenu njihova mjerila i orijentacije (θLSE), provedenog u svrhu postizanja optimalnog geometrijskog preklapanja s obzirom na formu prikaza Jadranskoga mora na njima (poluprozirne linije obalne crte naslikama 14, sekcija B utablici 3).

Kada se odabrane karte georeferencira koristeći koordinate preuzete s njih kao „pseudo-referentne točke“ – tj. koordinate za koje su njihovi autori vjerovali da su istinite – najsličnijom kartografskom projekcijom za svaku od njih se pokazala ona koja im je izvorno bila dodijeljena; normalna ekvidistantna konusna φ0 =36° za Gastaldijevu kartu (1570), normalna ekvidistantna cilindrična φ0 =36° za Duvalovu (1664) i Coronellijevu (1688) kartu, kao i za pomorsku kartu koju je izradio Van der Aa (1700) te Mercatorova projekcija za pomorske karte koje su izradili Dudley (1646) i Bellin (1737) (sekcija A utablici 3). Odluka Van der Aa da svoju pomorsku kartu izradi u projekciji koja nije konformna (zbog čega se na njoj loksodrome ne projiciraju kao ravne crte, što je poželjno u navigaciji) je neuobičajena, no ona nije jedini slučaj takve prakse.[15] Također, njihove rotacije (θLSE), nastale kao rezultat postupka su neznatne. Točnost geografskih dužina na geografskim kartama (u usporedbi s WGS84 referentnim vrijednostima) je značajno niska – njihov RMSE|dLON| u prosjeku iznosi 61,1 km – dok je njihova točnost geografskih širina relativno velika, s prosječnim RMSE|dLAT| od 31,7 km. Po pitanju točnosti geografskih širina slične su pomorskim kartama, čija prosječna točnost iznosi 29,2 km, za razliku od točnosti geografskih dužina koja je na pomorskim kartama, donekle iznenađujuće, značajno visoka – 18,4 km u prosjeku, tj. 60% veća od njihove točnosti geografskih širina.

Pristup georeferenciranju karata koji je u potpunosti geometrijski (sekcija B utablici 3) ostvario je donekle intrigantne rezultate. „Pseudo-koordinate“ (hipotetske, i geometrijski idealne koordinate dobivene isključivo na temelju izgleda Jadranskoga mora na karti) na koje identične točke s pomorskih karata „naliježu“ po završetku geometrijski orijentiranog georeferenciranja su po pitanju geografskih dužina iznimno slične vrijednostima za koje su autori tih karata smatrali da su istinite (uz prosječnu razliku od samo 7,5 kilometara). S druge strane, usporedbom koordinata preuzetih s geografskih karata s njihovim „pseudo-koordinatama“ ustanovljen je prosječni „odmak“ od 56,3 kilometra (sekcija C utablici 3). Također, njihove rotacije nastale uslijed geometrijski orijentiranoga georeferenciranja su značajne; +7,2° za Duvalovu (1664) i +7,4° za Coronellijevu (1688) kartu, u usporedbi s -0,9°, odnosno, −0,1°, dobivenih putem georeferenciranja na koordinate preuzete izravno s njih („pseudo-referentne točke“). Točnost koordinata na pomorskim kartama (u usporedbi s referentnim WGS84 vrijednostima) pokazala se iznimno sličnom njihovoj točnosti u odnosu na optimalno geometrijsko preklapanje izgleda njihove obalne crte prije svega zbog njihove iznimno velike točnosti prikaza geografskih dužina. Ta iznimna sličnost rezultata dobivenih iz dva odvojena i metodološki različita pristupa eksplicitno prikazuje da su i percipirani izgled bazena Jadranskoga mora, kao i vrijednosti koordinata pridruženih odabranim lokalitetima,[16] značajno točniji u odnosu na istovjetne značajke geografskih karata (usporediti široke crne vektorizirane linije obalne crte s poluprozirnim prikazima obale kodiranim s pomoću boja naslikama 14 te sekcije A i B naslici 6).

Kada se prikazi obalne crte bazena Jadranskoga mora na odabranim geografskim kartama usporede s prikazima na odabranim pomorskim kartama (prikazani u istom mjerilu i poravnani po meridijanima;slika 6) moguće je jasno uočiti usporedno postojanje dviju značajno različitih percepcija njegovog izgleda unutar dvije odvojene „kartografske stvarnosti“. Pojednostavljeno govoreći, ako se njegov stvarni izgled, koji pokazuje razmjerno sličnu širinu uzduž većeg dijela svoje geometrijske osi (SZ–JI), zamisli kao jednostavni crtež (nagnutog) četverokuta, u tom slučaju se njegov izgled – tako kako su ga percipirali kartografi koji su izrađivali geografske karte – može zamisliti kao „banana“ ili „krastavac“. Analogno tome, njegov oblik – tako kako su ga percipirali autori pomorskih karata – može se zamisliti kao (nagnuti) „lijevak“ (koji se proširuje prema SZ) – „geometrijski otisak“ kakav je otprije postojao na portulanskim kartama (Marelić 2022: 95-96,2023b: 8-13).

4.4. Mjerilo geografskih karata s malom točnošću prikaza geografskih dužina

Zbog značajnih pogrešaka prikaza geografskih dužina na ranonovovjekovnim geografskim kartama, valjano je razmotriti načine računanja njihovog mjerila. Neke metodološke mogućnosti prikazane su na primjeru Coronellijeve karte (1688) koja, unatoč detaljnom prikazu geografskog sadržaja, izvanredne estetike i šest grafičkih mjerila (svako kalibrirano u vlastitoj mjernoj jedinici za udaljenost), sadrži značajno nisku točnost prikaza geografskih dužina (slike 3, 6) i geometrijski je najsličnija uspravnoj ekvidistantnoj cilindričnoj projekciji φ0=36°, čija se stiardna paralela nalazi izvan prostora prikazanog na karti.

Da bi se izračunao modul mjerila karte, prvo je potrebno pretpostaviti Zemljine dimenzije i mjerne jedinice za udaljenost koje je Coronelli koristio. Tri grafička mjerila odabrana su u tu svrhu na karti COR_1688: A: Miglia di Italia (talijanske milje; 100 jedinica; 102 mm duljine), B: Leghe di Francia (francuske lige; 45 jedinica; 112 mm duljine) i C: Leghe di Spagna (španjolske lige; 33 jedinice; 114 mm duljine). Omjer njihove veličine (100:45:33), korigiran omjerom njihovih duljina na karti (102:112:114 mm) sugerira da, primjerice, 1 talijanska milja (prema njegovoj karti) odgovara 0,41 francuske lige i 0,30 španjolske lige (tablica 4). Ako pretpostavimo da se Coronelli koristio Zemljinim opsegom na ekvatoru od 40 035 578,4 metara (20 541 600 toisea)[17], koji je 1669. izračunao francuski astronom i geodet Jean Picard (Picard 1671: 23) te da je pod Leghe di Francia Coronelli podrazumijevao Picardovu Lieüe de 25 au degré (25 liga po stupnju) od 4448 m (2282 toisea),[18] preostale dvije mjerne jedinice bi trebale iznositi 1823 m (Miglia di Italia),[19] i 6182 m (Leghe di Spagna).[20] Primjenom tog kriterija, proizlazi da 1 mm na njegovom grafičkom mjerilu odgovara 0,17 km u stvarnosti, što rezultira mjerilom karte od 1:1 787 725, ili, otprilike 1:1 800 000 kao zaokružena vrijednost. Međutim, ni stiardna paralela ni njegove izrazite pogreške prikaza geografskih dužina pritom nisu bile razmatrane.

Ako se pretpostavi da je Coronelli vjerovao da njegova karta ne sadrži pogreške, i uzme u obzir njezina sličnost s projekcijom CYL36, to znači da je mjerilo karte valjano uzduž svih meridijana i (samo) uzduž paralele φ=36° (koja prema Picardovim računanjima ima opseg od 32 389 463,3 m i nije prikazana na karti) te da mjerilo karte uzduž paralela postaje krupnije približavanjem sjeveru (unutar obuhvata karte). Srednja paralela na karti je 42°40´S (42,67°S, smještena 6,67° sjevernije u odnosu na stiardnu paralelu), s opsegom od 29 436 942,8 m (opseg paralele φ=36° je 110% veći). To znači da je, u slučaju da su grafička mjerila na karti kalibrirana u skladu s opsegom paralele φ=36°, modul mjerila po pravcu I–Z na karti potrebno podijeliti s 1,10, što rezultira „stvarnim“ longitudinalnim mjerilom od 1:1 625 204[21] uzduž srednje paralele Jadranskoga mora (1:1 625 000 kao zaokružena vrijednost), dok mjerilo uzduž meridijana ostaje nepromijenjeno.

Ako se, dodatno, uzme u obzir njegova pogreška obuhvata geografske dužine od +2,36° (32,2% veći od stvarnog obuhvata), koje vjerojatno nije bio svjestan, to znači da je modul mjerila uzduž srednje paralele (koji je već podijeljen s 1,10) potrebno podijeliti s 1,32, što rezultira „stvarnim“ mjerilom 1:1 209 229 uzduž srednje paralele (1:1 210 000 kao zaokružena vrijednost). Ako se pretpostavi da Coronelli grafička mjerila nije izradio u skladu s paralelom φ=36° kao onom uzduž koje je mjerilo karte valjano (iz razloga što nije srednja paralela prikazanog prostora), modul mjerila po pravcu I–Z na karti potrebno je podijeliti samo s 1,32, što rezultira mjerilom 1:1 354 337 uzduž srednje paralele (1:1 355 000 kao zaokružena vrijednost). Njegova pogreška obuhvata geografske širine je neznatna (samo 0,0012°), zbog čega nisu bile razmatrane. Odluka o odabiru neke od spomenutih vrijednosti za iskazivanje mjerila karte trebala bi biti arbitrarna; temeljna uloga ovih odlomaka je da se s pomoću njih naglase parametri koji mogu utjecati na određivanje mjerila te kao prijedlog metodologije za određivanje mjerila na starim kartama (s malom točnosti prikaza geografskih dužina) na temelju tih kriterija.

5. Zaključci

Primjena kartografskih mreža na geografskim i pomorskim kartama je, iako je zapravo bilo riječ o ponovnom otkrivanju metodologije koja je otprije bila razvijena u helenističkom razdoblju, predstavljala novitet ranonovovjekovnim kartografima u zapadnoj Europi. Rezultati istraživanja pokazali su da su u razdoblju ponovnog otkrića „kartografije temeljene na kartografskoj mreži“ simultano postojala dva usporedna načina kartografskog iscrtavanja bazena Jadranskoga mora. Kartografi koji su izrađivali geografske karte značajno su se oslanjali na sačuvani geografski opus Klaudija Ptolemeja, dok su oni koji su izrađivali pomorske karte, čini se, bili primarno inspirirani geometrijom prikaza na portulanskim kartama. Obje spomenute „matrice prostornog poretka“ su u to vrijeme već postojale, a s obzirom na to da su te karte izrađene prije uvođenja sustavnih geodetskih i hidrografskih izmjera, njihovi su autori bili ograničeni na materijale koje su imali na raspolaganju, nadopunjene serijama pokušaja i pogrešaka u svrhu „poboljšanja slike svijeta“.

Iako geografske karte iz istraživanja pokazuju značajna geometrijska poboljšanja u odnosu na Ptolemejeve prostorne podatke, vrijednosti geografskih dužina pridružene lokalitetima na tim kartama (bile) su i dalje izrazito manje točne od vrijednosti na pomorskim kartama. Metodologija primijenjena u ovom istraživanju ne može utvrditi ili objasniti uzročno-posljedične veze na kojima su ta poboljšanja utemeljena – možda su njihovi autori uspoređivali Ptolemejeve podatke, prenaglašene po pitanju vrijednosti geografskih dužina s „kompaktnijim“ prostornim obuhvatima prikazanima na portulanskim kartama i nastojali stvoriti njihov „optimalni grafički spoj“. Neovisno o tome koji tijek zbivanja se uistinu odvio, valjalo bi provesti dodatna istraživanja na ovu temu u svrhu traženja odgovora na otvorena pitanja.

Napomena

Ovo istraživanje je dio znanstvenog projekta IP-2020-02-5339 Ranonovovjekovne pomorske karte Jadranskog mora: izvor spoznaja, sredstvo navigacije i medij komunikacije (NACHAS) koji financira Hrvatska zaklada za znanost.

Notes

[1] φ0 stands for the standard parallel

[2] Late medieval and early modern attempts to reconstruct the (lost) cartographic content of Geographike Hyphegesis.

[3] Throughout the majority of the manuscript, the terms geographical maps and nautical charts were simplified into maps and charts.

[4] When normal cylindrical projection is set with φ0=36° as standard parallel (“the Marinus of Tyre projection”), the parallels φ=36° (N and S) are plotted on a map true-to-scale with (all) meridians. Since their circumference is shorter than the circumference of meridians (with their antimeridians) by the factor of cos 36° = 0.809 (if Earth is approximated as a sphere), such map shows apparent longitudinal “compression” in comparison with plate carrée (the same projection, but with φ0=0°) in a way that the longitudinal equal-degree intervals are mapped shorter than their latitudinal counterparts by the factor of 0.809.

[5] Examples: Corcyra Melaena next to Curzola, Epidamaus and Dyrrachium next to Durazzo, Lissicus next to G.(olfo) del Drin, Diomedeae Insulae next to Isole de Tremiti, or Iapigium and Salentium next to Capo S Maria o d’Otranto.

[6] Maps and charts were georeferenced on a modern map of the Mediterranean (shapefile), downloaded from marineregions.org. (Claus et al. 2017).

[7] This method is, for example, the only possible way to georeference portolan charts that do not contain graticules. For additional information, see (Nicolai 2014, andMarelić 2022,2023b).

[8] Spherical corrections of the residuals [km] were obtained as: |dLON|[km]= ||[°] x 111.132 x cos (midLAT, and |dLAT|[km]= ||[°] x 111.092, in which the factor 111.092 [km] represents ∆lat at φ = 43°+-30' (the approximate central latitude of the Adriatic Sea) on the WGS84 ellipsoid, derived from the formulae: ∆lat = 1111132.954 - 559.882 x cos2φ + 1.175 x cos4φ. The midLAT stands for the mid-latitude between the reference point and its corresponding (georeferenced) identical point.

[9] The transcript of Ptolemy’s Book 2: Chapter 15 and Book 3: Chapter 1 and Chapter 12 (Stevenson 1991: 68, 72, 85), contains 82 locations for the Adriatic Sea area (43 were rejected).

[10] According to Ptolemy’s coordinates, the most northern location in the Adriatic Sea area is Alvona (Labin), φ=45.0°N, whose actual latitude (on WGS84) is φ=45.1°N. The actual latitude of Tergestrium (Trieste) – the most northern location in reality, with φ=45.6°N (located 0.6° norther than Alvona) – is, according to Ptolemy, φ=44.9°N (0.2° southern of Alvona).

[11] It is important to note here that the coordinate-dataset extracted from Stevenson’s translation of Ptolemy’s book is different from the dataset of 45 locations that were used for all the remaining analyses (compare locations inFigure 5 with locations inFigure 14).

[12] The root mean-squared error (RMSE) of their coordinates was computed by using the formulae: RMSE|dLON| = √(Σni=1=1i-~λi)2)/(n-1), RMSE|dLAT| = √(Σni=1=1i-~φi)2)/(n-1). The −1 is in the denominator because the longitude and latitude for each location were extracted and added to the dataset independently and because the selected dataset (of 45 points) does not constitute the entire amount of coordinates that could (possibly) be extracted.

[13] The majority of selected maps and charts are territory-wise limited to the extent of the Adriatic Sea basin. The E–W shift of longitudes (Δλ0) was computed and applied

[14] SeeFigure 14

[15] For example, Bellin’s nautical chart Carte de la Mer Méditerranée en Trois Feuilles (1745), was also made with the application of (non-conformal) normal equidistant cylindrical projection φ0=36°. For additional information, seeMarelić 2023b: 9, 12.

[16] Their longitudinal accuracy is expressed in the relative context (obtained upon “calibrating” them to the Greenwich prime meridian with the application of E–W shift Δλ0).

[17] One toise (fathom) was 1.949 metres in length (Treese 2018: 129).

[18] According to Picard, Earth’s equatorial circumference consists of 9,000 lieües de 25 au degré (Picard 1671: 23).

[19] Coronelli’s computed Miglia di Italia appears to be more similar to miglio of Naples of 1,846 m (Treese 2018: 145), than to miglio of Venice of 1,738.7 m (Meyers Konversations-Lexikon 1897: 80).

[20] Coronelli’s computed Leghe di Spagna seems to be closer to the Portuguese legoa of 6,173 m, than it is to the Spanish legua royal of 6,687 m (Treese 2018: 129, 167).

[21] The map scale on normal equidistant cylindrical projection is true along its standard parallel (φ0) and all meridians. In order to retain the rectangular shape of the map, i.e., the equal length of displayed parallels, those with latitudes greater that φ0 are, thus, plotted increasingly “stretched” (on a smaller scale), while parallels with latitudes lower than φ0 are plotted increasingly “compressed” (on a larger scale). For additional explanation see note 4 and (Snyder 1993: 5−8).

[1] φ0 predstavlja stiardnu paralelu

[2] Kasnosrednjovjekovne i ranonovovjekovne rekonstrukcije (izgubljenog) kartografskog sadržaja Geographike Hyphegesis.

[3] U većem dijelu rukopisa, sintagma geografska karta skraćena je u pojam karta, dok je sintagma pomorska karta zadržana.

[4] Kada je uspravna ekvidistantna cilindrična projekcija zadana s φ0=36° kao stiardnom paralelom („projekcija Marina iz Tira“), paralele φ=36° (S i J) se na karti preslikavaju u zadanom mjerilu karte zajedno sa (svim) meridijanima. Budući da je njihov opseg manji od opsega meridijana (zajedno s njihovim antimeridijanima) za faktor cos 36° = 0.809 (ako se Zemlja aproksimira kuglom), takva karta prikazuje prividnu „kompresiju“ prikaza geografske dužine u usporedbi s plate carrée (ista projekcija, no zadana s φ0=0°) tako da su stupanjski intervali geografske dužine prikazani kraći u odnosu na jednake stupanjske intervale geografske širine za faktor 0,809.

[5] Primjeri: Corcyra Melaena pored Curzola, Epidamaus i Dyrrachium pored Durazzo, Lissicus pored G.(olfo) del Drin, Diomedeae Insulae pored Isole de Tremiti, ili Iapigium i Salentium pored Capo S Maria o d’Otranto.

[6] Karte su georeferencirane na suvremenu kartu Sredozemlja (shp datoteka), preuzetu s marineregions.org (Claus i dr. 2017).

[7] Ta je metoda, primjerice, jedini mogući način za georeferenciranje portulanskih karata na kojima kartografska mreža nije ucrtana. Za dodatne informacije (Nicolai 2014, iMarelić 2022,2023b).

[8] Sferne korekcije reziduala [km] izvedene su s pomoću izraza: : |dLON|[km]= ||[°] x 111.132 x cos (midLAT, te |dLAT|[km]= ||[°] x 111.092, u kojem faktor 111,092 [km] predstavlja ∆lat pri φ = 43°+-30' (približna srednja geografska širina Jadranskog mora) na elipsodu WGS84, dobivena putem izraza: ∆lat = 1111132.954 - 559.882 x cos2φ + 1.175 x cos4φ. Oznaka midLAT predstavlja srednju geografsku širinu između referentne točke i pripadajuće joj (georeferencirane) identične točke.

[9] Transkript Ptolemejeve Knjige 2: Poglavlje 15 i Knjige 3: Poglavlje 1 i Poglavlje 12 (Stevenson 1991: 68, 72, 85),), sadrži 82 lokaliteta za prostor Jadranskog mora (43 su odbačena).

[10] Prema Ptolemejevim koordinatama, najsjevernija točka na Jadranskom moru je Alvona (Labin), φ=45,0°S, koja zapravo (na WGS84) iznosi φ=45,1°S. Stvarna geografska širina Trsta (Tergestrium) – najsjevernije točke u stvarnosti, s φ=45,6°S (smještena 0,6° sjevernije od Alvone) – je, prema Ptolemeju, φ=44,9°S (0,2° južnije od Alvone).

[11] Ovdje je važno napomenuti da se skup podataka o koordinatama koji je preuzet iz Stevensonovog prijevoda Ptolemejeve knjige razlikuje od skupa od 45 lokaliteta koji se koristio za sve preostale analize (usporediti lokalitete na slici 5 s lokalitetima naslikama 14).

[12] Srednja kvadratna pogreška (RMSE) očitanih koordinata je dobivena s pomoću izraza: RMSE|dLON| = √(Σni=1=1i-~λi)2)/(n-1), RMSE|dLAT| = √(Σni=1=1i-~φi)2)/(n-1).. Vrijednost −1 nalazi se u nazivniku zbog toga što su vrijednosti geografskih dužina i širina za svaki pojedini lokalitet preuzete nezavisno i zbog toga što skup od 45 lokaliteta ne predstavlja ukupnu količinu koordinata koju je (bilo) moguće preuzeti.

[13] Većina odabranih karata je ograničena na prikaz Jadranskoga mora. Longitudinalni pomak (Δλ0) izračunan je i primijenjen da bi se izgled prikaza prostora na njima “eksponirao” u relativnim iznosima, tj. neovisno o apsolutnoj nuli (koju se, u slučaju geografske dužine, arbitrarno određuje).

[14] Vidislike 14.

[15] Primjerice, Bellinova pomorska karta Carte de la Mer Méditerranée en Trois Feuilles (1745) je također izrađena u uspravnoj ekvidistantnoj cilindričnoj projekciji φ0=36° (koja nije konformna). Za više informacija, vidiMarelić 2023b: 9, 12..

[16] Točnost prikaza grografskih dužina na njima iskazana je u relativnim međuodnosima (dobivenim nakon njihove “kalibracije” na greeenwichki početni meridijan s pomoću pomaka Δλ0).

[17] Jedan toise (hvat) iznosi 1,949 metara (Treese 2018: 129).

[18] Prema Picardu, Zemljin opseg na ekvatoru iznosi 9000 lieües de 25 au degré (Picard 1671: 23).

[19] Coronellijeva izračunana Miglia di Italia je po iznosu bliža Napuljskoj milji od 1846 m (Treese 2018: 145) nego Venecijanskoj milji od 1738,7 m (Meyers Konversations-Lexikon 1897: 80).

[20] Coronellijeva izračunana Leghe di Spagna je po iznosu bliža portugalskoj ligi (legoa) od 6173 m, nego španjolskoj ligi (legua royal) od 6687 m (Treese 2018: 129, 167).

[21] Mjerilo karte u uspravnoj ekvidistantnoj cilindričnoj projekciji valjano je uzduž standardnih paralela φ0 i uzduž svih meridijana. Da bi se zadržao pravokutni izgled karte, tj. jednaka duljina svih prikazanih paralela, paralele koje imaju veću geografsku širinu od φ0 se, stoga, preslikavaju sve „istegnutijima“ (u krupnijem mjerilu) idući prema polovima, dok se paralele čija je geografska širina manja od φ0 preslikavaju sve više „komprimiranijima“ (u sitnijem mjerilu) idući prema ekvatoru. Za dodatna pojašnjenja, pogledati bilješku 4 i (Snyder 1993: 5−8).