
UVOD
Populations and habitats of large mammals are decreasing at a worrying rate due to anthropogenic effects, habitat fragmentation, and hunting activities (Boitani et al., 2008; Trisurat et al., 2012; Saito et al., 2016). Capra aegagrus (wild goat), an important large mammal, is at a risk of disappearing as well (Hovick et al., 2014; Barrueto et al., 2014, Süel, 2019). Capra aegagrus (hereafter C. aegagrus) is classified as a member of the order Artiodactyla and the family Bovidae. According to Naderi et al. (2008), C. aegagrus was one of the first artiodactyl species to be domesticated in the Fertile Crescent, more than 10,000 years ago, and is the ancestor of the domestic goat. While this species has both an economic and ecological importance, it is classified as vulnerable on the IUCN Red List (Weinberg, 2008; Weinberg and Ambarli, 2020).
C. aegagrus is a diurnal species. It easily climbs steep cliffs, rushes away from danger by leaping, grazes till late in the evening, and occasionally continues grazing during bright nights. During the day, it lies in the shadow of rocks, enormous caverns, and in dense forests, either ruminating or resting (Gündoğdu, 2011).
C. aegagrus is a threatened ungulate found only in mountainous settings in central Afghanistan, southern Pakistan, western Iran, northern Iraq, the Caucasus area (Armenia, Azerbaijan, northeastern Georgia, and southern Russia), and southwestern Türkiye (Weinberg et al. 2008). The species was originally recorded in Lebanon and Syria, the United Arab Emirates, and Jordan, but has since been extinct in these areas. In Türkiye, the species is found mostly on the steep slopes, mountain gorges, wooded hills, coniferous and Mediterranean shrubland of the Taurus and Anti-Taurus mountains, in Eastern, North-Eastern and steep mountainous areas of South East Anatolia (Turan 1987, Kence et al., 2002). C. aegagrus lives in rocky areas and thick forests at 1500 m or higher altitudes, according to Hus (1963, 1967) and Canakcioglu and Mol (1966). It was also stated that C. aegagrus preferred mountains with steep rocks, trees and shrubs, bushes and grass, ranging from the sea level to 3000 m altitude (Turan, 1987).
Illegal hunting is the major threat for C. aegagrus (Genov et al., 2009). Although steep slopes and ridges provide a suitable habitat for the species, overhunting has resulted in a significant decline in its population (Naderi et al., 2013). C. aegagrus faces additional threats from domestic livestock competition for food, as well as disturbance and habitat degradation caused by marble quarries and land clearing. Due to the long history of dense human settlement, the Mediterranean region and the Middle East are among the world's most damaged regions for C. aegagrus (Czudek, 2006; Genov et al, 2009). One of the primary reasons for the decline of wildlife is habitat degradation, which forces many species to exist in isolated and semi-isolated groups inside fragmented areas (Hirzel & Guisan, 2002).
C. aegagrus is the most widespread mammal species in Türkiye's Taurus Mountains. This species is considered a key wild prey item for Anatolian leopard (Panthera pardus tulliana) and the wolf (Canis lupus). Given the leopard's endangered status, analyzing the C. aegagrus' habitat is critical for the management and conservation activities from a variety of perspectives. Given that this species is included in the "Near Threatened" category of the IUCN Red List, it is essential to obtain more information about the factors affecting its habitat preferences (Weinberg 2008). Studies indicate that elevation, slope, and vegetation are very effective in the distribution of wild goats (Fook et al., 2009; Koohestani et al., 2022).
As a result, it has become crucial to identify suitable habitats and manage them accordingly. Nonetheless, there are several constraints, particularly when dealing with large-scale regions, such as limited time and limited finances, that make such studies difficult to conduct. Therefore, scientists developed several methodologies to facilitate such investigations, which are now frequently used in wildlife management (Peterson & Vargas, 1993). These models study the quantitative and qualitative link between species presence and environmental variables, as habitat quality is determined by the interactions of biological and non-biological variables (Kocev et al., 2010).
Today's strategies for determining optimal habitats for wild animals include modeling and mapping. Both presence and absence data can be used in modeling (Hirzel, et al., 2006; Wisz et al., 2008; Suel, et. al., 2018). MaxEnt is a presence-only modeling tool that has been proved to accurately predict animal distribution. This method performs admirably in terms of forecasting the spatial distribution of species and identifying their suitable habitats. The MaxEnt method is preferred for investigating correlations between variables that may have important effects on wild animal distribution, such as climate, environmental, and human factors. This method does not only show great model performance with small data, but it also allows the simultaneous use of categorical and continuous data (Phillips et al., 2006, Hernandez et al., 2006). The MaxEnt approach is based on the evaluation of habitat data gathered from the points where the occurrence of the wild animal species has been ascertained in the study area and then on revealing places with similar features, derived from the suitability model (Baldwin, 2009). There have been some studies to determine suitable habitats for C. aegagrus species in Türkiye. The results indicated that topographic variables, water and human resource availability, and vegetation cover were the most important factors influencing C. aegagrus habitat selection (Naderi et al., 2014; Sarhangzadeh et al., 2013; Shams Esfandabad et al., 2010).
In this paper, it has been revealed whether there are differences in the distribution of C. aegagrus in the region by modeling the data obtained in different periods. The Maximum Entropy (MaxEnt) modeling technique was employed to assess the habitat suitability of C. aegagrus, which is a significant species in the context of hunting activities within the region. In addition, poaching and marble quarrying activities also limit the distribution of the species. For this reason, it is important to determine the potential suitable areas of the species. The temporal (10-year period) variation of the population densities at the observation points will also be examined, which will allow the interpretation of the behavioral ecology of the species in the region.
MATERIJAL I METODE
Study area – Područje istraživanja
The present study was carried out in the province of Isparta, where the observation points are located within the Sütçüler and Eğirdir districts. C. aegagrus is distributed in Isparta only in these districts (Figure 1). It is known that the number of individuals of the species in these areas is quite high. This indicates a hunting potential for C. aegagrus that cannot be ignored. On the other hand, it has been stated that marble quarries known to exist in the area may also affect the distribution of the species. There are studies stating that poaching and marble quarry activities may affect the distribution of C. aegagrus (Gündoğdu, 2011).
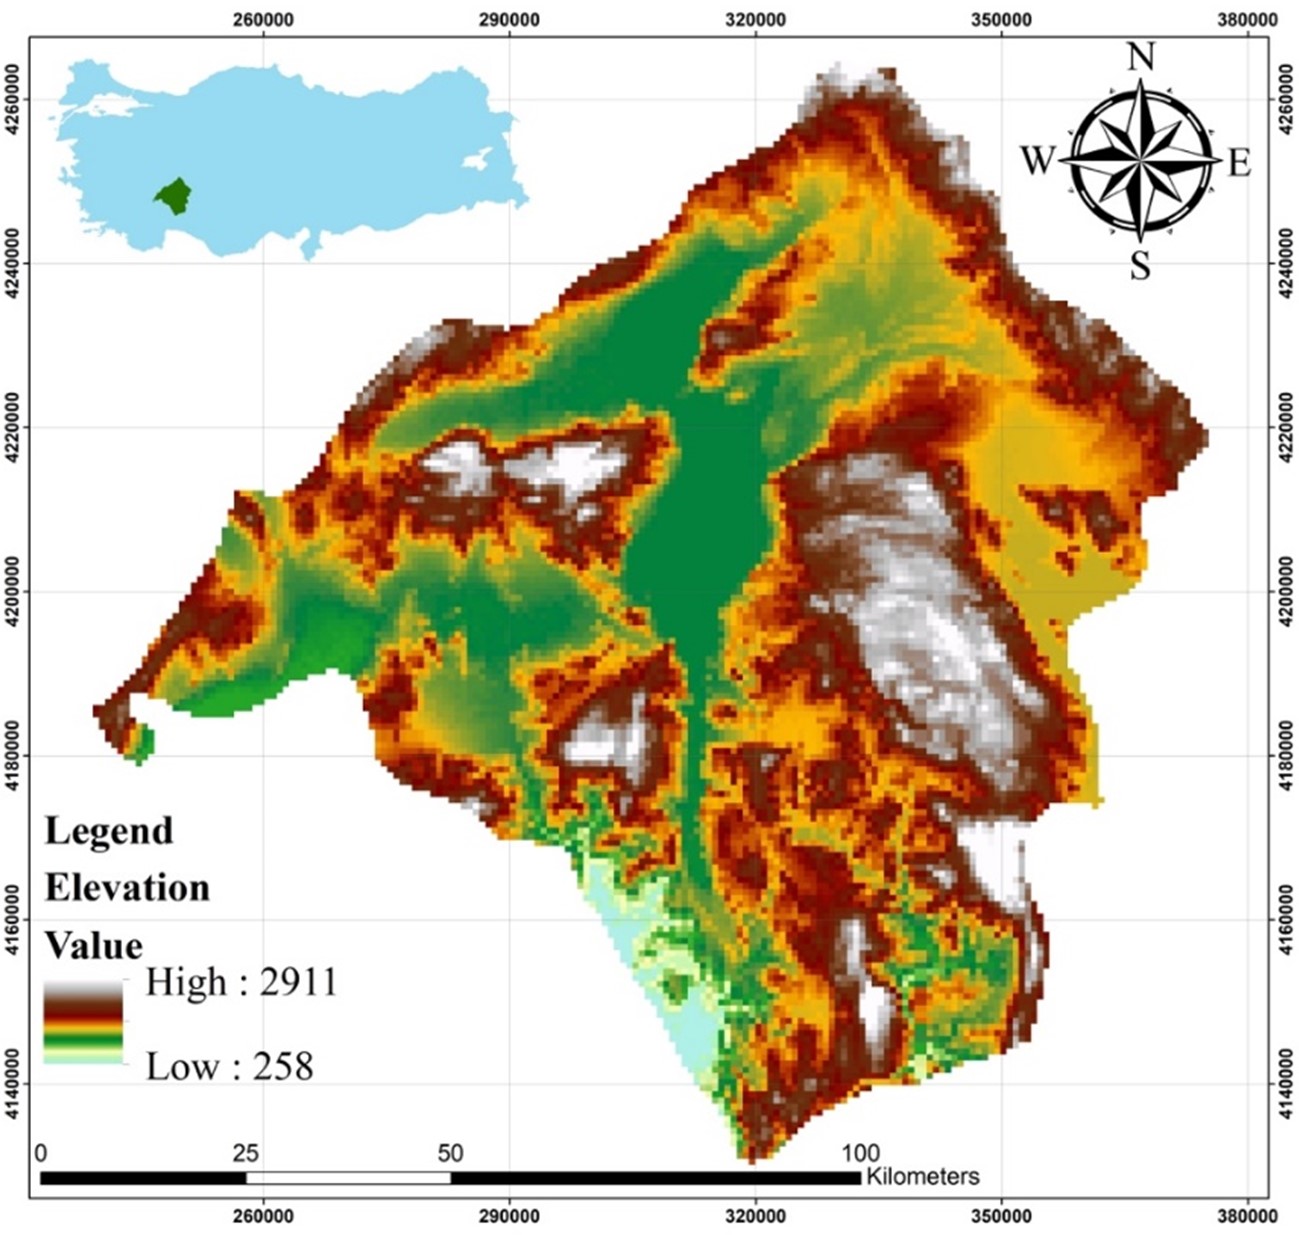
Figure 1. Location map of the study area
Slika 1. Karta lokacije područja istraživanja
Data collection – Prikupljanje podataka
In the modeling process, presence data obtained for C. aegagrus in 2009 and 2019 were used. Field studies were carried out in December and January in both years. These months are the mating season for C. aegagrus, during which both male and female individuals can be observed together. In other months, males are typically found in groups of 2-3 individuals, separate from the females. Following the month of February, a 5-month gestation period ensues, followed by a 4-5 month lactation period (Süel et al., 2017). Therefore, observations made during the months of December and January are considered the most appropriate method for representing the population of the species, and as evidenced by research, observations of wild goats are largely conducted during these months. In addition, previous studies conducted in the region have indicated that the species also frequents these areas in the months of June and August (Nixon et al., 1991; Ogurlu et al., 2013). Direct counting method was preferred in the observations of C. aegagrus. Observations were conducted at the same 40 locations in both 2009 and 2019. The presence data were recorded at 33 points in 2009 and 21 points in 2019. These observation points are areas regularly monitored for C. aegagrus sightings due to the species' consistent preference for them throughout the year. The observation data at these points were obtained over the years as it was determined that they represent some of the natural habitats of the species. Observations were made twice a day, at sunrise and in the afternoon. Simultaneous observations were made at all points in order to avoid a recurrence caused by the census of the same species. Observation points were chosen in such a way that there would be no repetitions according to the movement route of the species, and the observers were prevented from moving along the observation points by coordinating re-counting. The highest number of observations was taken into account in the counting carried out simultaneously at each observation point.
Environmental variables and variable selection – Varijable okoline i izbor varijabli
In the present study, as a topographic variable, the elevation variable was first downloaded from the USGS database (www.earthexplorer.usgs.gov). Then, slope, ruggedness, hillshade, and topographic position index layers were created by using the elevation map in ArcMap software. In the next step, layers for the aspect suitability index (Aspsui), heat index (Heatind), and radiation index (Radind) were created with the formulas from the literature.
(3.1)
In the equation above, corresponds to the aspect value that can take the highest numerical value in terms of the equation, 45o, and corresponds to the aspect value. However, the aspect values in degree format were converted to radian format and the calculated Bui values ranged from 0 to 2 (Beers et al., 1966).
(3.3)
In the equation, represents the aspect value in radians, while the value of 202.5 represents the direction between the south and southwest directions and corresponds to the highest heat load (Zeleny, Chytry, 2007).
(3.2)
In the equation, corresponds to the aspect. Radiation index values vary between 0 and 1, and while the areas in the north-northeast direction, which is the coldest and rainiest direction, converge to 0, the values approach 1 towards the hotter and drier south-southwest direction (Moisen, Frescino, 2002).
A set of 19 bioclimatic variables was obtained from the WorldClim database (www.worldclim.org/data/worldclim1.html) version 2.1 (for the period 1970-2000) with 30 arc seconds spatial resolutions (~1 km). Finally, a total of 24 variables were obtained to be used in the modeling process.
To avoid the multicollinearity problem, Pearson's correlation analysis was performed on 24 environmental variables. After the variables that were highly correlated (Pearson's r ≥ 0.8) with each other were determined, the chosen variables were evaluated. Next, a selection was made among the variables, considering their ease of interpretation, explanatory power, and biological importance for C. aegagrus (Özdemir et al., 2020; Zhang et al., 2021c).
Habitat suitability modeling – Modeliranje prikladnosti staništa
MaxEnt Version 3.3.3 (Phillips et al., 2006) was employed in this study due to its better performance with small sample sizes compared to other modeling methods (Elith et al., 2011; Qin et al., 2017; Hussein and Workeneh, 2021). Due to the limited number of presence data in this study, the selection of MaxEnt was inevitable. MaxEnt method runs with presence-only data to predict the potential distribution areas of a target species based on the theory of maximum entropy. In the modeling process, we selected 90% data for model training and 10% for model testing with bootstrap options, keeping other values as default. One of the leading advantages of maximum entropy bootstrap is the ability of the model to generate the values beyond extreme (Srivastas and Simonovic, 2015). Besides, the area under the curve (AUC) is used to evaluate model performance. The value of AUC ranges from 0 to 1. An AUC value of 0.50 indicates that the model did not perform better than random, whereas a value of 1.0 indicates perfect discrimination. The model with the highest AUC value is indicated as the best performer (Yang et al., 2013).
REZULTATI
In the present study, observations of C. aegagrus species were performed at 40 points in two different periods. Presence data were recorded at 33 points in 2009 and at 21 points in 2019. The number of species determined at the observation points is given in Figure 2.
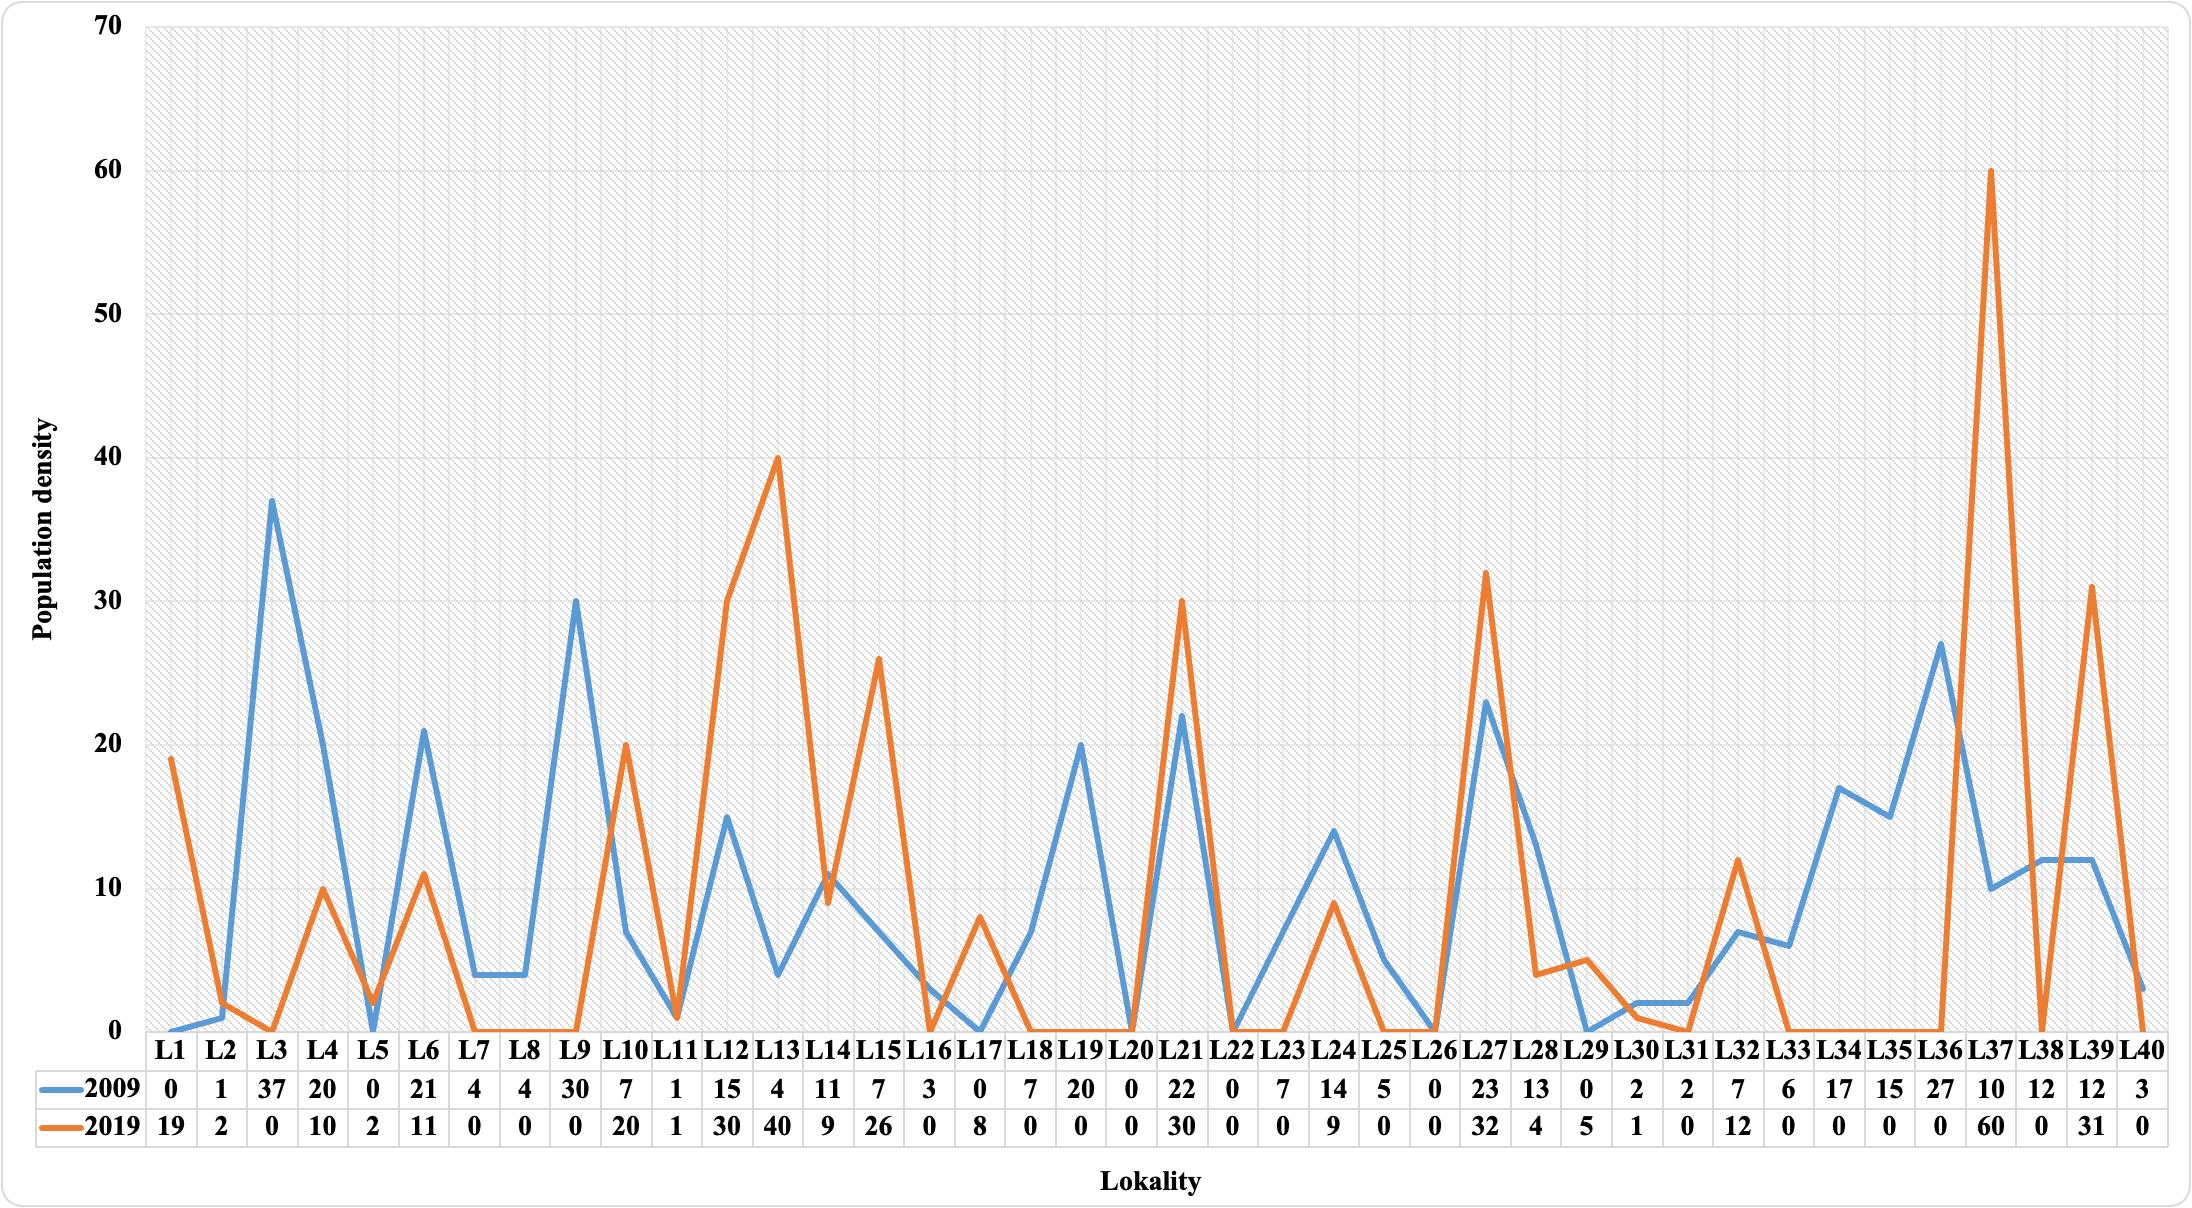
Figure 2. The number of individuals of C. aegagrus species detected in the years 2009 and 2019
Slika 2. Broj jedinki vrste C. aegagrus zabilježenih 2009. i 2019. godine
As seen in Figure 2, the number of individuals differs according to the observation points. In fact, in some areas where data has been recorded in the past, none of the studied individuals will be observed in the future, while the opposite is the case at some points. In other words, as seen in Figure 2, the species was observed on some plots in 2009, but no data was recorded in 2019. On some plots, the opposite results were observed. Although this is not a definitive indicator, it shows that the habitat of the species in the area may have changed over time. Because it is based only on observation, statistics and modeling results are required to interpret the model in general. Therefore, in the ongoing process, species distributions were modeled separately for both periods.
Habitat suitability modeling using presence data of C. aegagrus from 2009 – Modeliranje prikladnosti staništa korištenjem podataka o prisutnosti C. aegagrus iz 2009.
First modeling step was carried out using 33 presence data obtained from 40 observation points in 2009. Before the modeling process, Pearson's correlation analysis was applied in order to prevent the multicollinearity problem that may occur due to the high correlation between the variables. Analysis results are given in Figure 3.
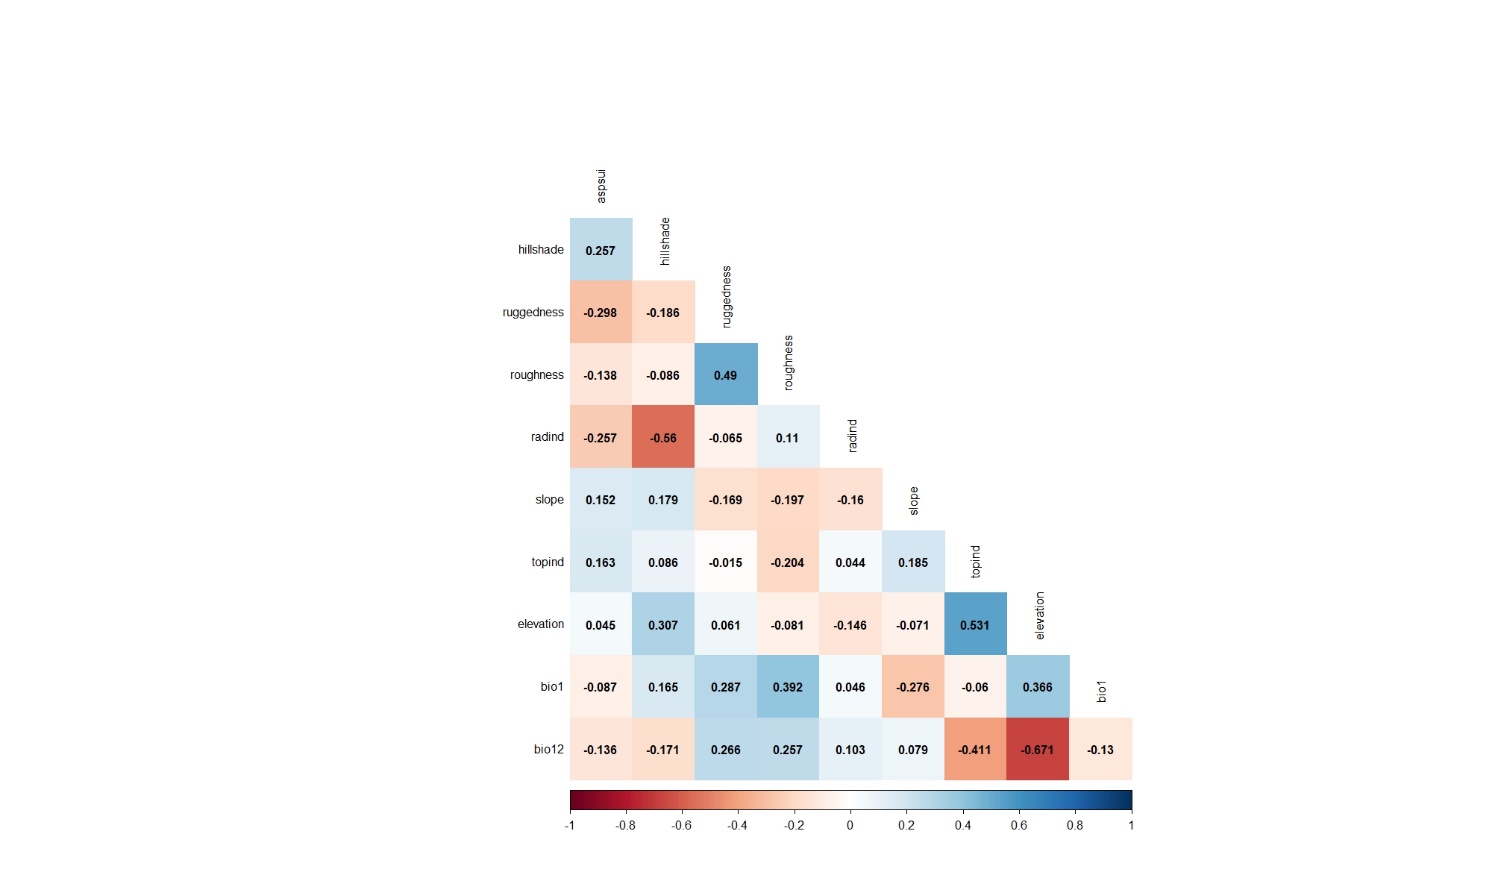
Figure 3. Pearson's correlation analysis results applied for the variables belonging to the observation points whose presence data were recorded in 2009
Slika 3. Rezultati Pearsonove korelacijske analize primijenjeni na varijable koje pripadaju promatranim lokacijama na kojima je prisutnost vrste zabilježena 2009. godine
As seen from the correlation analysis results, 9 variables (hillshade, ruggedness, roughness, radind, slope, topind, elevation, bio1, bio12) were selected and included in the modeling process. The model's training and test AUC values were determined as 0.990 and 0.987, respectively (Figure 4).
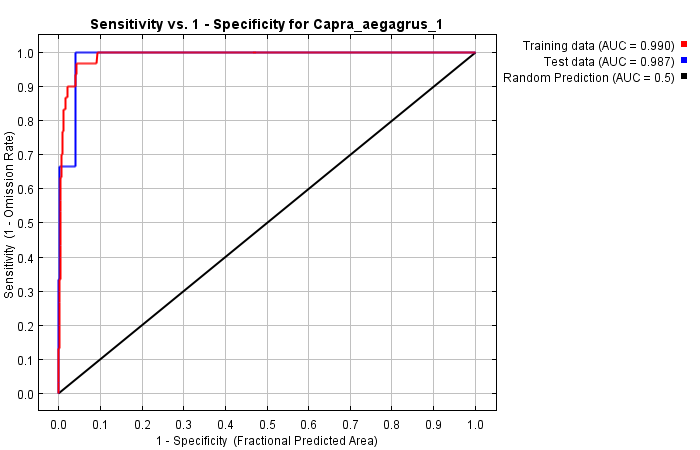
Figure 4. ROC curve of the model obtained with MaxEnt for 2009 for C. aegagrus
Slika 4. ROC krivulja modela dobivenog pomoću MaxEnt modela za 2009. za C. aegagrus
The percent contribution of the variables created the model and the results of the jackknife test are presented in Figure 5 and Figure 6, respectively.
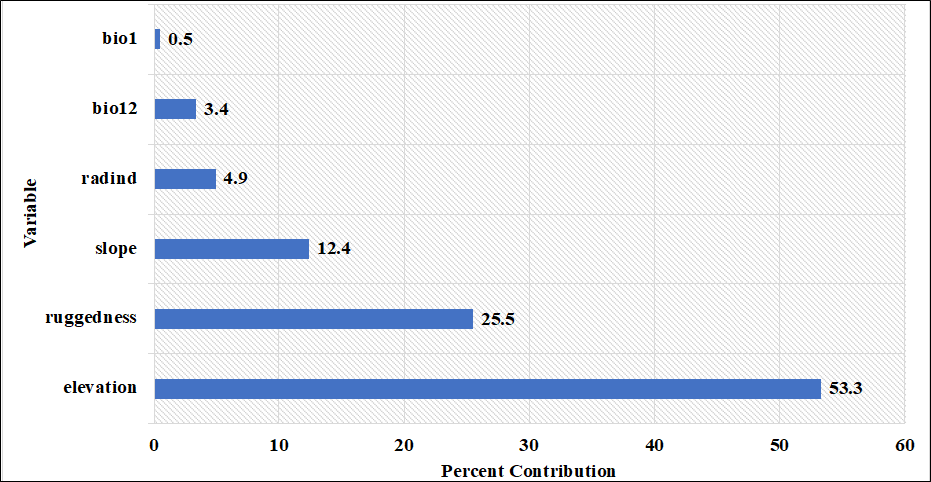
Figure 5. Percent contributions of the variables acquired by MaxEnt model using C. aegagrus presence data from 2009.
Slika 5. Postotni doprinosi varijabli dobivenih MaxEnt modelom koristeći podatke o prisutnosti C. aegagrus iz 2009.
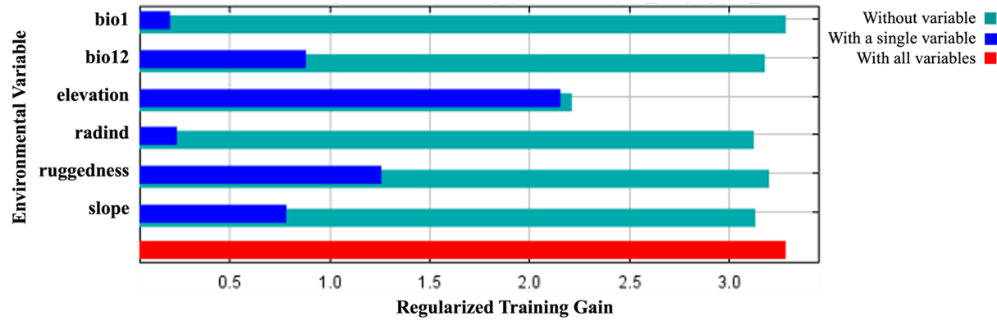
Figure 6. The results of the jackknife test acquired by MaxEnt modeling using C. aegagrus presence data from 2009
Slika 6. Rezultati jackknife testa dobiveni MaxEnt modelom koristeći podatke o prisutnosti C. aegagrus iz 2009.
When the results obtained were examined, the variables contributing to the model were determined as elevation, ruggedness, slope, radiation index, bio12 and bio1, respectively, based on their percentage contributions. The marginal response curves of these variables are presented in Figure 7.
Figure 7. Marginal response curves acquired by MaxEnt modeling using C. aegagrus presence data from 2009
Slika 7. Krivulje graničnog odgovora dobivene MaxEnt modelom koristeći podatke o prisutnosti C. aegagrus iz 2009.
The habitat suitability map obtained for the C. aegagrus using the presence data of 2009 is given in Figure 8.
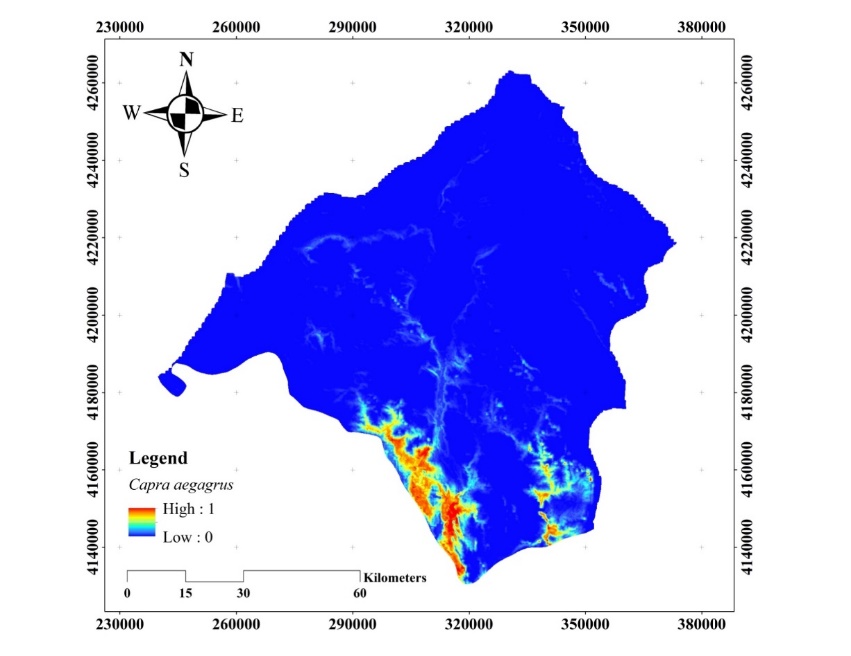
Figure 8. Habitat suitability map of C. aegagrus (2009)
Slika 8. Karta prikladnosti staništa C. aegagrus (2009.)
Habitat suitability modeling using presence data of C. aegagrus from 2019 – Modeliranje prikladnosti staništa korištenjem podataka o prisutnosti C. aegagrus iz 2019.
As can be seen from the results of the Pearson's correlation analysis applied for the variables belonging to the data of 2019, 9 variables (hillshade, ruggedness, roughness, radind, slope, topind, elevation, bio1, bio12) were selected and included in the modeling process (Figure 9).
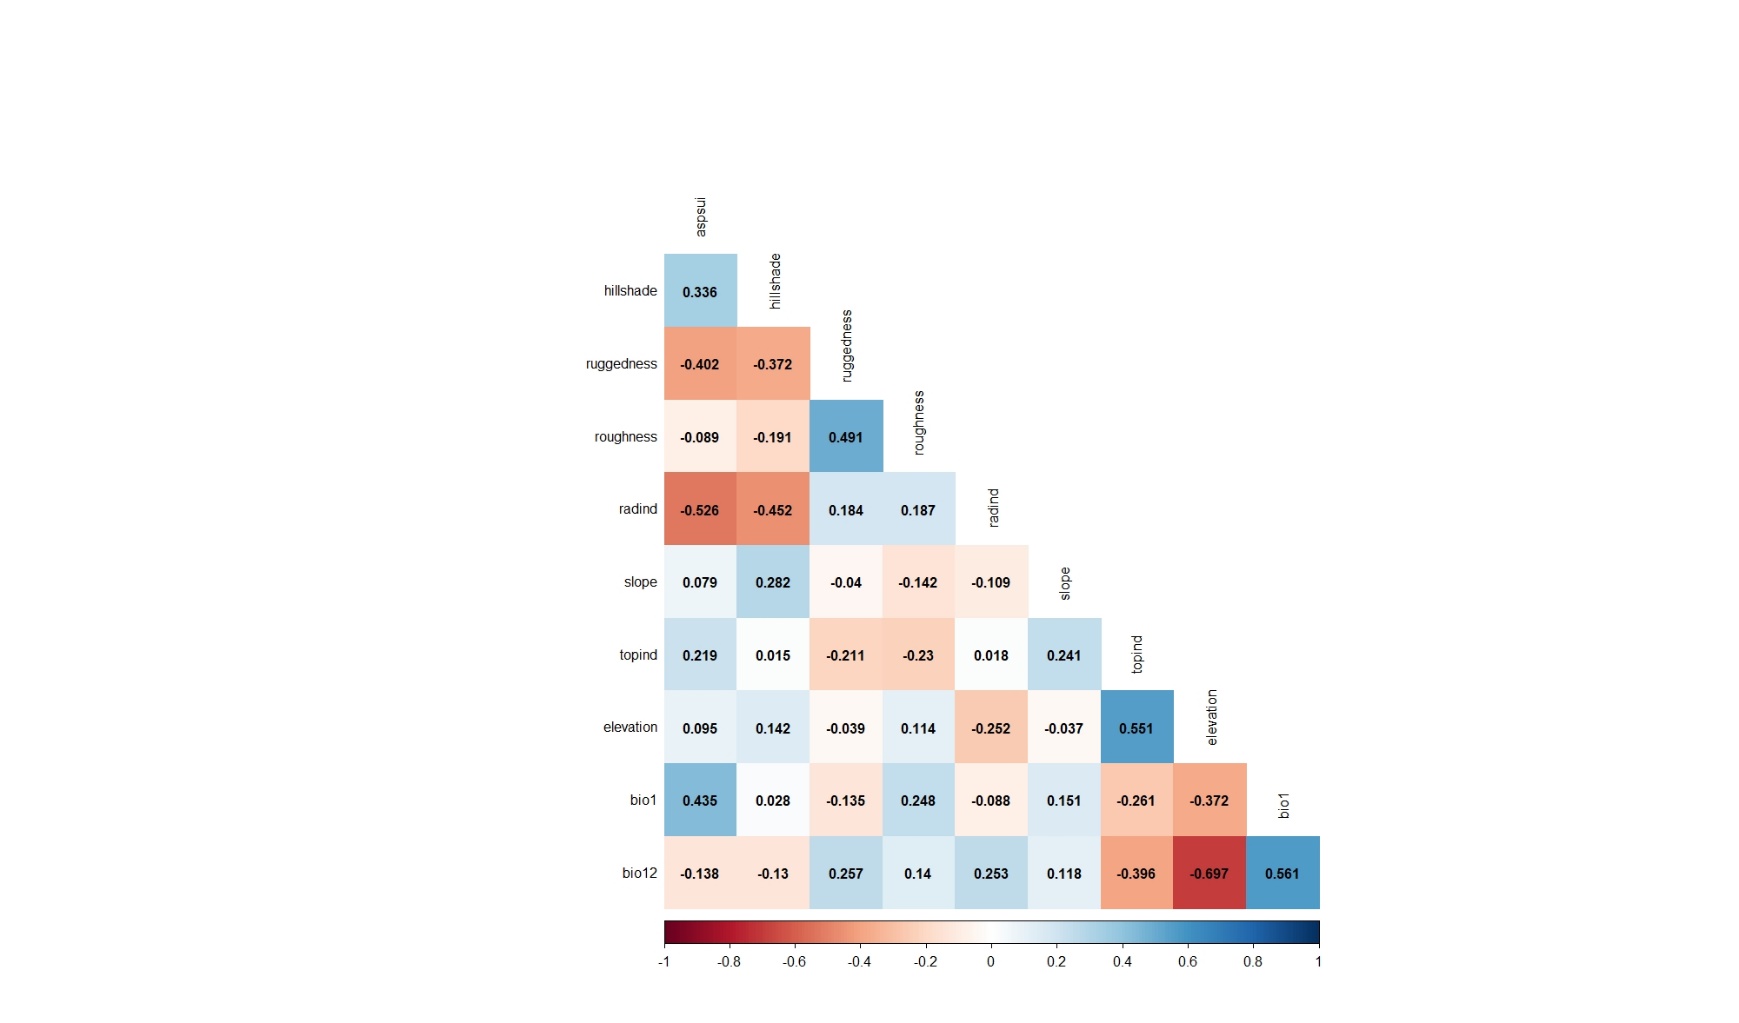
Figure 9. Pearson's correlation analysis results applied for the variables belonging to the observation points whose presence data were recorded in 2019
Slika 9. Rezultati Pearsonove korelacijske analize primijenjeni za varijable koje pripadaju promatranim lokacijama na kojima je prisutnost vrste zabilježena 2019. godine
As a result of the modeling applied with the selected variables, the training and test AUC values were determined as 0.987 and 0.978, respectively (Figure 10).
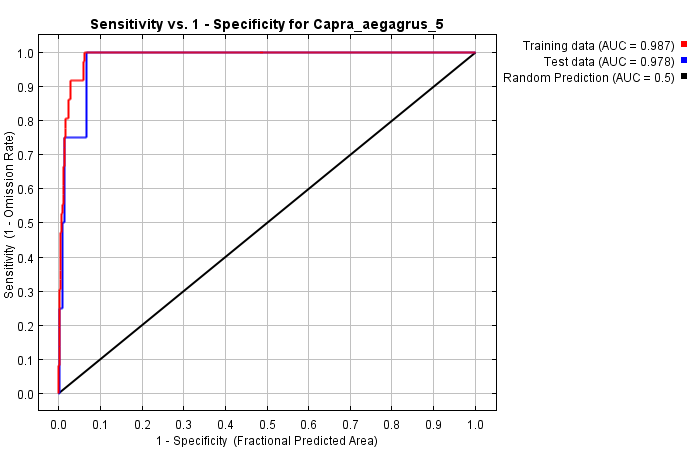
Figure 10. ROC curve of the model obtained with MaxEnt for 2019 for C. aegagrus
Slika 10. ROC krivulja modela dobivenog pomoću MaxEnt modela za 2019. za C. aegagrus
The percent contributions of the variables that created the habitat suitability model and the results of the jackknife test are presented in Figure 11 and Figure 12, respectively.
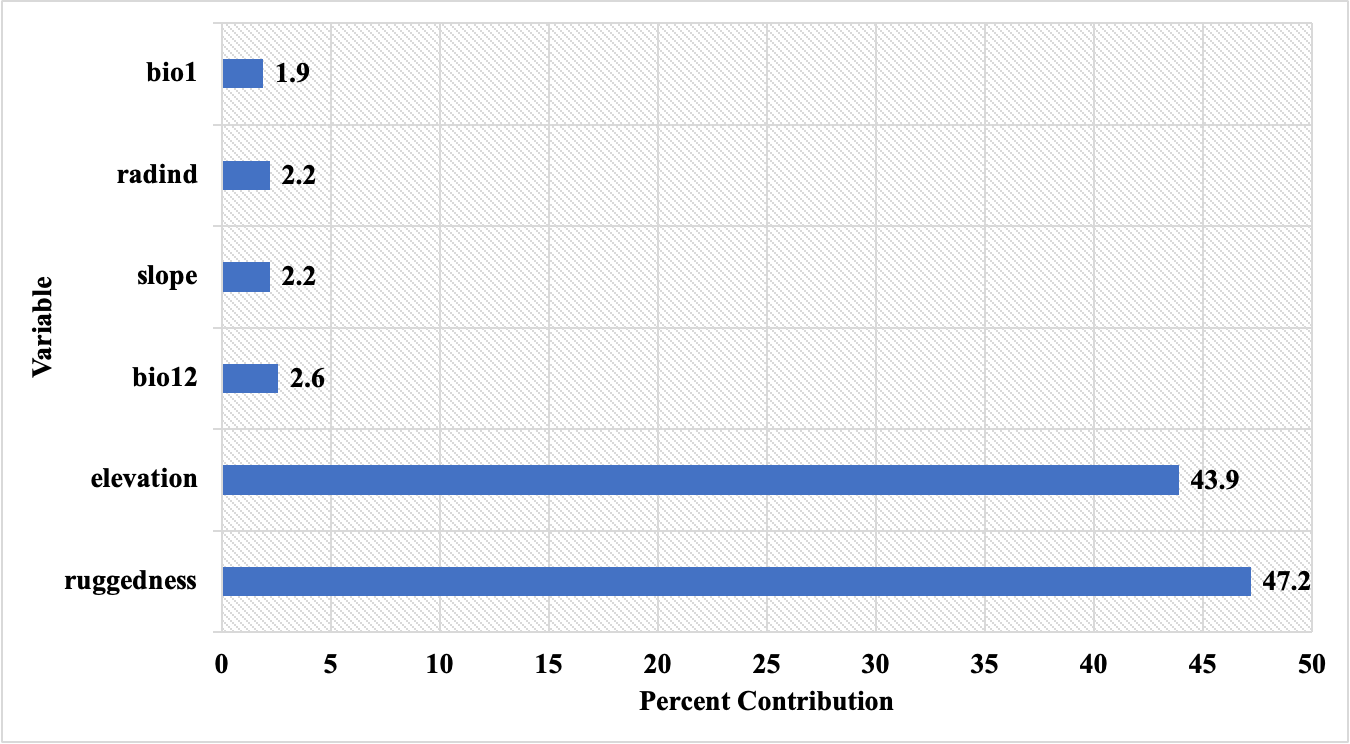
Figure 11. Percent contributions of the variables acquired by MaxEnt model using C. aegagrus presence data from 2019
Slika 11. Postotni doprinosi varijabli dobivenih MaxEnt modelom koristeći podatke o prisutnosti C. aegagrus iz 2019.
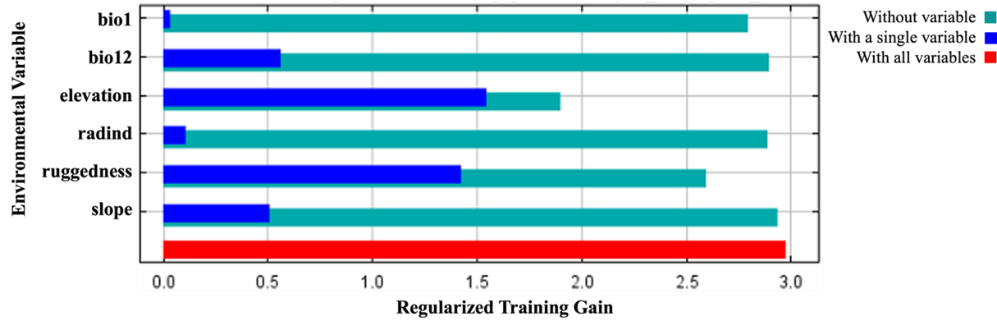
Figure 12. The results of the jackknife test acquired by MaxEnt modeling using C. aegagrus presence data from 2019
Slika 12. Rezultati jackknife testa dobiveni MaxEnt modelom koristeći podatke o prisutnosti C. aegagrus iz 2019.
When the results were examined, it was noted that the variables that created the model were similar to the previous model. The variables that shaped the model were determined as ruggedness, elevation, bio12, slope, radiation index, and bio1, respectively, according to their percent contributions. The marginal response curves of these variables are presented in Figure 13.
Figure 13. Marginal response curves acquired by MaxEnt modeling using C. aegagrus presence data from 2019
Slika 13. Krivulje graničnog odgovora dobivene MaxEnt modelom koristeći podatke o prisutnosti C. aegagrus iz 2019.
The habitat suitability map obtained with the C. aegagrus data from 2019 is given in Figure 14.

Figure 14. Potential distribution map of C. aegagrus (2019)
Slika 14. Karta potencijalne distribucije C. aegagrus (2019.)
Habitat suitability maps of C. aegagrus at 0.5 threshold – Karte prikladnosti staništa C. aegagrus s graničnom vrijednošću od 0,5
In the last step, habitat suitability maps consisting of two colors and showing suitable and unsuitable areas were created. The threshold value of 0.5 was used when obtaining these maps (Figure 15).
Figure 15. Habitat suitability map of C. aegagrus at 0.5 threshold
Slika 15. Karta prikladnosti staništa C. aegagrus s graničnom vrijednošću od 0,5
When comparing the thresholded habitat suitability maps obtained for the years 2009 and 2019, it was found that there was a 2,659-hectare increase in the area over the 10-year period (Figure 16).
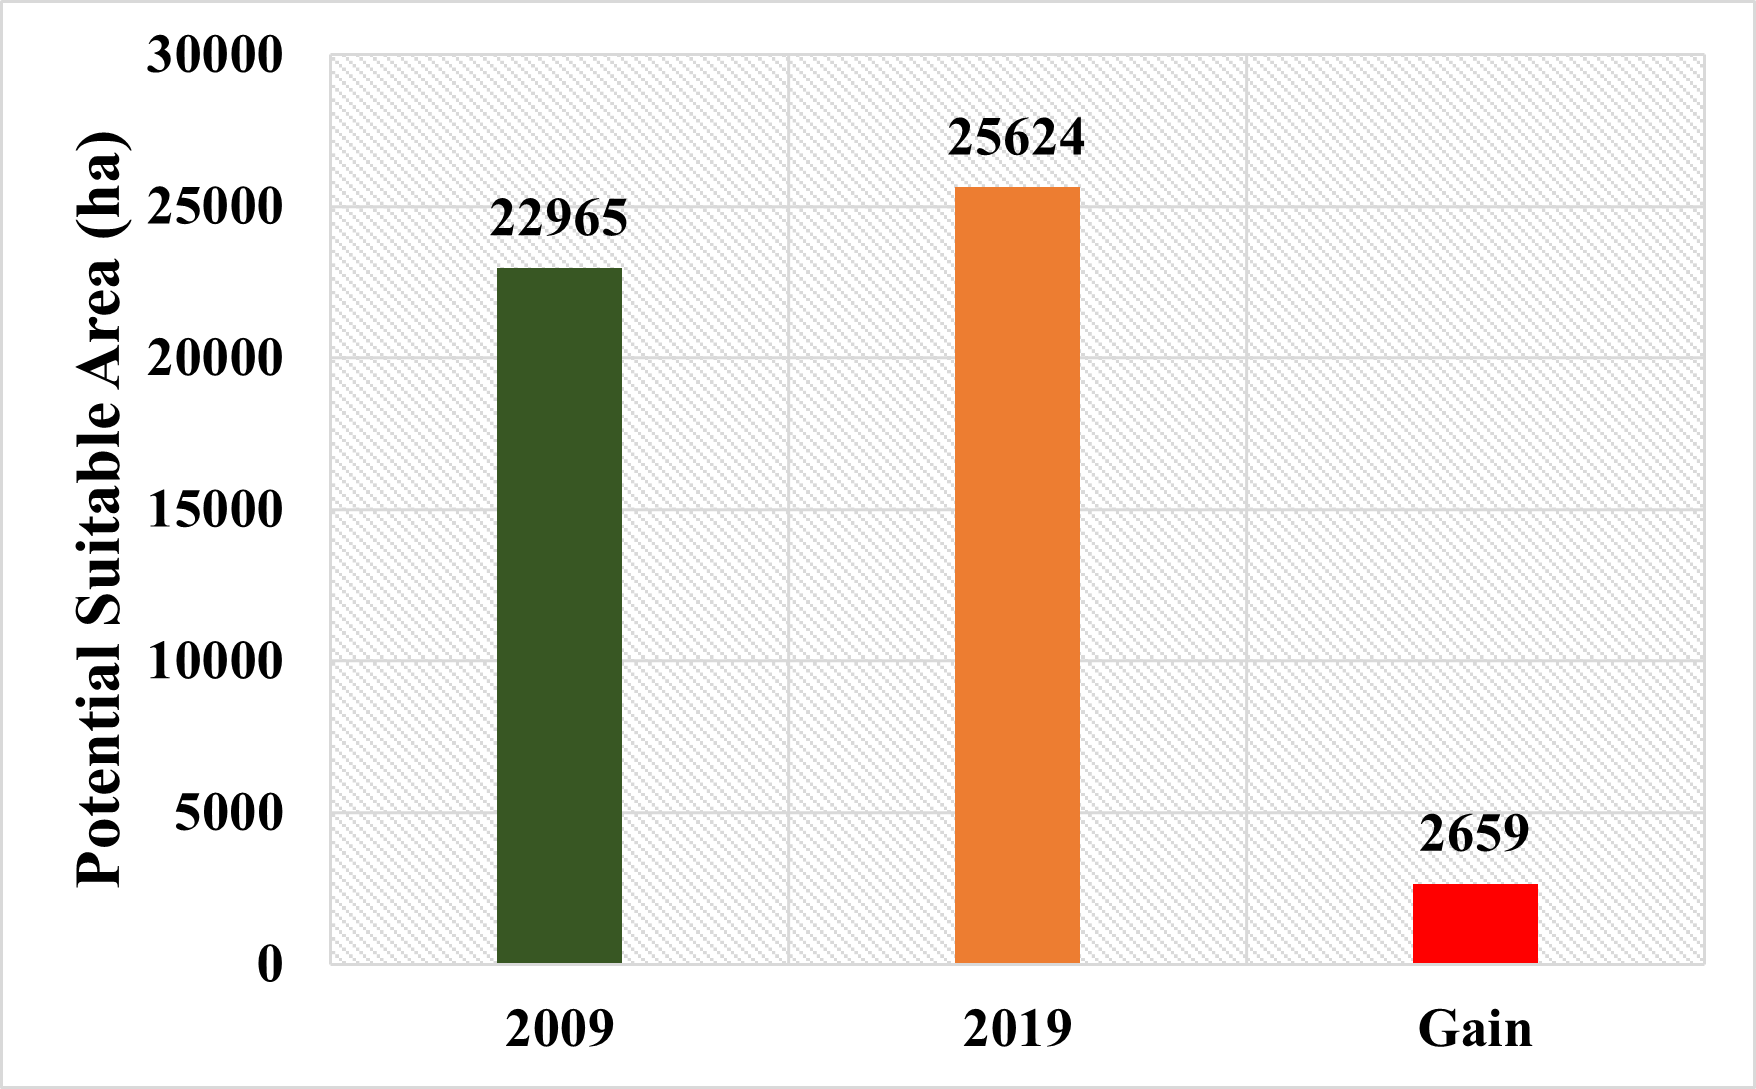
Figure 16. Possible gains in habitat suitability areas (ha)
Slika 16. Mogući dobici u područjima prikladnih staništa (ha)
RASPRAVA I ZAKLJUČCI
There are lots of mammalian wild animal species that are distributed in areas with different topographical features on the Earth. However, there are not enough studies on most of them (Tian et al., 2019; Chirichella et al., 2022; Koohestani et al., 2022). While some species are distributed over large areas, some species continue to exist in limited areas. There may be one or more habitat preferences that limit the distribution of species in local areas. Determination of the preferences of species with both large and limited distribution is important in terms of sustainability of the species since the determination of these features can provide an insight for assessing the distribution of species and perhaps give an opportunity to interpret the factors affecting these distributions over time. C. aegagrus is an excellent example that can serve as a material for the mentioned subject. C. aegagrus is a species mostly distributed in high elevation and karst areas. In addition, karst areas with the form of limestone bedrock are the intense preference of the species.
In the present study, the distribution areas of the C. aegagrus populations distributed in the Isparta province in Türkiye were determined as belonging to two different time periods (2009 and 2019). Potential distribution maps obtained for two different periods are quite similar to each other. The southwest part of Isparta and some local areas in the southeast represent potential distribution areas of the species. The variables that shape habitat suitability maps are bio1, bio12, elevation, radiation index, ruggedness, and slope. Among these, the variables that contribute the most to both models alone are elevation and ruggedness. These results are aligned with information reported in the literature (Gündoğdu and Oğurlu, 2009; Süel et al., 2019; Koohestani et al., 2022). Süel et al. (2018) also presented predictable results in this regard. The researchers' results revealed significant relationships between the habitat suitability of the C. aegagrus species and the bedrock, ruggedness, and elevation.
Two different models were obtained using the presence data from 30 locations in two different periods. It is known that there are many anthropogenic factors limiting the distribution of the species, especially the marble quarries in the research area. In particular, illegal hunting is one of the leading aforementioned factors (Weinberg et al. 2008; Gündoğdu 2011; Al Sheikhly et al. 2015). Ecological interpretations can be made regarding these variables. However, it is a disadvantage that they cannot be included in the models due to the lack of digital bases.
While the existence of the species was in question in some locations in 2009, there were local-scale shifts in the spread of the species in 2019. However, the similarity of the two different maps revealed that the species remained relatively close to its characteristic suitable areas and there was an increase of 2,659 ha in potential suitable areas. This increase in suitable habitats has been interpreted in two ways. First, the species expanded its distribution towards different areas by showing flexibility in its habitat characteristics due to anthropogenic effects. The other is that the potential suitable areas of the species change over time in terms of precipitation and temperature parameters that create the model. It is thought that both scenarios may have dramatic consequences for the species in the future and may lead to radical changes. For this reason, applying conservation strategies for the species in the form in a strict framework will make the population of the species relatively more resistant to the consequences it may be exposed to due to the climate crisis.