
INTRODUCTION
UVOD
Site properties classification is of great importance for fast and effective operational, managerial, and strategic decision-making processes in forest areas. Site properties classification is a kind of decision support system that enables taking the right steps for many situations such as increasing the average yield per unit area in forests, reducing production costs, reducing rotation age, taking effective protection measures against global threats, increasing land use and product diversity (Louw and Scholes, 2002). In forests with large ecological differences at short distances or small scales, site properties classifications are needed, especially in terms of sustainable forest management and increasing productivity with correct silvicultural practices (Ray and Broome, 2001). In other words, site properties classification provides practitioners with the necessary logical units for sustainable forest management (Pokharel and Dech, 2011). Studies on forest site classification are generally based on the relationship between physiographic conditions, soil properties, and climate with vegetation (Smalley, 1986; Jones, 1994). These factors directly affect the structure, composition, and productivity of vegetation in forests (Barnes et al., 1982). They therefore provide the basic descriptive information needed for forest site classification. As a matter of fact, by including vegetation as a dependent variable and independent variables as descriptive variables, the work is subject to a hierarchical modelling based on ecological land classification.
Forest site properties classification is an objective and analytical method that became widespread in the 1990s (Bathgate, 2017). In the past, forest site properties classification studies were based only on abiotic factors and their specific relationships with living organisms in the environment, whereas today, analytical and hierarchical modelling based on ecological land classification studies that include multivariate methods have been developed. Turkey has a significant history in the forestry sector, and its forests play a crucial role in natural resource management. Forest management strategies in Turkey are not only focused on wood production but also provide many ecosystem services. Therefore, it is necessary to adopt and implement innovative methods and approaches in the industry. Model-based ecological and analytical land classifications and maps need to be created to make the right decisions in the country's forests, where environmental factors vary greatly (Özkan, 2014). In particular, maps of forest site properties offer great convenience in transferring the results of scientific research to the end users (Louw and Scholes, 2002). Studies including objective, realistic, and model- based information and maps for Turkey's forests are becoming more prevalent in the literature (Özkan and Gülsoy, 2010; Özkan and Mert, 2011; Özkan et al., 2013). Although various studies have been conducted, there are still relatively few studies on hierarchical modelling based on ecological land classification in Turkey. However, as stated above,
ecosystems can be understood and defined more easily thanks to hierarchical modelling based on ecological land classification studies using analytical processes. This result provides valuable information in terms of forecasting, especially in forestry activities involving ecology-based information. Thus, starting from the decision-making stage in forestry activities, model-based ecological land classification studies help to organise the working stages such as implementation, supervision, benchmarking and planning in the right way. Outputs of these studies provide practitioners with practical, useful, and accurate information, as well as unparalleled benefits in terms of money, labour, and time. Therefore, research on this subject should continue, new approaches should be tested and practices in different countries should be reviewed (Hirsch et al., 1978).
In line with this information, woody vegetation and environmental factors were modelled on the basis of analytical-hierarchical approach in this study. Hierarchical modelling based on ecological land classification and mapping were carried out within this study conducted in the Gölhisar district, which can be described as an important forest region in Turkey. The aim of the study was that the model information and maps obtained from the study would constitute the basic ecology-based information in the stages of operation, protection, and sustainability in the forest areas of the whole country, mainly in the forestry practices in the region.
MATERIALS AND METHODS
MATERIJALI I METODE
Site description – Opis područja
The study area included the districts of Gölhisar, Çavdır, Tefenni, Altınyayla in Burdur and a part of the district of Fethiye in Muğla, and Çameli in Denizli. The study area is located between the eastern longitudes of 35º 44′ 54″ - 35º 19′ 27″ and the northern latitudes of 36º 44′ 03″ - 37º 21′ 33″. In the district, elevation varies between 540-2300 meters. The study area is located in the southwestern part of the Boncuk Mountains, in the western region of the Akdağ Mountains, and in the southern part of the Eren Mountains. It has been stated that the study area is especially rich in terms of vegetation diversity in previous studies carried out in and around the region Edilmiştir (Çetin and Seçmen 2008; Negiz, 2013). The district covers a total area of 252680 ha, of which 136743 ha are forest areas. Crimean juniper (Juniperus excelsa), black pine (Pinus nigra), oaks (Quercus cerris, Quercus coccifera), brutian pine (Pinus brutia) and Taurus cedar (Cedrus libani) are the most common tree species. The study area and its surroundings within the borders of the Göller region generally represent the characteristics of the Mediterranean climate zone. However, since the region is located in a transition zone between the Mediterranean climate and the continental climate, transitional climate characteristics have also been observed. The average annual temperature in the study area is 12.6ºC and the annual precipitation is
634.9 mm (GDSM, 2011; Negiz, 2013). Regarding the geological structure of the Gölhisar district, it has been determined that there are three units belonging to Lycian, Middle- Upper Miocene, and Gölhisar formations in the age range from Mesozoic to the present. These formations include limestone, sandstone, coarse-grained conglomerate, marl and ophiolite bedrock types (Elitez, 2010; Varol, 2011). Considering the area where the study was carried out, it shows poor characteristics in terms of soil properties due to the fact that most of it is sloped and rugged.
Field study – Terenska istraživanja
In this study, as suggested in many forest ecology studies (Fontaine et al., 2007; Özkan and Gülsoy, 2010; Gülsoy et al., 2017; Negiz and Kurt, 2017), the data were collected in 400 sub-sample areas (100 sample areas with 4 sub-samples per sample area), each of which was 20x20 m in size. The sample areas were distributed as homogeneously as possible to represent the study area, considering the differences in site characteristics such as elevation, slope, and aspect. Only woody species (tree and shrub species) in the sample areas were recorded according to the Braun-Blanquet scale (r,+,1,2,3,4,5) (Braun- Blanquet, 1947; Çepel, 1995; Fontaine et al., 2007; Özkan, 2009).
Environmental variables – Okolišne varijable
In statistical evaluations, environmental variables need to be created in order to obtain models and maps. In this context, aspect, slope, and elevation variables were created in a raster format by using the digital elevation model of the Gölhisar district. In order to present the landform structure of the study area, a topographic position index map was created using the “Topographic Tools” extension (Jennes, 2006). Considering the study area, each bedrock type in the lithology map obtained from the General Directorate of Mineral Research and Exploration was drawn as a polygon and bedrock types were recorded in the attribute table. In the final stage, the vector-featured bedrock types were exported in a raster format by the conversion tools. Radiation index values were calculated by using cellular values of the aspect variable created for the study area in the equation: Radiation Index = [1 – cos ((π / 180) × (θ – 30))] / 2. In the equation, θ represents the aspect values and the obtained values vary in the range of 0–1. The value “0” represents the slopes in the north-northeast direction, and the value “1” represents the hotter and drier south-southwest slopes (Moisen and Frescino, 2002; Aertsen et al., 2010). Likewise, heat index values were calculated by using the cellular values of the slope and aspect variables created for the study area in the equation: Heat Index = cos(radyan(θ−202.5) × (tan(radyan(∆)))). In the equation, θ represents the aspect values, while ∆ represents the slope values. The values obtained as a result of the equation vary between -1 and 1 (Parker, 1988; Olsson et al., 2009).
At the last stage, radiation index and heat index variables were created in a raster format
by using the “Point to Raster” tool in ArcMap 10.2 software, based on the cellular values of the equations calculated for the study area.
Statistical evaluation – Statistička analiza
In the statistical evaluation process, firstly, cluster analysis and indicator analysis, classification tree technique in the modelling stage, and chi-square test were used in the process of testing the success of the fit of the groups obtained as a result of the clustering analysis to the model groups (Cole, 1949; Fontaine et al., 2007; Özkan and Gülsoy, 2010). In the mapping process of the created models, ArcMap 10.2 software was used.
In the study, using the vegetation data matrix, the distinction of vegetation groups in the region was carried out via cluster analysis. The clustering groups obtained were divided into two different groups from the first level distinction of the district. The two separated groups were accepted as dependent variables and modelled with the classification tree technique using the environmental data matrix (De’ath and Fabricius, 2000; Moisen, 2008; Özkan, 2012). It was mapped using the obtained tree model. Finally, the chi-square test was applied to determine the relationship between the groups obtained from the cluster analysis and the model groups obtained from the classification tree technique. When a significant relationship (p<0.05) was determined as a result of the chi-square test, further stages of distinction were initiated. When a significant relationship could not be detected among groups/subgroups, the distinction was terminated. Throughout all stages, each group or subgroup was mapped and visualized. Thus, hierarchical modelling based on ecological land classification and mapping for the Gölhisar district was completed.
RESULTS
REZULTATI
As a result of field studies, a total of 131 different tree and shrub species were identified in 400 sub-sample areas in the Gölhisar district. Prior to the statistical evaluation process aimed at separating vegetation groups, 73 plant species with a frequency value of less than 5% were excluded from the vegetation data matrix, among the 131 plant species that were determined. After excluding the plant species, modelling processes continued with the remaining 398 sub-sample areas.
As a result of field studies in the district, it was determined that the woody plant species with the highest frequencies were respectively Juniperus oxycedrus subsp. oxycedrus (76.5%), Berberis crataegina (49.75%), Juniperus excelsa (48.5%), Verbascum cariense (48.25%), and Quercus coccifera (39.5%). Furthermore, characteristic plant species specific to each sub- region group were identified at each distinction level. The most significant indicator plant species and their indicative values for the sub-region groups are presented in Table 1.
Table 1. Indicator plant species in the sample areas and their indicative values
Tablica 1. Indikatorske biljne vrste na uzorkovanim površinama i njihove indikativne vrijednosti
First Distinction Level - Prva razina razlikovanja
The first group division was performed as a result of cluster analysis (Euclidean – Ward’s method) applied to the data matrix of woody plant species with a frequency of 5% or higher obtained from 398 sample areas. In the resulting dendrogram, sample areas were divided into two cluster groups from the first distinction level onwards. Of these, a total of 255 sample areas were included in the first cluster group (District Class 1), while 143 sample areas were in the second cluster group (District Class 2) (Figure 1).
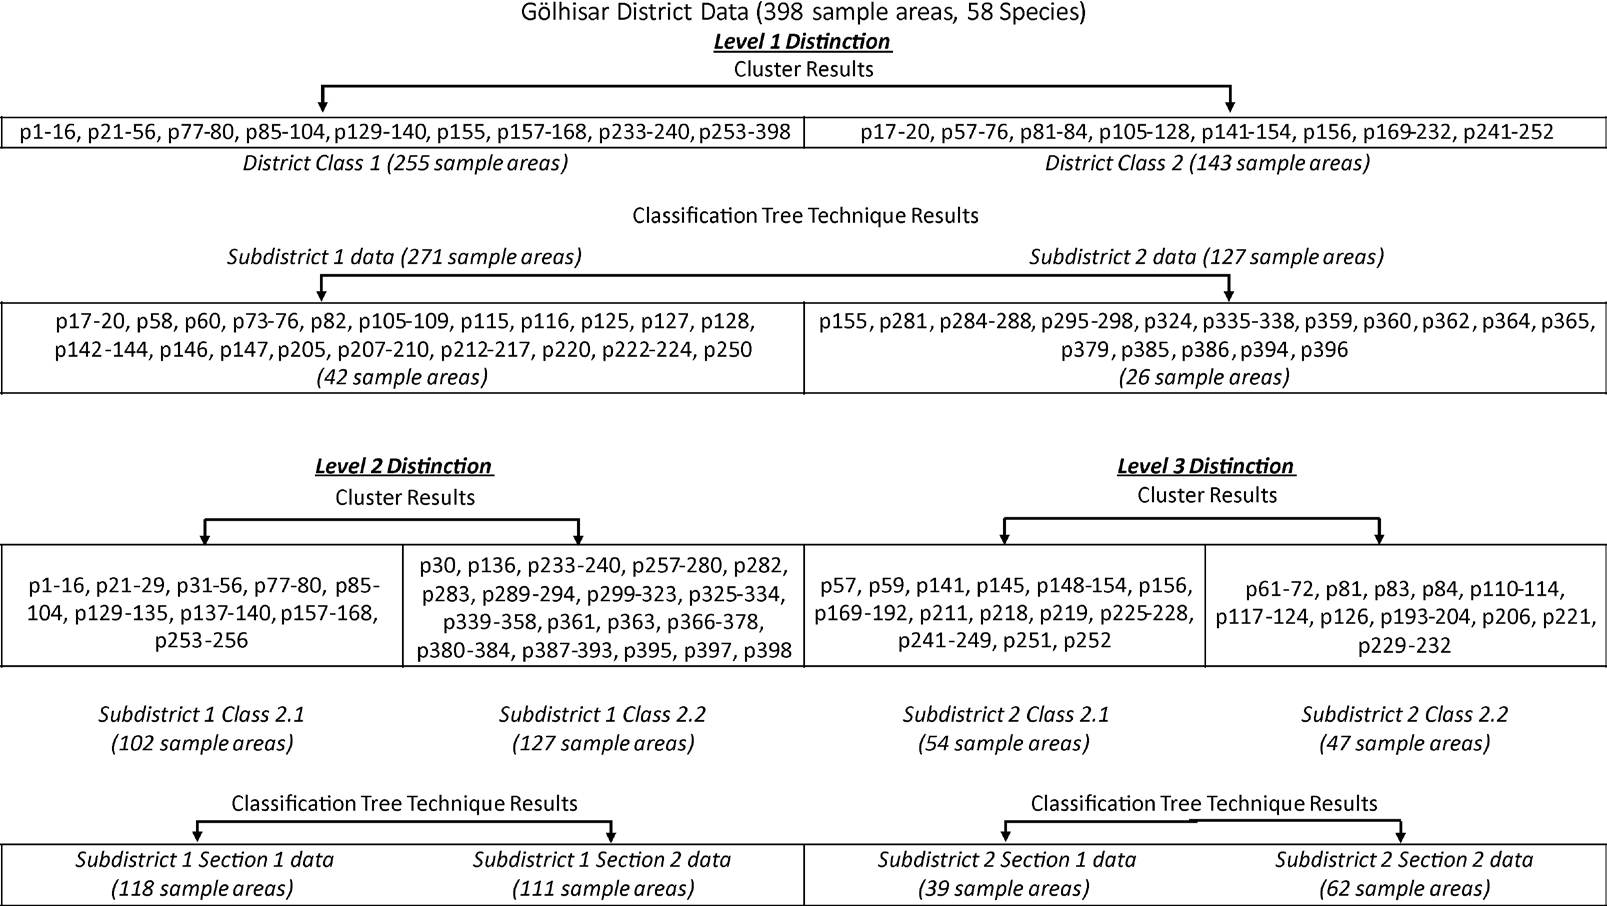
Figure 1. Distribution of sample areas in Cluster Analysis and Classification Tree Technique classes along with the analytical process
Slika 1. Distribucija uzorkovanih površina u klasama klasterske analize i klasifikacijskog stabla zajedno s
postupkom analize
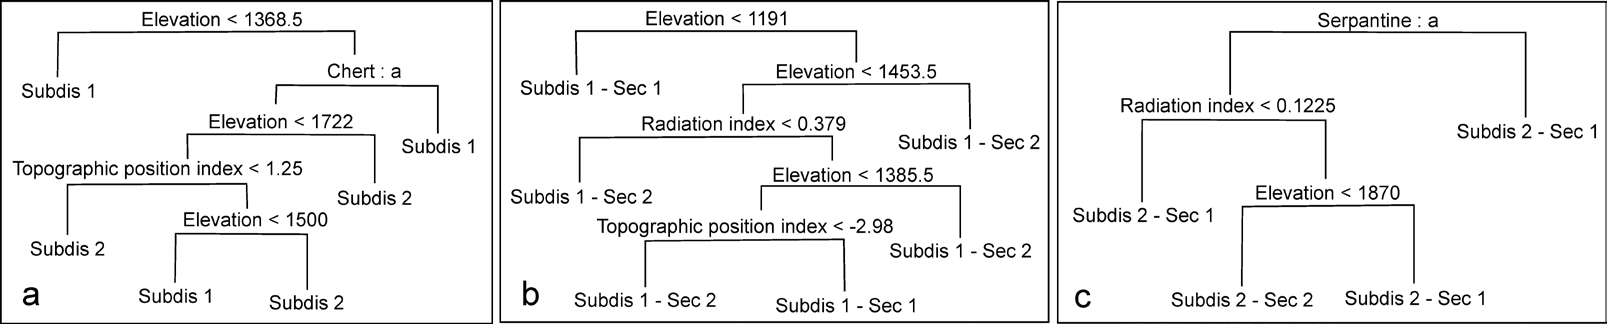
Figure 2. Tree models (the first distinction level of district (a), the second distinction of
Subdistrict 1 (b), the third distinction of Subdistrict 2 (c)) (Subdis 1: Subdistrict 1, Subdis 2:
Subdistrict 2, Subdistrict 1 – Section 1: Subdis 1 – Sect 1, Subdistrict 1 – Section 2: Subdis 1 –
Sec 2, Subdistrict 2 – Section 1: Subdis 2 – Sec 1, Subdistrict 2 – Section 2: Subdis 2 – Sec 2)
Slika 2. Modeli stabla (prva razina razlikovanja u okrugu (a), druga razina razlikovanja u Podokrugu
1 (b), treća razina razlikovanja u Podokrugu 2 (c)) (Podokrug 1: Podokrug 1, Podokrug 2: Podokrug 2,
Podokrug 1 – Dio 1: Podokrug 1 – Dio 1, Podokrug 1 – Dio 2: Podokrug 1 – Dio 2, Podokrug 2 – Dio 1:
Podokrug 2 – Dio 1, Podokrug 2 – Dio 2: Podokrug 2 – Dio 2)
The groups obtained from cluster analysis and environmental variables were modelled using the classification tree technique. The resulting model had a total of 6 terminal nodes. The variables that constructed the model were elevation, chert, and topographic position index, respectively (Figure 2a). As shown in Figure 2a, the code “District Class 1” represents Subdistrict 1, while the code “District Class 2” represents Subdistrict 2. Sub-sample areas with an altitude below 1368 m, sub-sample areas with an altitude above 1368 m and chert bedrock, sub-sample areas with an altitude between 1368 and 1500 m, no chert bedrock, and a topographic position index greater than 1.25 remained in Subdistrict 1. On the other hand, sub-sample areas where the altitude is greater than 1722 and there is no chert bedrock, sub-sample areas where the altitude is lower than 1722, there is no chert bedrock and the topographic position index is less than 1.25, as well as sub-sample areas where the altitude is between 1500 and 1722, there is no chert bedrock and the topographic position index is greater than 1.25 were included in Subdistrict 2 (Figure 2a).
In order to achieve a more successful vegetation distinction, it was decided that the sub-sample areas that fall between the cluster group and model group and the sub- sample areas provided above should not be included in the second and third vegetation distinction processes applied in the next step. In this regard, during the second distinction level applied, although there should have been 271 sub-sample areas in the model group, 42 sub-sample areas were excluded from this group and a total of 229 sub-sample areas were used for vegetation classification. Similarly, during the third distinction level, although there should have been 127 sub-sample areas in the model group, 26 sub-sample areas were excluded from this group, resulting in a total of 101 sub-sample areas being used to continue vegetation classification.
Second Distinction Level - Druga razina razlikovanja
In the second distinction level, the number of woody plant species with a frequency of 5% or more decreased from 58 to 41 out of the remaining 229 sub-sample areas from the vegetation classification process. As a result, the second distinction level was initiated with a total of 229 sub-sample areas and 41 woody plant species. In this process, cluster analysis was initially applied to the vegetation data matrix and the sample areas were divided into two clusters. Out of these, the first cluster group (Subdistrict 1 – Class 2.1) consisted of a total of 102 sample areas, while the second cluster group (Subdistrict 1 – Class 2.2) consisted of 127 sub-sample areas (Fig.1).
Using the groups obtained from the cluster analysis and environmental variables, the modelling process was repeated by means of the classification tree technique. The code “Subdistrict 1 – Section 1” shown in Figure 2b, 1 represents Subdistrict 1 – Class 2.1
for the second distinction level, while the code “Subdistrict 1 – Section 2” represents Subdistrict 1 – Class 2.2 for the second distinction level. Sub-sample areas with altitude less than 1191 m and sub-sample areas with altitude between 1191 and 1385 m, radiation index greater than 0.379, and topographic position index greater than -2.98 remained in Subdistrict 1 – Section 1 in the second distinction level. Sub-sampling areas with an elevation greater than 1453, sub-sampling areas with an elevation between 1191 and 1453 with a radiation index less than 0.379, sub-sampling areas with an elevation between 1385 and 1453 with a radiation index greater than 0.379, and sub-sampling areas with an elevation between 1191 and 1385 with a radiation index greater than 0.379 and a topographic position index less than -2.98 remained in Subdistrict 1 – Section 2 in the second distinction level (Figure 2b). The prediction values of the obtained tree model were regionalized and visualized at the scale of the Gölhisar district.
Third Distinction Level - Treća razina razlikovanja
In the vegetation classification process during the third distinction level, the number of woody plant species with a frequency of 5% or higher among the remaining 101 sub-sampling areas decreased from 58 to 43. As a result, the third distinction level was carried out with a total of 101 sub-sampling areas and 43 woody plant species. During this process, clustering analysis was performed again on the vegetation data matrix, and the sampling areas were divided into two cluster groups. A total of 54 sub-sampling areas were included in the first cluster group (Subdistrict 2 – Class 2.1), while the second cluster group (Subdistrict 2 – Class 2.2) contained 47 sub-sampling areas (Figure 1).
The modelling process was initiated by applying the classification tree technique between the groups obtained from the clustering analysis and environmental variables. The model had a total of 4 terminal nodes (Figure 2c). The variables that structured the model included elevation, radiation index, and serpentine, respectively. In Figure 2c, code ‘Subdistrict 2 – Section 1’ represents Subdistrict 2 Class 2.1 for the second distinction level and code ‘Subdistrict 2 Section 2’ represents Subdistrict 2 – Class 2.2 for the second distinction level. Sub-sampling areas with a radiation index less than 0.1225 without serpentine bedrock, sub-sampling areas with serpentine bedrock, sub- sampling areas with a radiation index greater than 0.1225 without serpentine bedrock and with an elevation greater than 1870 m remained in Subdistrict 2 – Section 1 in the third distinction level. On the other hand, sub-sampling areas with a radiation index greater than 0.1225 without serpentine bedrock and with an elevation less than 1870 m remained in Subdistrict 2 – Section 2 in the third distinction level (Figure 2c). The prediction values of the obtained tree model were regionalized and visualized at the scale of the Gölhisar district.
A chi-square test was used to assess whether there were statistically significant differences (at least at a 5% significant level) between the model groups obtained from cluster analysis and the classification tree technique. A statistically significant relationship (at the 1‰ significant level) was observed between the cluster analysis groups and the model groups in the results of the chi-square test (Table 2). According to the obtained test results, it was confirmed that the first, second, and third distinction levels were successful. Due to the success of the first and second level of vegetation classification, the third distinction level was initiated. However, since the chi-square value was not statistically significant in the fourth distinction level, the vegetation classification was terminated at the third distinction level.
Table 2. The results of the chi-square test in the cluster analysis groups and the model groups
Tablica 2. Rezultati hi-kvadrat testa u skupinama klasterske analize i skupinama modela
The prediction values of the obtained tree model were regionalized and visualized in the Gölhisar district. After all classification and modelling procedures, hierarchical vegetation classification was carried out in 4 different sub-regions of Gölhisar. Finally, these sub-regions were visualized on a map (Figure 3), and the hierarchical modelling based on ecological land classification and mapping of the region were completed.
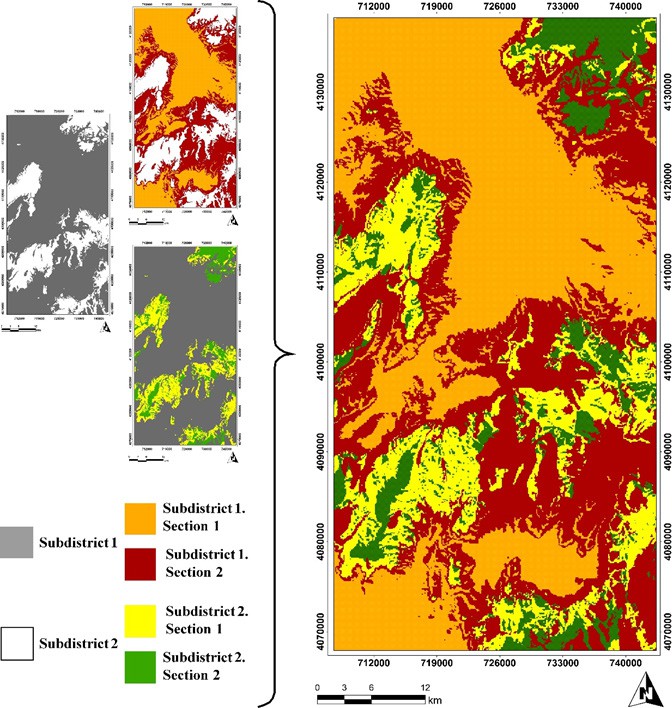
Figure 3. Hierarchical ecological land classification mapping of the Gölhisar district
Slika 3. Mapiranje hijerarhijske ekološke klasifikacije zemljišta okruga Gölhisar
DISCUSSION AND CONCLUSIONS
RASPRAVA I ZAKLJUČCI
In forestry practices, contemporary techniques are started to be used by the requirements of the present. Thus, forests have started to be evaluated not only as a source of wood raw material but also in terms of all the functions they possess. While, on the one hand, direct benefits are obtained from forests, on the other hand, ensuring the sustainability of forests has become prominent. To achieve this, it has become necessary to manage forest areas in a much more planned manner. In this process, especially the current management plans have been used as a guiding resource by practitioners or decision- makers, guiding forest management. On the other hand, forest management plans contain important information about the distribution areas, developmental stages, canopy closure degrees, age classes, and other characteristics of the main forest tree species in forests. However, they do not include information on the site characteristics
classification of forest areas, which varies depending on the region or forest management boundaries to which the tree species belong. Therefore, in vast geographies such as our country where climate, topographic conditions, parent rock, and soil properties vary, regional or local forest site properties classifications are needed for important forest areas. Such forest site properties classification allows for more organized and effective implementation of forestry activities that are compatible with modern techniques and requirements. Based on the distribution characteristics of woody species within the boundaries of the Gölhisar district, which contains important forest areas for our country, a forest site classification was carried out in this study using the hierarchical distinction principle.
As a result of the study, the Gölhisar district was classified into four different vegetation groups based on the hierarchical classification principle. In the first one, the region contains flat or convex areas with radiation index values close to 1 at the altitudes directly below 1190 m or between 1190 m and 1400 m. The most effective indicator plant species for this vegetation group, which corresponds to low elevations and well-light areas in the region, was identified as brutian pine (Pinus brutia Ten.). These areas corresponded to the locations where pure brutian pine forests mostly exist in the region. Furthermore, the other strongest indicator plant species of this vegetation group, along with Pinus brutia, are Verbascum cariense, Astragalus prusianus, Cotinus coggygria, and Centaurea solstitialis subsp. solstitialis. In general, it can be said that all of these plants are woody plant species that mix with brutian pine in the low elevation steps of the Mediterranean region.
The second vegetation group in the district is represented by areas with elevations approximately between 1450 and 1700 m on one hand, and mostly by moister areas with concave topography or valley features between elevations of approximately 1200 to 1450 m on the other hand. The strongest indicator plant species in this vegetation group was found to be Crimean juniper (Juniperus excelsa). One of the earlier studies has shown that the Crimean juniper tends to thrive on moist slopes facing the sea within the Mediterranean plant community (Aussenac, 2002). Therefore, it is believed that the characterization of the vegetation community in the mentioned altitude range by the Crimean juniper as a distinct indicator plant species is shaped by the relationships with moisture resulting from the climate conditions in the environment. On the other hand, the fact that Berberis crataegina is also an indicator species for this vegetation group supports the idea that moist environmental conditions may be a key factor in the differentiation of vegetation groups. Furthermore, within this vegetation group, which generally corresponds to middle elevation levels in the region, Pistacia terebinthus species emerged as an important indicator plant, especially in areas with high radiation index and more light.
The third and fourth vegetation groups’ distinction in the district generally corresponds to mountainous areas at elevations of 1500-1600 meters and above. However, the distinguishing variables between the third and fourth vegetation groups here were the serpentine bedrock and radiation index along with elevation. Especially in shaded slopes with less light due to the absence of serpentine and low radiation index, Pinus nigra and Berberis crataegina plant species emerged as the most prominent indicator plants for the third vegetation group. The formation of the fourth vegetation group occurred in altitudes between 1600 and 1850 meters where there is serpentine bedrock and radiation index values are approximately 1. In these areas, Cedrus libani, Daphne oleoides, and Berberis vulgaris plants emerged as prominent indicator species for the fourth vegetation group.
As a result of this hierarchical modelling based on ecological land classification conducted in the Gölhisar district, it was concluded that the most effective variables are elevation, radiation index, topographic position index, and bedrock types. Various studies conducted previously in the Mediterranean region have also demonstrated the effectiveness of these variables in characterizing vegetation communities (Özkan and Gülsoy, 2010; Özkan et al., 2013; Özkan, 2014; Özkan and Berger, 2014; Şentürk et al., 2014; Özkan et al., 2015; Özdemir and Özkan, 2016; Gülsoy et al., 2016; Gülsoy et al., 2017; Şentürk et al., 2019). On the other hand, the first and second vegetation groups identified correspond to a transitional climate zone between the upper Mediterranean and mountainous Mediterranean climate zones, while the third and fourth groups are particularly associated with the mountainous Mediterranean climate zone above 1200- 1300 m and the high mountainous Mediterranean climate zone where it ends (Arbez, 1974; Fontaine et al., 2007). As a result, the information obtained from here carries an effective fundamental information quality in forestry studies to be applied in the district. Especially, more successful and objective results can be obtained in afforestation practices, conservation, and bio-restoration services to be carried out in the region by using the model and map information obtained. The fact that the results obtained are model-based should help determine and monitor the changes that will occur in vegetation communities during the climate crisis, which is one of the biggest problems of today.