
INTRODUCTION
The tourism industry is affected by various crises: economic, financial, epidemiological, natural disasters, military and political actions, etc. These crises differ both in nature and in depth, and speed of impact on the tourism market, as well as the period of tourism industry recovery and entering a new trajectory. Unlike modern Covid-19 and epidemiological crises, which have not yet acquired regularity, financial crises fit into ordinary business cycles and recur with a certain sequence.
Some previous studies have modelled the effect of financial crises on the tourism industry, analysed changes in the behaviour of tourism market stakeholders, and discussed the possible government measures to support the tourism sector during an economic downturn. Meanwhile, the tourism industry still needs a reliable assessment of the industry's response to and resistance to financial shocks. This justifies the necessity for the development of a generalized indicator (index) of tourism stress. This index should help to identify the different phases of a crisis in the tourism industry, to monitor the impact of financial stress on the tourism industry, and to assess the resilience and vulnerability of the tourism sector to various external shocks.
Our study aims to develop a stress index for the tourism industry, test it for several advanced European countries, and determine the correlation between the tourism industry stress index and the proposed global financial stress index. The value of this study is in the development of a methodology for transferring stress from one area to another, in particular, the financial contagion to the tourism industry.
In this research, we test two hypotheses. The first hypothesis concerns the impact of financial shocks on the performance of the tourism industry. The second hypothesis asserts the existence of a certain resilience of the tourism industry to financial shocks, which is partly due to the dependence of its development not only on financial factors.
The rest of the paper is organised as follows. The first section provides a brief overview of approaches to quantifying economic instability with a particular focus on crisis signals and the application of the index method in tourism market research. The second section is dedicated to the development of the tourism industry stress index based on specific industry development indicators. We propose two alternative techniques for the construction of this index: simple arithmetic mean of particular stress indices and their weighted arithmetic mean, where the weights are determined based on the principal component analysis. Then we select and justify several sound indicators of financial markets and apply them to design a global financial stress index. The third section presents and discusses the research results. In this part, we analyse two alternative tourism stress indices computed using the empirical data from selected European Union countries (Finland, Germany, Italy and Spain). We examine the dynamics and relationship of these indices, as well as their correlation with the calculated financial stress index. The Granger causality test is used to determine causal dependence between the two composite stress indices. The conclusion features the principal findings of the research.
1. LITERATURE REVIEW
Economic stress can be determined as a loss of stability within the economic system, which manifests itself in a sharp fall and high volatility of some signal indicators. This primarily concerns financial market indicators such as stock indices, exchange rates, bank interest rates, etc. (e.g.De Haan, Oosterloo and Schoenmaker 2015;Dias et al. 2020). When identifying instability, not only the negative or positive dynamics of indicators does matter, but also the speed, frequency, and range of their fluctuations.
The tourism market performance, as well as financial performance, is influenced by economic cycles, although the dynamics of the tourism market can be subject to its own patterns (Dubois 2005). On top of the traditional tourism development indicators, some authors (Sausmarez 2007) suggest a number of special indicators of potential tourism crisis. They consider such factors as large planned increases in hotel room capacity in the absence of demand, failures in tourist service in the key markets, advance cruise ship berth bookings in destination ports, etc. In a broad sense, it is not individual indicators that are important to reflect the complex and dynamic nature of tourism, but their aggregate.
Tourism itself may be sensitive to a number of financial factors such as price levels, exchange rates, interest rates, stock indices, etc. Economic and financial crises affect tourism markets in several ways. First, a decline in personal real income influences the structure of aggregate demand and may have a greater negative impact on the tourism market. The depreciation of the households’ accumulated assets, embodying the welfare effect, reduces tourism spending during the crisis (Sio-Chong and Yuk-Chow 2020). The uncertainty associated with income and employment in recession negatively affects tourism expenditures (Pappas and Apostolakis 2020), while unemployment may be the best predictor of the evolution of travel costs over the business cycle (Alegre, Mateo and Pou 2013). In addition, tourists' decisions to cut expenditures in times of crisis can influence their preferences for closer or cheaper destinations or shorter stays, etc. (Eugenio-Martin and Campos-Soria 2014;Campos-Soria, Inchausti-Sintes and Eugenio-Martin 2015), causing a cross-country redistribution of tourist flows. This evokes particular research interest in the resilience of the tourism industry in individual countries to economic and financial crises.
Researchers proposed several methods for complex assessment of economic instability. One of the most popular approach is the development of Early Warning Systems (EWSs) for crises (Caggiano, Calice and Leonida 2014;Candelon, Dumitrescu and Hurlin 2014;Dawood, Horsewood and Strobel 2017). Scholars emphasised that the choice of instability indicators for EWSs models depends on the type of economy (Shin 2013), and the “signal indicators” in these models should clearly portend the onset of the crisis when a certain threshold is exceeded (Knedlik 2014). Another approach to assessing instability is associated with the development and evaluation of VaR or GARCH models (Mohsin et al. 2020;Pardal et al., 2020).
Some studies of the tourism market also substantiated the need to identify crisis signals when developing strategic plans and models of crisis management in tourism industry. For example,Paraskevas and Altinay (2013) have undertaken the survey of 16 international tourism organisations and revealed the importance of signal detection in their anti-crisis management and the problems their crisis response centres face. The authors proposed a model of a three-stage process for detecting crisis signals in the tourism market. In this model, the signals are scanned, recorded, and transmitted to a crisis response centre.
In the context of our research, of particular interest is the development of composite indices of instability or stress (Korzeb and Niedziółka 2020).Singh et al. (2009) provide an overview of various resilience indices applied to a wide variety of markets and domains, describe the design stages of such indices, as well as weighting and aggregation methodology. For financial markets, the most popular are the Financial Condition Index (FCI) and the Financial Stress Index (FSI) (Aboura and Roye 2017;Cambón and Estévez 2016;Polat and Ozkan 2019). These indices are a kind of summarising (integral) indicators of the financial system stability, which are formed from particular or composite indicators. The number of indicators included in the FCI or FSI is case-specific. As a rule, these indicators characterise the state of financial institutions, money supply, exchange rate, and stock indices.Cevik, Dibooglu and Kutan (2013) suggested aggregating particular indicators by segments of the financial market, whileStolbov and Shchepeleva (2016) proposed to do it by risk type.Giglio, Kelly and Pruitt (2016) emphasized that the “reputation” of the indicators selected for aggregation must be proven by prior experience.
The EU compiles the Composite Indicator of Systemic Stress (CISS) based on 15 indicators of the scope of financial stress in 5 markets: the financial intermediary sector, the money market, equity and bond markets, and the foreign exchange market. CISS is aggregated using the VAR model (Hollo, Kramer and Lo Duca 2012). A financial stress threshold is also determined for this index; exceeding it suppresses economic activity in the euro-zone.
The index method has a specific application in the study of the tourist sector of the economy. It is most often used to assess the competitiveness of countries in the tourism market. For example, the Travel & Tourism Competitiveness Index (TTCI) developed by WEF in 2007 ranks more than 100 countries annually providing 98% of world tourism GDP (TTCR 2019). According to it, a country's competitiveness is evaluated using a seven-point scale with 90 individual indicators. The very scheme of constructing a classic TTCI is universal – the relevant variables are selected, then normalised, weighted, and aggregated into a single index. Similar methods of constructing the tourism competitiveness indices have been applied for Spain (Torres-Delgado and Palomeque 2018), Cuba (Kubickova and Lee 2018), and the Asia-Pacific region (Augustin and Liaw 2017).
Scholars dispute some aspects of constructing the classic TTCI model (Croes and Kubickova 2013;Cvelbar et al. 2016). They highlight the problems of possible duplication of data and imperfections of the index methodology in terms of aggregation and weighting of input indicators.Crouch (2011) argues that the influence of different factors on competitiveness cannot be the same for the entire tourism market as well as for its segments. To address this issue,Fernández et al. (2020) proposed to weight individual indicators using a coefficient of determination. Using this method, the authors classified 80 countries according to their level of tourism competitiveness, identifying the key competitiveness factors and factors that best explain territorial differences.
Another solution to the aggregation problem is to employ principal component analysis (PCA). The main advantage of PCA over a simple average of indicators is that it copes with the multicollinearity of input indicators. However, its application has several special requirements, the main of which are the normal and linear distribution over the entire sample (Stolbov 2019). Based on PCA,Khan et al. (2017) calculated an alternative TTCI for a group of 19 countries in 1990-2014, and identified the relationship between inbound and outbound tourism, transport development and trade openness.
Several studies have proposed a compound tourism index covering both the tourism and financial environment and based on the methodology for constructing a Financial Condition Index (FCI). As a matter of fact, in this case, tourism indices are an adaptation of FCIs, commonly used for financial markets, to the stock data of the tourism industry. For example,Chang, Hsu, and McAleer (2014) proposed the Tourism Conditions Index and calculated it for Taiwan from April 2005 to August 2013 using monthly data on three components (tourism industry stock index, exchange rate, and interest rates). The results showed that this index has a much better predictive power than the Taiwan Tourism Industry Index (TII), which is traditionally used in Taiwan.
A similar approach is presented in (Chang 2015) – this study developed the daily Tourism Financial Conditions Index (TFCI). It was compiled using data on stock exchange indices, tourism stock sub-indices, exchange rates, and interest rates. The index was also calculated for Taiwan – the sample included data for the period from 1 June 2001 to 28 February 2014. To capture the inherent volatility in daily returns of the tourism stock index, the authors developed three univariate conditional volatility models, namely GARCH, GJR and EGARCH. The researchers concluded that the TFCI provides fairly accurate estimates, especially when conditional volatility is included in the general specification. In (Chang, Hsu and McAleer 2017), the TFCI model was supplemented with factor analysis and compared with the Tourism Stock Index, demonstrating the performance of tourism companies listed on the Taiwan Stock Exchange.
It should be noted that instability in the tourism market can be assessed by the impact of the commonly used Chicago Board Options Exchange volatility index (VIX) on the profitability of tourism companies. In (Akdağ, Kiliç and Yildirim 2019), the authors attempted to do this using a number of tests (Granger causality, Breitung and Candelion frequency causality, Johansen test, and DOLS and FMOLS methods). This allowed them to evaluate the relationship between VIX and tourism companies’ stock indices obtained from monthly data for 11 countries. In most cases, the relationship was confirmed – an increase in VIX caused a decrease in the stock prices of tourism companies. The rise in VIX is associated with financial investors’ growing fears caused by increased market volatility and the risk of contagion effects. Investors avoid purchasing equities during the crisis, while consumers cut down their costs, primarily their travel expenses. The best evidence of this was the 2008 crisis, which caused high volatility in financial markets and a sharp drop in tourism revenues.
In general, our review shows that there are numerous studies dedicated to various types of financial and tourism indices. However, there are far fewer publications that develop indices of the tourism economic conditions and use them to analyse the correlations between the financial and tourism markets. However, such indices are essential for determining the scope of financial stress in the tourism segment of the economy and forecasting tourism crises in the business cycle.
2. DATA AND METHODOLOGY
2.1. Building the Tourism Industry Stress Index
Our empirical study is based on the Eurostat data, which provides information on various indicators of the tourism industry. We have examined the possibility of aggregating a number of statistical indicators on passenger transport, educational & cultural, and international trade services. However, our final sample included only those indicators for which monthly statistics are available. For the same reason, we have focused on only 4 countries with the most complete statistical data – Finland, Italy, Germany, and Spain. The resulting dataset of 4,200 observations covered the period from January 1993 to February 2020.
The integral Tourism Industry Stress Index was built on the basis of three particular indicators:
1) number of nights spent at tourist accommodation establishments (Nights);
2) number of arrivals at tourist accommodation establishments (Arrivals);
3) the net occupancy rate of bed-places and bedrooms in hotels and similar accommodations (Occup).
The first two indicators include arrivals and nights spent not only in hotels but also in specialised accommodation establishments such as campsites, recreation parks, etc. Only foreign tourists are counted. The occupancy of hotels is assessed by beds, not rooms.
Preliminary analysis of the data showed that tourism industry indicators have a pronounced seasonal component. In Italy, for example, starting every November, when the tourist season ends, the indicators drop to their lowest values, then recover and reach their peak in spring and summer. Besides, the absolute values of indicators for countries are not comparable due to the scale factor. For this reason, we made our calculations using the month-over-month growth rate of indicators. This approach allows both to exclude the seasonal component and to achieve data comparability, which is especially important for cross-country comparisons.
Another important feature of the time series of the growth rates of the indicators involved in the construction of the aggregated index is their positive correlation, which can be seen fromTable 1.
The selected indicators are integrated into an overall tourism industry indicator using two alternative techniques: simple arithmetic mean and non-normalized principal component analysis (PCA). In both cases, stress is understood as the difference between the moving standard deviation (MSD) and the moving average of growth rates for particular or generalised indicators. In other words, we assume that the smaller the growth rate of these indicators and the greater their inter-temporal volatility, the higher the stress in the industry.
2.1.1. An integrated stress index based on the simple mean of particular indices.
Let the month-over-month growth rate of the i-th indicator ()
in the period t () be Xit. For this growth rate, the moving averages (μXit) and the MSDs (σXit) are further calculated at each point in time t, taking into account 12 values of this indicator before the specified date and 12 values of the indicator after this date (including the date itself).
Time series of stress indices covering T-23 periods are calculated separately for each particular tourism industry indicator:
(1)
Then they are compounded into an integral stress index (TSI – tourist stress index) by calculating simple arithmetic mean:
(2)
The disadvantage of the proposed method is that it does not take into account the correlation between particular stress indices. This disadvantage can be overcome by use of the second method for calculating the integral stress index.
2.1.2. An integrated stress index based on the non-normalised principal component analysis (PCA).
In this method, particular indicators are combined into an integral indicator by calculating their first principal component (PC1), which is a linear combination of normalized individual indicators that maximizes its overall variance. In other words, PC1 incorporates the maximum volatility of these indicators, while eliminating their multicollinearity.
The time series values of the first principal component are calculated as follows:
(3)
where ai is the specific weight (loading) of the i-th indicator in the PC determined by optimisation; Xit is the value of the indicator i at the time t; is its inter-temporal average; σi is its inter-temporal standard deviation.
The conventional principal component analysis is based on normalising aggregates using a Z-score (equivalent standard deviation method). However, this approach loses the individual country characteristics (differences in the volatility of indicators) and may lead to incorrect conclusions when comparing them. We, therefore, recalculate the values of the principal components, eliminating normalising, but using the indicators loadings found by the PCA method:
(4)
Next, we compute the Tourism Industry Stress Index time series as the difference between MSD (σPCNt) and moving average (μPCNt) of the non-normalised first principal component:
(5)
2.2 Building the Financial Stress Index and determining its relationship with the Tourism Industry Stress Index
The Financial Stress Index is constructed using the same alternative techniques as the Tourism Industry Stress Index. To build it, we select the following three particular indicators:
1) American stock market index S&P500 (points) – Stock.
2) Brent Oil Futures (US dollars) – Oil.
3) Real effective (multilateral) exchange rate of the euro (index) – RExch. This rate is based on the basket of currencies of 19 countries – the largest trading partners of the euro-zone, and the consumer price index is used for their deflating. The exchange rate is an indexed multiple of 100, where the first quarter of 1999 – the period when Euro was introduced – is taken as a base. Since the real exchange rate of the euro showed a negative correlation with the US stock market index, the calculations used the inverse values of this rate.
The first indicator is selected because it best reflects the state of world financial markets, as the US stock market index directly correlates with indices of other countries' stock markets. The choice of the second indicator for detecting financial stress is attributable to the fact that recent economic crises have been closely linked to changes in oil prices, as per some studies exhibiting pro-cyclical behaviour. In addition, some tourism services consumers live in oil-exporting countries. Finally, the third indicator (the real effective exchange rate of the euro) is chosen because it is associated with the relative value of the consumer basket in the euro-zone countries. The increased volatility in the exchange rates of major currencies observed in times of economic instability affects the terms of trade of these countries.
The time series are checked for stationarity using the augmented Dickey-Fuller test. Finally, based on the Granger causality test we determine the relationship between the two non-normalised indices, both the direction of their interaction and its lag.
This methodology allows us to test two specific hypotheses.
Hypothesis 1 is about the relationship between the developed Financial Stress Index and Tourism Industry Stress Index, with the former being the reason for the latter, not the other way around. In other words, we believe that financial market turmoil propagates to related markets (transport services, catering, and entertainment) with some delay, causing, in turn, fluctuations in consumption of hospitality services and other tourist spending. In periods of financial stability, the tourism industry, on the contrary, shows greater certainty. In the meanwhile, the speed of tourism's response to the state of the financial market would be determined by interaction lags of the two indices.
Hypothesis 2 is about the smoothed response of the tourism industry to financial stress, which is to be determined using estimated regression coefficients (marginal values) of the two indices. This hypothesis has already been partially confirmed during the analysis of primary data. Thus, the maximum decline in the European tourism market for 50 years was recorded in 2009. In terms of tourist arrivals, it was only 5.3%, in terms of tourist receipts – 13.1%. The stress on financial markets during the “Great Recession” was significantly greater in scope and duration. Therefore, we do not forecast the Tourism Industry Stress Index to have the same high peaks and deep troughs as the Financial Stress Index.
3. RESULTS AND DISCUSSION
The results of calculating tourism stress indices in two ways for the four countries are presented in Figures 1-4.
The stress indices calculated using the second method (namely the principal component analysis) show greater volatility than ones determined as a simple average of particular stress indices, which is embedded in their techniques. The largest deviation of the two indices is observed during peaks and troughs. Moreover, for Italy and Finland, the inter-temporal mean of stress indices based on the principal component analysis is higher than the mean of the stress indices based on simple averaging.
An analysis of the time series of stress indices makes it possible to establish several periods of increasing strain in the tourism market. First of all, the instability of the tourism industry, which manifested in 1997-1998 in a number of European countries, is connected with the crisis in the Asian financial markets and the default in Russia, which led to a decrease in demand for tourism services and related industries. The next spike in instability was observed in the early 2000s, which coincided with the collapse of the dotcom bubble (a sharp fall in the NASDAQ hi-tech index), as well as a recession in several EU countries and the USA. The next crisis in tourism concurred with the global crisis of the last quarter of 2008-2010. In contrast to the recession of the early 2000s, it hit almost all the developed countries. While for the tourism sector in Italy and Germany the stress of 2000-2002 was slightly greater than that of 2008-2010, for the other two countries (Spain and Finland) the second stress turned out to be more pronounced.
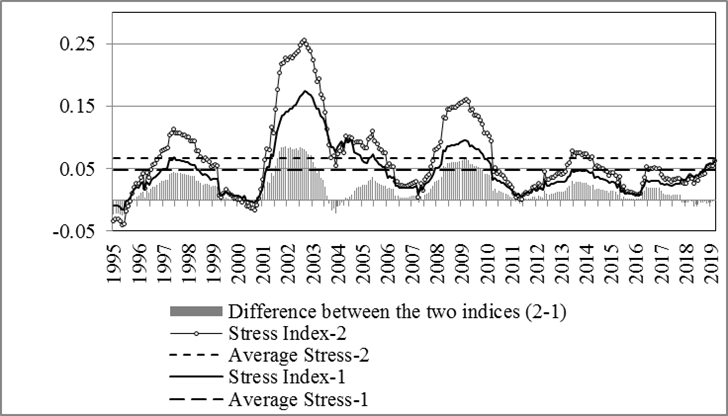
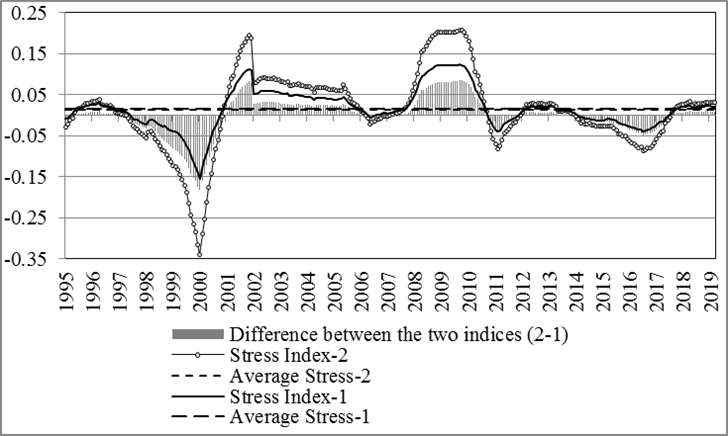
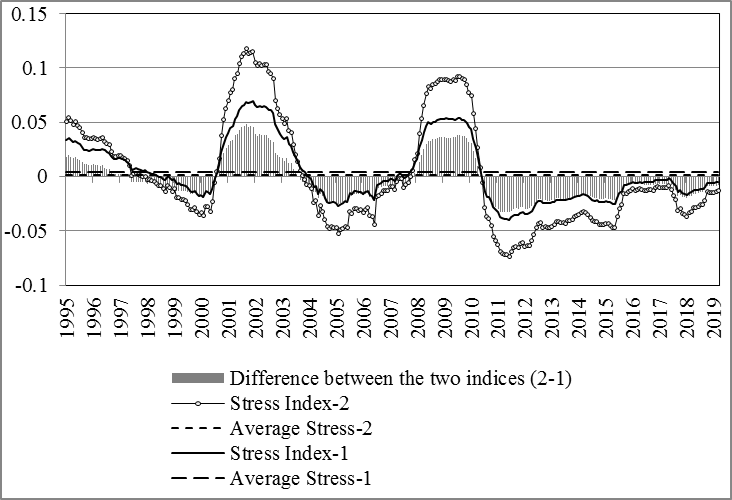
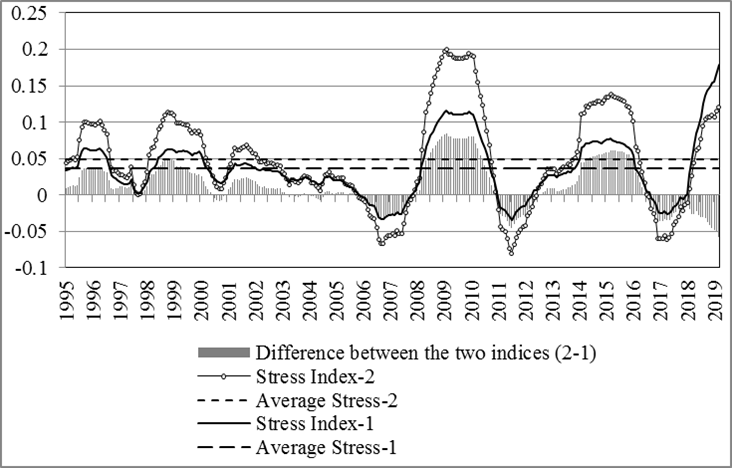
Another stress on the European tourism market dates back to 2014-2016. It primarily affected the Finnish tourism industry, while the tourism industries in other countries experienced only slight disturbances (sometimes as early as in 2013). This stress coincides with the introduction and expansion of sanctions against Russia, which is one of the main consumers of European tourism services. Coupled with falling oil prices, these sanctions led to a devaluation of the rouble and a significant drop in the real incomes of the Russian population. The period 2017-2019 is also characterized by increasing stress on European tourism, and again the Finnish tourism industry appears to be the most vulnerable.
Comparison of average stress indices for different countries leads to the conclusion that Germany has the most stress-resistant tourism market, followed by Spain. Tourism in Italy and Finland is the most vulnerable to stress.
The observed synchronization of the movement of stress indices of European tourism markets indicates their similar response to global economic processes.Table 2 shows both the high correlation between stress indices (TSI), calculated by two methods for each country (R = 0.925-0.999), and a significant correlation between stress indices of different countries (R = 0.17-0.66). The stress indices of Italy and Spain, which are in similar economic and climatic conditions, demonstrate the highest correlation. Finland's tourism stress index has the smallest correlation with other countries, primarily Italy. The behaviour of the Finnish tourism industry is similar to that of the German tourism industry, in part due to their territorial proximity.
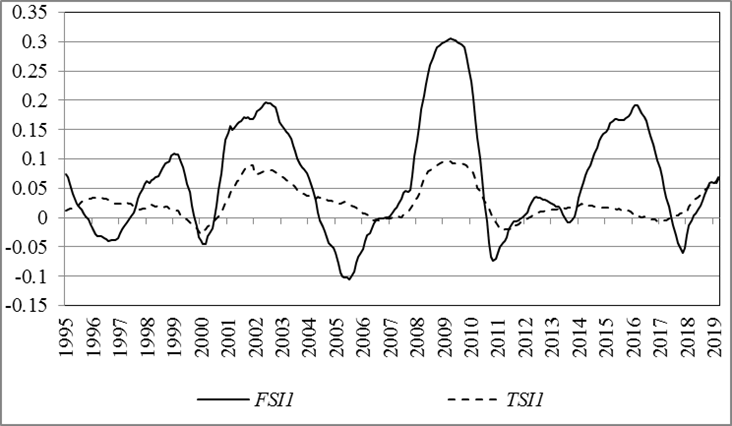
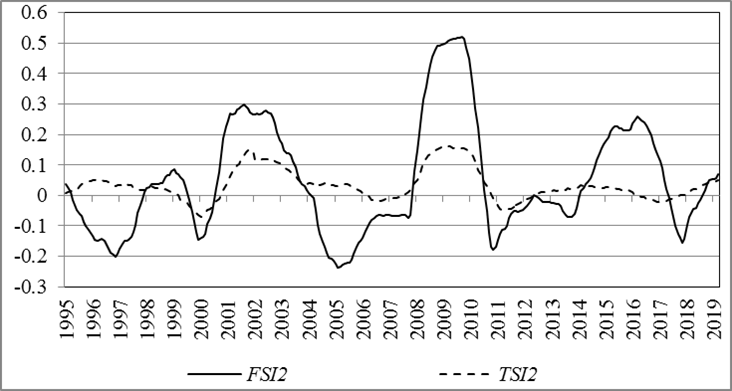
The European Tourism Stress Indices (TSI), which are simple arithmetic mean of the individual tourism stress indices for four European countries, calculated in two ways, are presented inFigures 5 and6. We deliberately do not take into account the shares of countries in the tourism market; otherwise, we would have to justify the choice of the indicator for their calculations.
The Financial Stress Index is based on three specific financial metrics that show significant correlation. Particularly, the Pearson correlation coefficient for the Stock and Oil indicators is 0.166, and for the Stock and RExch indicators it is 0.204. Given the number of observations N = 314, these are significant relationships. The collinearity of the indicators justifies the use of the principal component analysis when combined into a generalized measure of financial stress. Meanwhile, the task of determining the marginal impact of financial stress on the tourism industry requires us to abandon the normalisation of indicators.
The Financial Market Stress Indices (FSI) calculated using two alternative methods, are also shown in Figures 5 and6, respectively. These figures clearly indicate a unidirectional change of TSI and FSI. However, in order to determine which of them is the cause and which is the effect, a test of causality is required.
The stationarity of the time series of the examined indices is ensured by the peculiarities of their construction (based on the growth rates of indicators) and is clearly visible inFigures 5 and6. In addition, it is confirmed by the augmented Dickey-Fuller test (for TSI, the single root hypothesis is rejected with r<0.006, for FSI – with r<0.002).
Table 3 shows the results of the Granger causality test for both calculation methods, where the null hypothesis states that there is no dependence. In both cases, we find evidence that the financial stress index is the cause of the tourism stress index, and that the former leads to the latter with an average lag of 3 months. This confirms hypothesis 1 which states that the Financial Stress Index can serve as a predictor of stress in the tourism industry.
| Dependent variable | Independent variable | Chi-square | p-value | Has the null hypothesis been rejected? | Degree of lag |
| FSI1 | TSI1 | 2.145 | 0.5429 | No | 3 |
| TSI1 | FSI1 | 17.850 | 0.0005 | Yes | 3 |
| FSI2 | TSI2 | 1.574 | 0.4443 | No | 3 |
| TSI2 | FSI2 | 21.959 | 0.0001 | Yes | 3 |
Figures 5 and6 also demonstrate the smoothed response of the tourism market stress to financial stress. Linear dependencies with no lag (Figure 7) show that the marginal effect of financial stress on the tourism market stress is 0.20-0.21 (for two index calculation methods). In other words, the reaction of the tourism market to financial stress is only 20%. This confirms our hypothesis 2 on the incomplete response of the tourism market to financial stress. This also testifies to a certain resilience of the tourism market.
Due to its originality, our study has no direct analogs for comparison. Meanwhile, the results obtained on the impact of the state of financial markets on the development of the tourism industry are consistent with the findings of other authors.
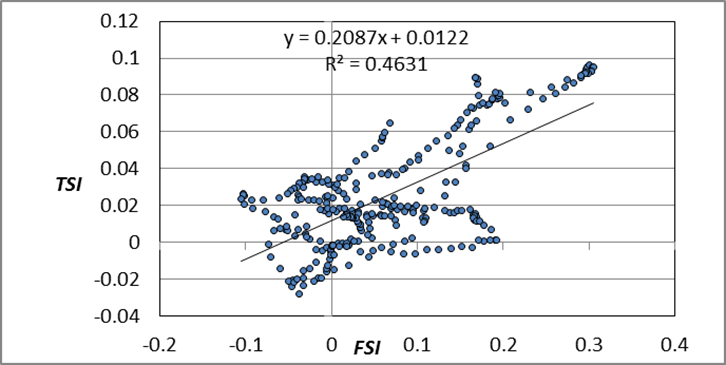
a) approach I
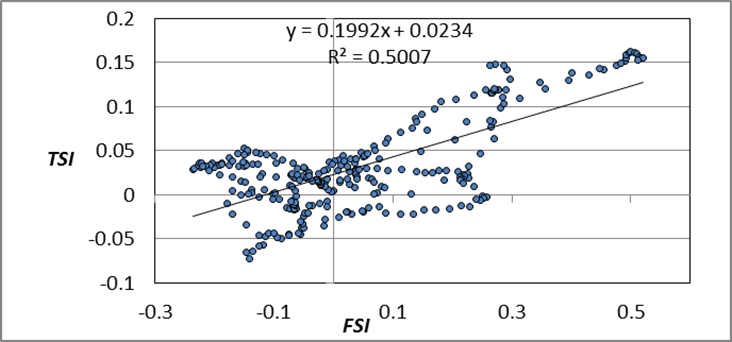
b) approach II
In particular,Akdağ, Kiliç and Yildirim (2019), using tests for causality and cointegration, also confirmed the impact of the Financial Volatility Index (VIX) on the return of travel firms in 11 countries in Europe, Asia and the United States. At the same time, we should emphasise the difference between our study and (Chang, Hsu, H.-K. and McAleer, 2014), where financial conditions were directly integrated into the Tourism Financial Conditions Index TFCI), the constructed models indicated the dependency of the tourism stock index returns (RTS) on TFCI, while the Granger causality tests showed their strong feedback.
The present study diagnoses the impact of three main crises on the state of the European tourism market, which has also been the subject of other authors’ research. For example,Sio-Chong and Yuk-Chow (2020) argue that the 2008-2009 subprime mortgage crisis, which resulted in the loss of jobs, income and wealth, was the most devastating for the tourism market in Asian countries. Our research also confirms the significant impact of the great recession on the European tourism market. However, by the degree of influence, it appears no stronger than the crisis of the early 2000s (Figures 5 and6). Moreover, we see that the impact of financial crises on the European tourism industry diminishes over time, which indirectly indicates this industry growing resilience. However, a different type of model is required to rigorously prove this statement.
The main difference between our study and previous ones and its added value for the relevant literature lies in the separate assessment of indicators of the financial condition and development of the tourism market using identical methods, taking into account both the rate of change of indicators and their volatility. The developed approaches allow to model interaction of two indices, and to assess the speed and degree of reaction of the tourism market to changes in financial conditions. Since many crises, including pandemic ones, often overlap with financial crises, we foresee the relevance of our approaches for future research.
4. LIMITATIONS AND FUTURE DIRECTIONS
Despite the novelty of the methods and the originality of the results, the proposed study has a number of limitations. First, we used a limited number of private indicators to create aggregated indices of instability in the tourism industry. For example, travel expenses or passenger transportation by different modes of transport can be added to the TSI calculation. Moreover, application of a supply-side approach and construction of a Tourism Satellite Account can provide a comprehensive view of the problem. This involves a selection of indicators covering all 12 tourism-related activities such as accommodation for visitors, food- and beverage-serving activities, sports and recreational activities etc.
Second, our analysis comes down to the tourism market of the largest European countries, some of which are dominated by domestic tourism, while in others outbound or inbound tourism is more developed. It is desirable to expand the sample by including other European countries with a large tourist flow (for example, Greece and Portugal). However, the limitation of the number of countries and the indicators used is due to the incompleteness of Eurostat's high-frequency data over a long period of time.
Third, the financial stress index was determined on the basis of three financial indicators of a global nature, without taking into account the specifics of financial stress both in the countries exporting tourism services (oriented towards inbound tourism) and in the countries importing tourism services (oriented to outbound tourism). Deeper specification of financial stress at the country level will lead to more accurate results.
Finally, we used two alternative methods to create generalized stress indices, which also have drawbacks. The method of the simple mean of indices ignores their correlation and can lead to biased estimates of overall stress. Principal component analysis eliminates this disadvantage. However, it is more suitable for time series analysis than comparative analysis. Therefore, when conducting cross-country comparisons, we had to make adjustments to it by removing the variation normalization.
Expansion of the study in the future is possible both by specifying indicators, countries and methods for constructing indices, and by creating multivariate regressions that demonstrate the relationship of the revised tourism stress indices with a variety of influencing factors, financial and economic in nature, and natural, political, legal (related to the threat of terrorism), epidemiological and others.
Based on the methodology proposed and tested in this article, it is possible to assess not only the impact of usual financial crises but also of relatively new pandemic-related crises on the functioning of the tourism market. Further construction of an Epidemiological Stress Index and establishing its interaction with the Tourism Industry Stress Index would determine the speed and the extent of the response of the European tourism market to the COVID-19 pandemic and post-pandemic recovery. Since this task requires an accumulation of data over a longer pandemic period, the authors leave its solution for the future.
CONCLUSION
The observed response of the tourism market to financial market shocks shifts the focus of research towards the development of adequate approaches and models for assessing the resilience of the tourism sector and its ability to withstand crises and instability. In this paper, we proposed such an assessment indicator (Tourism Industry Stress Index) and tested it on empirical data from several EU countries. In addition, we attempted to identify the nature of the relationship between stress in the tourism and financial markets using the sample data for selected European countries.
The proposed Tourism Industry Stress Index was developed by utilisation of two alternative techniques – simple arithmetic mean and principal component analysis applied to specific stress indicators without their normalisation. In both approaches, we determine the level of stress as the difference between the moving standard deviation and the moving average of month-over-month growth rates for particular or overall tourism indicators. The methods differ in the way that these indicators are reduced to an overall stress index and the degree to which their correlations are accounted for.
The developed Tourism Industry Stress Index has been tested on Eurostat empirical data for four EU countries (Spain, Italy, Germany and Finland). Tourism indicators such as arrivals, nights spent, and net occupancy rate were selected for aggregation. Calculation and analysis were based on monthly data for the period from January 1993 to February 2020. As a result, we identified periods of increased instability in the European tourism market, determined the level of stress resistance for the countries under consideration, and concluded that there is a noticeable correlation between the stress indices across countries. A comparison of the results obtained by the two methods showed higher volatility of the indices calculated using the principal component analysis.
We have also extended the developed technique to the financial sector and examined the relationship between the instability of tourism and financial markets. Using the same alternative methods, we constructed the Financial Stress index. Aggregation in this case was made for three particular indicators (S&P 500 index, Brent oil futures, real effective exchange rate of the euro to the basket of currencies). The obtained time series of the stress indices were tested for stationarity using the augmented Dickey-Fuller test.
As a result, the study confirmed our hypotheses about the relationship between the Financial Stress Index and the Tourism Industry Stress Index. The Granger causality test revealed that it is the shocks in the financial markets that cause tourism stress, not the other way around. Regression analysis showed that the marginal effect of financial shocks on the European tourism market was only 20%, which indicated a smoothed response of the tourism market to financial instability.
The research carried out has a certain practical application. The developed tourism stress indices can signal growing instability in the tourism segment of the economy, which requires an immediate response from the authorities and market participants. This allows us to recommend these indices as reliable indicators of instability for subsequent tourism risk management. The constructed financial stress indices can be used as leading indicators of stress in the tourism industry during business cycles, but can also serve as a model for creating other stress indices in areas important for the development of travel industry. The created models are applicable for a comparative analysis of the resilience of the tourism sector in different countries to shocks of various nature. Their assessments can be used by tourism administrations and governments in pursuing effective tourism policies.