
INTRODUCTION
Tourism can be considered a vital component in economic development in many countries worldwide by offering employment, generating income, reducing poverty, generating foreign exchange earnings, and improving the standard of livelihood (Tuncay and Özcan 2020;Amin and Rahman 2019;Choi and Sirakaya 2005;Smeral 2015). The World Travel and Tourism Council (WTTC 2019) statistics state that the tourism industry has created 330 million jobs around the world, which is 1 in every 10 jobs. The industry has also contributed 10.3 percent of global GDP and 4.3 percent of the world's total investment in 2018. Existing literature has found a connotation between the growth of tourism industry and economic activities across the countries (Amin and Atique 2021;Vanegas et al. 2020;Paramati et al. 2018;Nawaz 2016;Shahzad et al. 2017;Dogan et al. 2017).
Energy, nevertheless, is also considered as one of the crucial constituents for development in the world. Energy plays a significant role as a stimulator of economic growth and decision making (Zaman and Moemen 2017;Csereklyei et al. 2016). Several studies have inspected the liaison between energy use and growth in GDP and revealed a robust relationship between them (Amin and Khan 2020;Wang et al. 2018;Chen et al. 2016;Karanfil and Lee 2015;Kraft and Kraft 1978).
Clean energy usage for a better environment has been a unanimous issue around the world. SDG-7 has highlighted the significance of enhancing renewable energy (henceforth, RE) share in the primary energy mix globally to achieve sustainable development by 2030. Empirical literature indicates a strong affirmative linkage between RE and socio-economic development (Duran et al. 2013;Waheed et al. 2018). RE can also reduce CO2 emission and leads to sustainable development (Leitão 2021;Balsalobre-Lorente et al. 2021a;Caglar et al. 2021;Bilgili et al. 2021;Moutinho and Madaleno 2021;Danish et al. 2019;Waheed et al. 2018;Kutan et al. 2017). Like others, South Asian countries are also considering the adoption of different sources of clean energy like solar and hydro energy sources to meet the energy demand. According to theWorld Bank (2019), electricity production from RE sources was increased to 75.05 billion kWh in 2015 from 34.17 billion kWh in 2010 in South Asia.
Frantál and Urbánková (2017) andAmin (2021) argue that the tourism industry requires energy such as electricity, oil, and coal, for different activities like recreational activities, shopping, accommodation, transport services, and tourism management activities. The fast expansion in the tourism industry increases the energy demand for different tourism activities, leading to degradation of the surrounding environment in the long-run (LR) if the dependency on non-RE energies is high (Zhang and Liu 2019). Due to environmental degradation, tourist spots can lose natural beauty, reducing the potential number of inbound tourists and tourism revenue (Leitão and Balsalobre-Lorente 2020). Furthermore,Tsagarakis et al. (2011) highlight that international tourists choose to visit hotels equipped with energy-saving technologies and access to REs. Additionally, the lack of accessibility of conventional energy sources may also influence different tourism industry stakeholders to think about RE utilisation to keep providing the tourism services.
The importance of tourism and RE consumption has been a driving issue for South Asian countries nowadays. The number of tourist arrival reached 26.70 million for this region in 2018, further increasing the demand for substantial energy consumption (World Bank 2019). In this regard,Amin et al. (2020) highlight the importance of the tourism-energy nexus and found a unidirectional causality from tourism to energy consumption in the South Asian region.
The nexus between tourism and RE consumption is gaining momentum in the literature; however, considering the South Asian region, there is a persisting gap in this issue. To our knowledge, no study has empirically analysed the linkage between tourism and RE consumption. Hence, the contribution of this paper is threefold. First, the paper aims to empirically investigate the tourism-RE nexus for the selected South Asian countries (Bangladesh, India, Nepal, Sri Lanka, and Pakistan). Second, the paper extends the analysis by disaggregating the RE by two sources, namely solar and hydro, to obtain a concrete understanding on the tourism-RE nexus. Third, the paper provides few policies suggestions for sustainable tourism development based on the holistic empirical analysis.
The cross-sectional dependency tests and slope homogeneity tests have been done to check dependency and heterogeneity in the cross-sections. We have then applied CIPS and CADF to identify the unit root process of the variables. Then, second generation cointegration tests have been applied for ensuring cointegration. Dynamic Commonly Correlated Effect (DCCE) and panel Autoregressive-Distributed Lag (ARDL-PMG) methods have been used for LR estimation of the concerned variables.Dumitrescu and Hurlin (2012) panel causality test has been done to check LR causalities. Finally, Variance Decomposition methodology has been conducted to observe the impact of tourism on REs in the future.
The remaining paper is organised as follows. Section two discusses relevant literature from the existing body of knowledge. Section three elaborates on the methodology and the dataset used in the empirical analysis. Finally, sections four and five illustrate the results and discussions and the conclusions and policy recommendations, respectively.
2 CRITICAL REVIEW OF EXISITNG LITERATURE
A notable amount of literature can be found that focuses on understanding the effect of tourism towards economic prosperity across the globe. These studies have shown that tourism has direct and indirect positive effects on the economy (Mérida and Golpe 2016;Balsalobre-Lorente et al. 2021c;Leitão and Balsalobre-Lorente 2020;Amin 2021). Many tourist agents, such as airlines, travel agencies, and hotels, play an intermediary role in linking tourism and economic growth (Liu and Song 2018). The balance of payment, foreign currency earning, foreign direct investment, job creation, productivity, etc. have an indirect linking role for tourism and economic development (Balsalobre-Lorente et al. 2020;Šergo 2020;Mérida and Golpe 2016;Brida et al., 2016;Paramati et al. 2017a,2017b).
Output growth of an economy is highly dependent on energy worldwide (Amin and Khan 2020). Thus, investigating the linkage between energy and economy has attracted many scholars over the past few decades. For a broad review of the relationship between the variables mentioned above, different methodological approaches have been used in many previous literature works. The significance of energy usage on economic growth is identified in a number of literatures (Zhang and Cheng 2009;Hossain and Saeki 2012;Tang et al. 2013;Śmiech and Papież 2014;Balsalobre-Lorente et al. 2019;Oliveira et al. 2021).
On the other hand, there is a puzzle investigating the associative linkage of RE uses and economic growth for different countries. A significant number of studies could not determine the association of clean energies and output growth (Menegaki 2011;Yildirim et al. 2012). However,Fang (2013) for China showed that consumption of RE sources enhances per capita GDP. On the other hand,Ocal and Aslan (2013) observed that RE consumption harms Turkey's economic growth.
The specific use of energy is seen for different purposes in the tourism industry, such as transportation and facilitation of various tourism destinations (Adedoyin et al. 2020;Hansson et al. 2002). The tourism industry has now been considered as an energy consumer around the world. The consumption of fossil energy sources by the tourism industry is creating detrimental effects on the environment. Deforestation, water pollution, and carbon emission are causing severe damage to the island's communities (Gössling 2002;Cárdenas and Rosselló 2008).UNWTO (2012) stated that tourism is useful in different development issues, including environmental protection and creating economic opportunities for the locality if managed properly.
The linkage between energy and tourism can theoretically be discussed from three points. Firstly, energy acts as a key element in the tourism industry that helps and accelerates various activities (Becken 2011). Secondly, energy is seen as a retardation for the tourism industry. The use of fossil energies negatively influences the surroundings, which also hampers the local consentaneity for tourism development (Frantál and Kunc 2011). Thirdly, modern and environmentally friendly sources of energy can be a destination for tourism. For instance, hydro-electric and wind farms can be considered a tourism destination (Frew 2008).
Tiwari et al. (2013) examined the inter-relationship among climate change, tourism, and energy consumption with annual data of 25 OECD countries. The data span for this empirical analysis was from 1995 to 2015. According to the Impulse Response Functions (IRFs) generated from PVAR, the effect of one standard deviation shock in both energy consumption and carbon emission marginally increase tourism activity. Similarly, shock in tourism slightly increases carbon emission. However, there is no response in energy consumption due to the shock in tourism. Instead, shock in energy consumption yields no response in climate change parameter.
From the South Asian perspective,Amin et al. (2020) studied the underlying connection between inbound tourism and energy uses, starting from 1995 to 2015. After analysing the panel data, they found that tourism and energy have a unidirectional relationship in the LR, where the causality runs from tourism to energy consumption. They further revealed the existence of the tourism-led growth hypothesis in South Asian. Finally, they suggested that energy policies that can help sustain tourism activity are highly essential for South Asia's tourism industry development.
As per the discussion above, it is now clear that tourism can be considered as an important tool for enhancing economic development, and it is highly attached to energy. Given the tourism and energy relationship, accelerating RE development can be vital to ensure energy security in tourist destinations for achieving green and sustainable tourism. However, only a few studies have looked into the relationship empirically, resulting in a knowledge gap in the literature. Using annual data for Tunisia spanning from 1990-2010,Jebli et al. (2015) studied the linkage between RE and inbound tourism consumption. Applying the ARDL estimation method, they found that utilising renewable sources can increase inbound tourism in the LR. Furthermore, a bidirectional causality is found between tourism and RE consumption in the LR. However, no short-run (SR) casualty is observed between the concerned variables.
Zhang and Liu (2019) conducted a panel empirical investigation for ten Asian nations to reveal the dynamic linkages among some crucial variables using date from 1995 to 2014. Estimation results showed that a positive percent change in tourism could increase carbon emission by 0.22 percent. LR causality results obtained from Dumitrescu-Hurlin panel causality indicated tourism has unidirectional causation with RE. Therefore, RE consumption policies should be greatly considered to make the tourism industry eco-friendly. On the other hand,Leitão and Balsalobre-Lorente (2020) showed a negative relationship between tourism and CO2 emission. The result indicated a sustainability pattern in the tourism industry of the European Union (EU). They found a negative relationship between RE and CO2 emission, indicating RE as a driving indicator for achieving green growth. Similarly,Balsalobre-Lorente et al. (2021b) found similar results while considering Italy, Greece, and Spain. The results indicated that RE and CO2 emission are negatively related.
Castilho et al. (2021), using two-stage Data Envelopment Analysis (DEA) and ARDL-PMG, highlighted that tourism arrivals are linked with lower eco-efficiency. On the other hand, capital investment in the tourism industry and direct tourism contribution to employment increase tourism eco-efficiency. The study finally concluded that investments in sustainable tourism projects and managing carrying capacity would promote eco-efficiency in tourism.
Jebli et al. (2019) used data from 22 countries from Central and South America covering from 1995 to 2010 and investigated the association among tourism, RE, economic growth, foreign direct investment, and CO2 emission both in LR and SR. They revealed a LR bidirectional causal relationship between tourism and RE consumption. Furthermore, no SR causality between tourism and RE consumption is revealed. As a policy recommendation, it was advocated that the RE industry development can be a vital pathway for attaining LR expansion of tourism activities in the selected countries.
Islands of the Mediterranean tend to attract intense tourism activity and suffer from tourism's adverse effects on the environment.Michalena (2008) studied tourism interaction with energy use in these islands and advocated for introducing abundant energy sources (renewables) in islands. She further added that such an introduction certainly could help address the challenges and vulnerabilities to make these islands self-sufficient and help achieve tourism sustainability in the LR.
3 METHODOLOGY AND DATA
3.1 MODEL SPECIFICATION
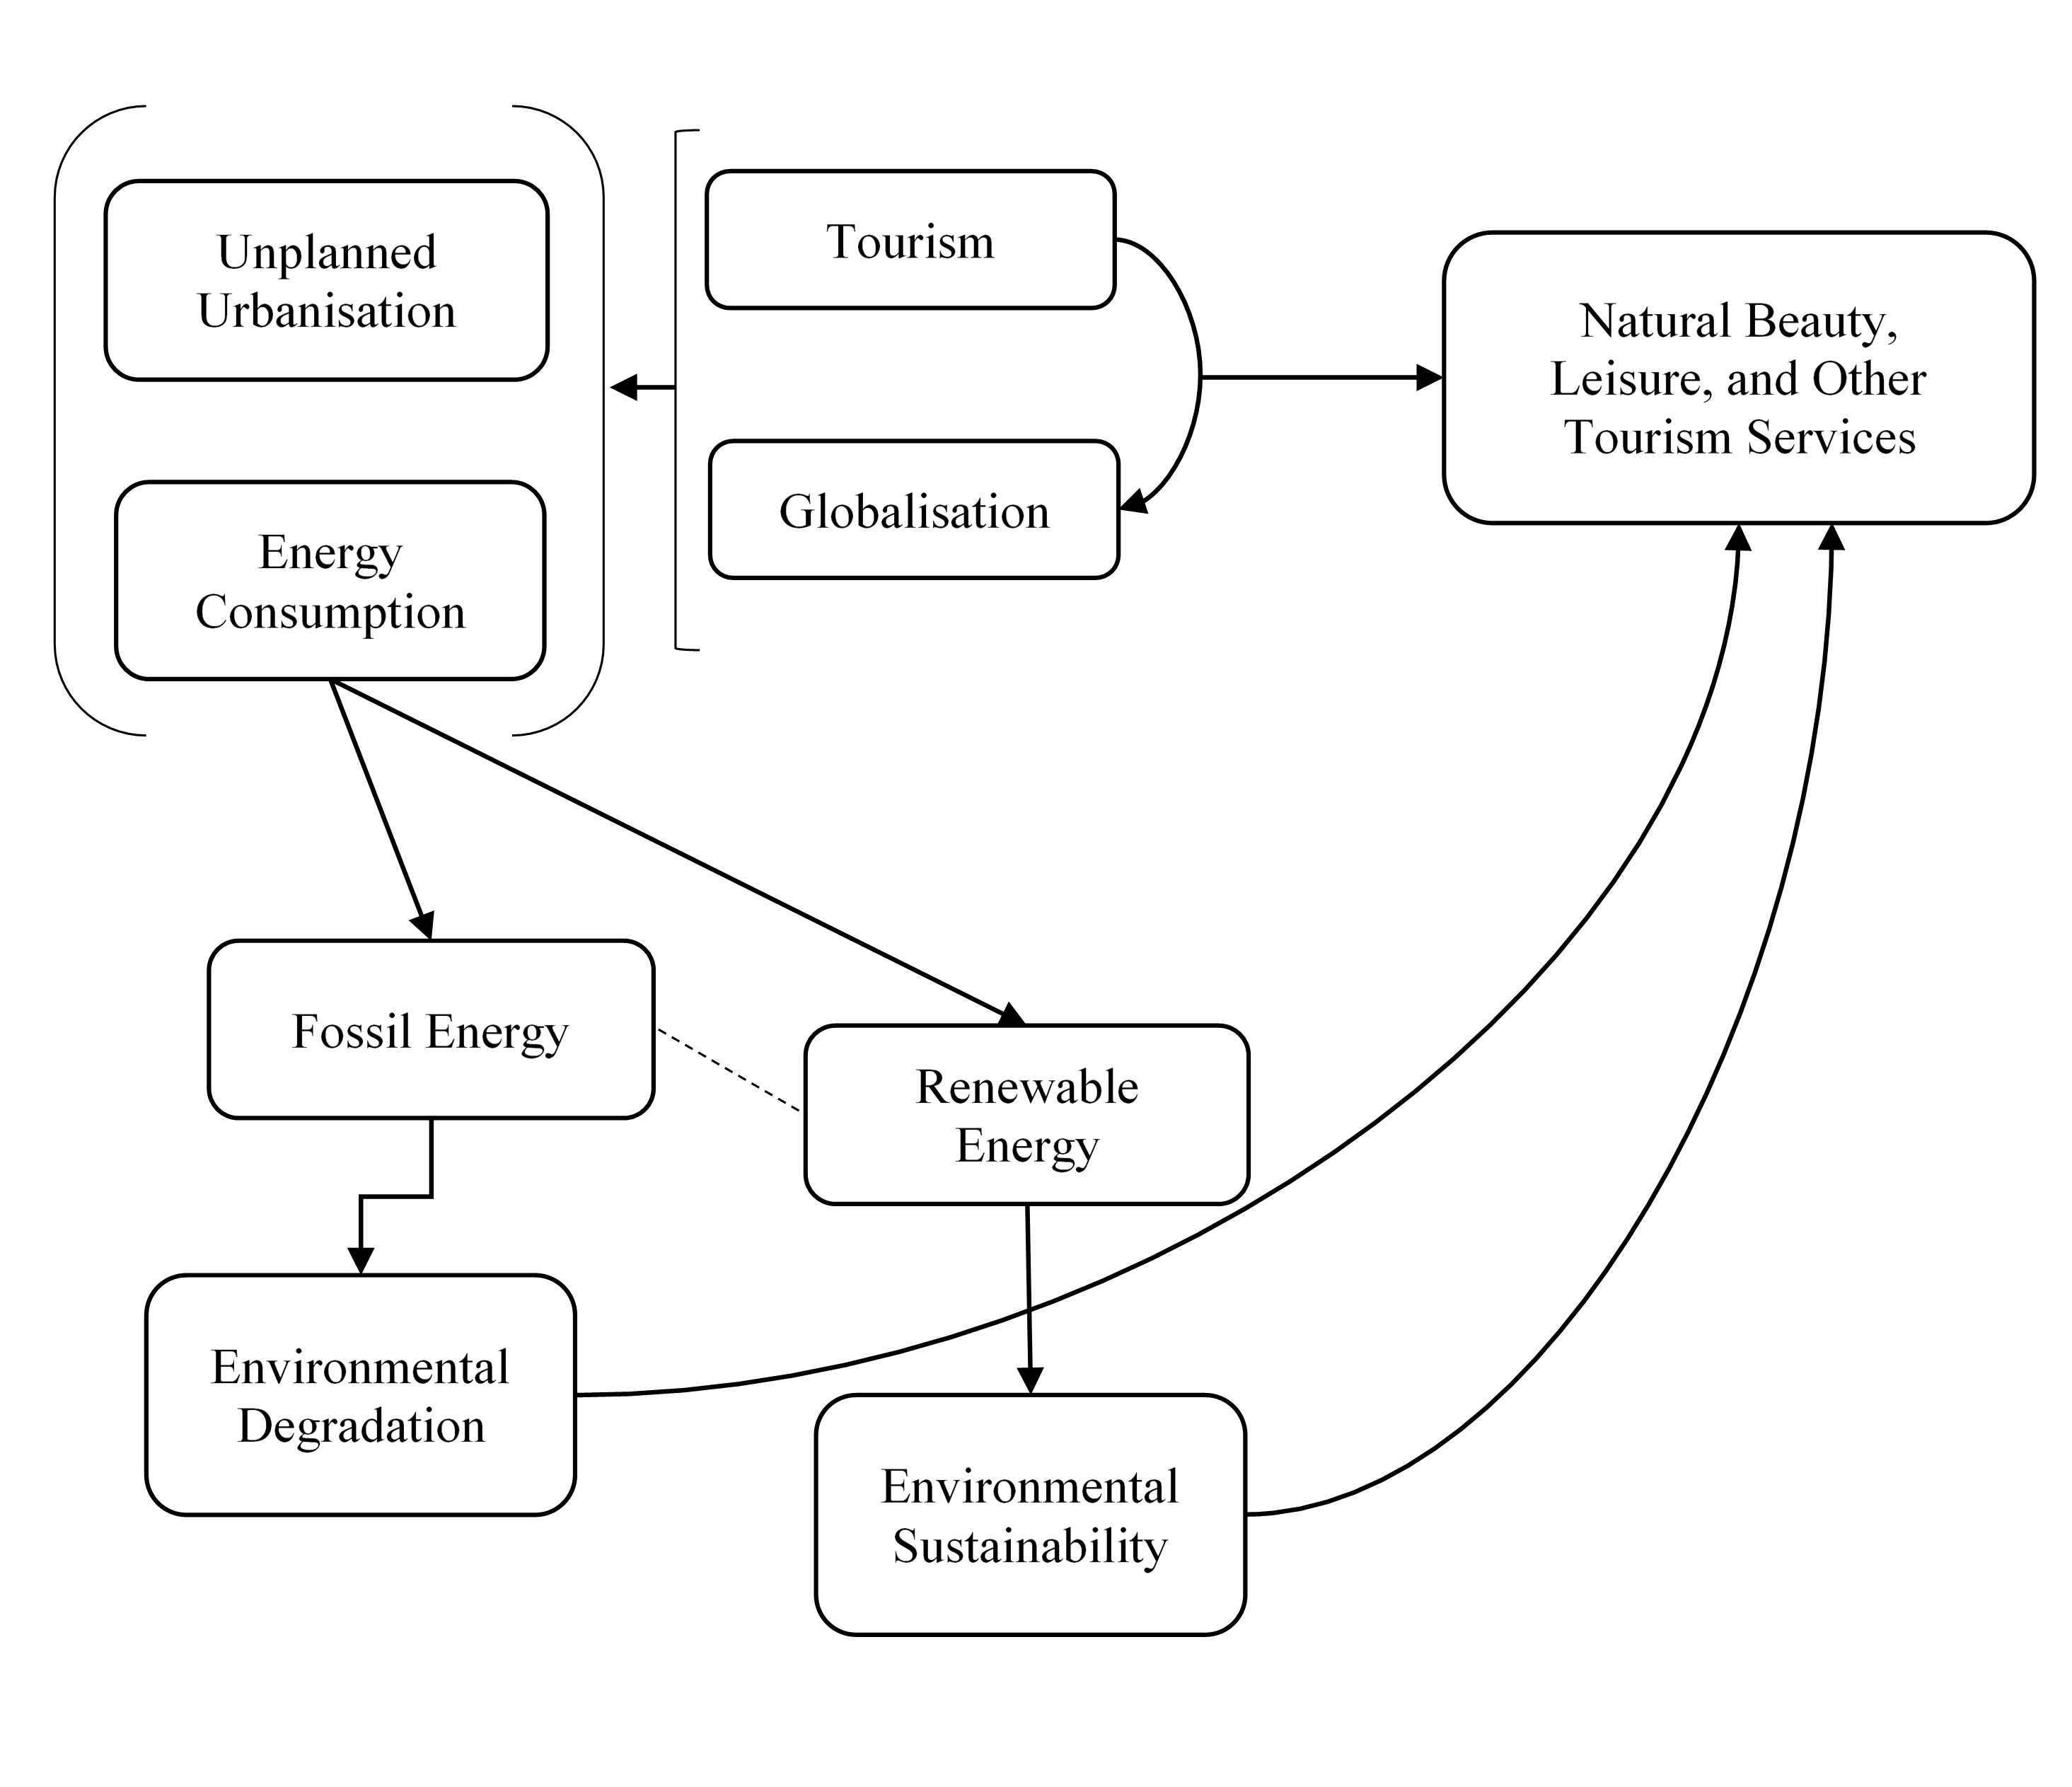
It is argued that as the tourism industry flourishes, the host economy gets the opportunity to connect with the countries (i.e. globalisation) of the origin of the tourists and earns socio-economic benefits through the promotion of natural scenic beauty, leisure, and other tourism services. However, the enhancement of tourism activities can also become a pathway for globalisation's many unwanted consequences, asDreher et al. (2008) andBalsalobre-Lorente et al. (2020) stated. Such as unplanned urbanisation, resource depletion through heavy fossil energy consumption, and environmental degradation. However, some studies argue that tourism is one of the pathways to increase RE shares in the energy mix of a particular economy or group of economies (Frew 2008;Jebli et al. 2019). Since the tourism industry is significantly correlated with many environmental aspects that attract tourists (beaches, islands, forests, mountains, etc.), and its nature is relatively energy-intensive, RE consumption may see an upward trend (Figure 1). Therefore, this paper aims to analyse the nexus between tourism and RE consumption in the selected South Asian countries. FollowingAmin et al. (2020),Zhang and Liu (2019), andFrantál and Urbánková (2017), we consider the model stated by equation (1).
REit=f(GDPit, Tourit) (1)
In equation (1), REit = total RE consumption in the selected countries over the time of t. Tourit= International Tourism measured as total international tourist arrival. Finally, GDPit= Gross Domestic Product.
Alongside checking the relationship between total RE consumption and tourism, we also investigate the relationship at the disaggregated level. As solar RE and hydro RE are widely used for power generation in the South Asian region [1] (IEA 2019), we consider equation (2) and (3) for analysing the relationship of tourism with solar and hydro energy consumption, respectively. Please seeTable B in the Appendix for the share of renewables in power generation in South Asia in 2018.
SREit=f(GDPit, Tourit) (2)
HREit=f(GDPit, Tourit) (3)
From both equations (2) and (3), SREit and HREit refer to solar and hydro consumption, respectively. For the analysis, we transform all three functional equations into log-linear structure expressed by equation (4), (5), and (6). An important feature of log-linear equations is that one can explain the estimated coefficients in terms of elasticity (i.e., in percentage change).
lnREit=β1+αlnGDPit+βlnTourit+εit (4)
lnREit=β2+γlnGDPit+ϑlnTourit+εit (5)
lnREit=β3+ΨlnGDPit+ψlnTourit+εit (6)
3.2 ECONOMETRIC METHODOS
3.2.1 CROSS-SECTION DEPENDENCE AND SLOPE HOMOGENEITY
It is widely known that panel data are frequently inter-linked. The Cross-Sectional Dependence (Pesaran 2004), Breusch-Pagan LM (Breusch and Pagan 1980), Pesaran Scaled LM (Pesaran 2004) methods have been applied to investigate the cross-dependency in the concerned variables. Most of the previous studies assumed a complete slope homogeneity. Recent literature have rejected the assumption and advocated the existence of heterogeneous slopes across the sections. In this paper,Pesaran and Yamagta (2008) has been incorporated to study the concern of slope homogeneity.
3.2.2 SECOND GENERATION UNIT ROOT TESTS
Two of the most used unit root tests, cross-sectionally augmented IPS (CIPS) and cross-sectionally augmented ADF (CADF) have been used in our paper.Pesaran (2007) argues that these second generation unit root tests include the hypothesis of cross-sectional dependence. The tests' mechanism is homogenous; still the only anomaly is that the CIPS uses the cross-sectional average of the CADF test. For instance, vit if is the target variable and is the residual term, the conventional ADF frame can be explained by equation (7)
(7)
In equation (7) ∆ specifies the first differenced operator. α and T are the constant parameter and parameter to capture the effect of time trend, correspondingly. Both tests assumes a primary hypothesis of non-stationarity in the panel dataset, and a secondary hypothesis of stationarity in the panel dataset.
H0:βi=0
3.2.3 PANEL COINTEGRATION TESTS
Westerlund (2006,2005) showed that the asymptotic distribution in panel cointegration tests is biased.Westerlund and Edgerton (2007) proposed a new version, which is consistent with the LM test proposed byMcCoskey and Kao (1998) but with the application of bootstrap procedure. Introduction of bootstrap procedure has been done to solve the biasedness issue.
For yit and xit, we can express the relationship stated in equation (8). It is worth mentioning that yit is considered as a random scalar and xit is categorised as K dimensional independent variables.
(8)
(9)
In equation (8), α ̂i and β ̂i are the FMOLS estimators. The error terms in equation (8) are defined as,
(10)
Where μit~(0,σ2) and as a result, the following can be written,
(11)
For all t, wit=(uit, v'it) and ε_it is the term that captures the error process with zero mean. Furthermore, this innovative version of the LM procedure also incorporates the cross-section dependence assumption and controls heterogeneous serial correlation. If the null hypothesis of the earlier LM test byMcCoskey and Kao (1998) is used under cross-sectional dependence, the test performs poorly. As a result, the null and alternative hypothesis are being considered as follows,
Ho:σ2=0 for all cross-sections against H1:σ2>0 for at least one cross-section.Westerlund (2008) in this case suggested using a bootstrap technique the AR process can be written as follows for capturing equilibrium error within the system,
(12)
Now, test statistics from the LM procedure can be found by the following expression,
(13)
In equation (13), ω ̂i-2 is the LR variance and S_it is the partial sum process of e ̂it.
The Durbin-Hausman (Westerlund 2008) second generation panel cointegration test that captures the inter dependencies within the cross-sections of the panel data. Furthermore, the Durbin-Hausman test is independent of any information regarding the integration order. In another way, this test can be employed regardless of knowing if variables are integrated in a different or same order. The test gives its decision based on the results of two tests. The first one provides within panel test statistics, and it is known as the Durbin-Hausman Panel (DHp) test. The second is referred as the Durbin-Hausman Group (DHg) test, which provides within group statistics.
(14)
(15)
Considering energy cross-sections of the dataset, 𝐷𝐻𝑝 tests 𝐻𝑜: 𝜗𝑖 = 𝜗 = 1 for all cross\u0002sections against 𝐻1 : 𝜗𝑖 = 𝜗 < 1. In equation (14), the OLS (pooled) and IV regression (pooled) coefficients are 𝜗̂ and 𝜗̃. Moreover,
and finally, . On the other hand, 𝐷𝐻𝑔 tests considers hypothesis (considering each cross-section) 𝐻𝑜: 𝜗𝑖 = 1 contrary to 𝐻1 : 𝜗𝑖 < 1 for minimum one cross section if not all. Similar to equation (14), in equation (15), the OLS (pooled) and IV regression (pooled) coefficients are 𝜗𝑖and 𝜗̃ i . Next, and 𝜔𝑖 2 is the LR consistent estimator variance.Both of the tests follows general distribution assumption for the primary hypothesis. Needless to say N,T→∞ then N/T→0. The substitute hypothesis approaches to positive infinity, and the right tail of the standard normal distribution is used for accepting or rejecting hypothesis (Westerlund 2008).
3.2.4 ESTIMATION METHOD OF COINTEGRATED FACTORS
LR cointegrating factors can be estimated by Dynamic Commonly Correlated Effects (Pesaran 2006) if the variables are cointegrated in the LR. DCCE allows for slope homogeneity and cross-sectional dependence
Let us suppose a linear panel heterogeneous regression model for i=1,2,3,…,N ;t=1,2,3,…,T
(16)
From equation (15) εit can be defined as,
(17)
In equation (15) and (16), gt and jt indicates unobserved and observed common effects. ϑit is the individual specific error term which has an independent distribution of its own. The general conversion of the model can be written as follows,
(18)
Pesaran et al. (1999) propose the Pool Mean Group (PMG) panel ARDL model to capture heterogenous LR and SR coefficients of the variables while augmenting the variables' inter-dependency. It controls the LR parameters to be constant across the selected countries and allows error variances, intercepts, and SR parameters to vary (Mensah et al. 2019). One of the major advantages of ARDL (PMG) estimation is that it is able to provide robust estimation results even if variables have different order of integration.
(19)
By following equation, one can obtain the error correction term.
(20)
Where φi, is the error correction term that indicates the LR equilibrium adjustment speed.
3.2.5 PANEL CAUSALITY TEST
Having the LR cointegrating relationship of the variables, and the coefficients in the LR are estimated are estimated, it would be of interest to see if there is Granger causality among the variables. The presence of Granger causality will have policy implications in terms of energy-regulating policies affecting trade openness and vice versa. For this purpose, the causality test proposed byDumitrescu and Hurlin (2012) has been used. One of the advantages of this test is that it allows the parameters to vary within the panel sections. Furthermore, the test is robust in terms of controlling the dependency of cross-section. Finally, it is highly efficient even if the sample size is relatively small. It is applicable for both unbalanced and heterogeneous panel data where time frame can be greater or less then the number of cross sections (T>N or T<N).
The null hypothesis is stated as 𝐻0 : 𝛽𝑖 = 0
On the other hand,
3.2.6 VARIANCE DECOMPOSITION
In the multivariate analysis, variance decomposition is known as a classic statistical method for uncovering structural patterns in a broad set of variables (Lütkepohl 2010). Variance decomposition is immensely used for interpreting and analysing inter-related variables in Vector Autoregressive (VAR) framework (Tiwari et al. 2013). The process is also sometimes referred as Forecast Error Variance Decomposition (FEVD). FEVD estimates the fraction from the forecasted variance of error of an endogenous variable in the model, which can be further used to orthogonalised shocks to itself and other endogenous variables in the model (Lütkepohl 2010;Zaman et al. 2016).
3.3 DATASET
Data for Gross Domestic Product (GDP at Constant, USD) and International tourist arrival have been retrieved from the World Development Indicators (World Bank 2018). On the other hand, data for total RE (Kilo Ton of oil equivalent), solar RE (Ton of oil equivalent), and hydro RE (Ton of oil equivalent) are collected from theBP (2018). The sample is limited to the timeline for which data for all variables are available, 1995-2018 (24 observations for each cross-section).Table 1 shows a summary of the dataset. It is observable that variables are slightly skewed, as well as the Jarque-Bera procedure of normality provides evidence of rejecting the null hypothesis of normal distribution.
4 RESULTS AND DISCUSSIONS
Table 2 shows the results of three cross-sectional dependency tests for the variables. According to the results, there is a presence of strong cross-sectional dependency (at 1 percent) in each of our variables of interest.
| Criteria | RE | SRE | HRE | GDP | Tour |
| Breusch-Pagan LM | 212.08*** | 110.67*** | 40.28*** | 238.03*** | 123.00*** |
| Pesaran Scaled LM | 44.07*** | 29.05*** | 8.74*** | 49.87*** | 24.15*** |
| Pesaran CD | 14.54** | 10.49*** | 4.90*** | 15.43*** | 10.75*** |
Slope homogeneity test inTable 3 confirms the presence of heterogeneity in the variables of the proposed models. One point to be noted that prevalence of heterogeneity along with cross-sectional dependency can lead to distorted results if the impacts are not accounted for. To incorporate their impacts, traditional panel approaches is found to be ineffective. Therefore, following the recent theoretical and empirical literature, we use second generation panel approaches in this paper for inferring robust results and provide policy suggestions [2].
| Test | Model 1: Test Static | Model 2: Test Static | Model 3: Test Static |
| Delta | 2.47*** | -1.63* | -1.58 |
| Delta adj. | 3.10*** | -1.91** | -1.87** |
FromTable 4, variables are found to be non-stationary at level or I (0). However, all of our variables are found have no unit root problem at their first differenced form. It means concerned variables are I (1).
We next move on to assess the presence of a meaningful cointegration relationship of the variables in each of our proposed models. In doing so, we have adopted second generation panel cointegration tests. Both cross-section dependence augmented cointegration tests confirm cointegration. Results are shown inTable 5.
| Model | LM Bootstrap Test | Durbin-Hausman Test | ||
| C | C and T | DHG | DHP | |
| Model 1 | 1.13 | 2.62 | 1.47* | 3.63*** |
| Model 2 | -0.30 | 1.41 | 0.70 | 2.05*** |
| Model 3 | 1.02 | 2.81 | 0.89 | 3.17*** |
After confirming the cointegration of each proposed model's variables, we carry on the analysis by estimating the LR coefficients and causal relationships [3].Table 6 shows the results of LR estimates of the explanatory variables of our three models. In model 1, we have considered total RE consumption as dependent variables. Both the estimation techniques confirm that GDP and tourism are positively related to RE consumption. From the results, a 1 percent rise in GDP leads to a 0.61 and 0.34 percent upsurge in RE consumption in the LR from DCCE and ARDL (PMG) approaches, respectively. From the tourism's perspective, a 1 percent improvement in international tourism increases RE consumption by 0.10 percent in the LR from both DCCE and ARDL (PMG) approaches, respectively.
A similar pattern can be found when we look at the relationship from the disaggregated level of RE. From model 2, we find a positive association between tourism solar RE consumption in the LR. However, the estimated LR coefficient of tourism from ARDL (PMG) is not statistically significant. According to the DCCE estimation approach, a 1 percent increase in tourism would lead to 0.07 percent in the solar RE in the LR. On the other hand, the estimated coefficient of GDP to solar RE has the expected sign. A percentage increase in GDP can escalate solar RE consumption by 0.29 percent in the LR from the ARDL (PMG) estimation approach. The estimated coefficient of GDP from DCCE is 0.25, but the value is not statistically significant.
From model 3, we find that a rise in inbound tourism by 1 percent leads to a 0.03 percent increase in hydropower consumption in the LR from both approaches. From the other side of the picture, the ARDL (PMG) estimation approach suggests, a 1 percent proliferation in GDP enhances hydro RE consumption by 0.20 percent in the LR. Though the estimated coefficient of GDP from DCCE has expected sign, it is found to be insignificant.
Activities associated with the tourism industry are capital-oriented and highly dependent on energy (Amin et al. 2020). However, the poor accessibility of different energy sources is a significant issue that can hinder tourism-related activities' sustainability. For instance, inadequate grid connectivity and inefficient distributional system due to improper supply chain management may negatively affect the tourism industry. Thus, to avoid uncertainty and maintain tourism services in different tourist regions, the consumption of REs increases as an alternative source besides other conventional energy sources.
On the other hand, heavy dependence on conventional non-RE sources can lead to environmental degradation that reduces the natural beauty of the tourist areas and increases pollution (Amin et al. 2019). Loss of natural beauty and an increase in pollution can discourage many inbound tourists, which further influence different stakeholders associated with tourism-related activities to focus on REs to meet their demand. From the results, the impact of tourism on solar RE is higher than that of hydro RE. One of the main reasons behind such a pattern is the high availability of solar RE, and it is more natural to utilise in different tourism activities.
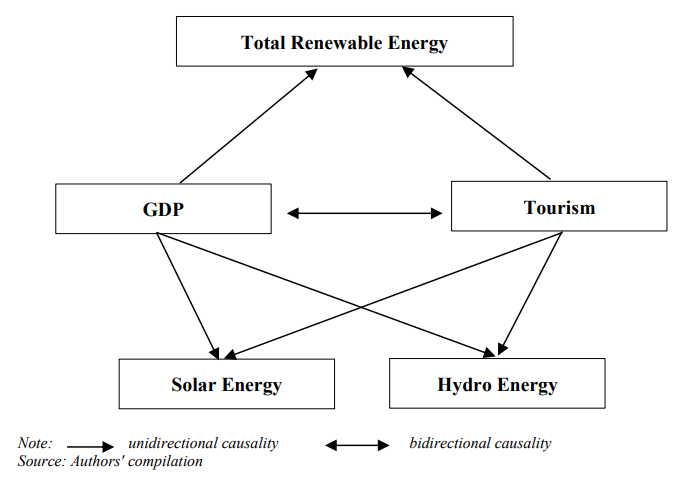
Table 7 illustrates the Dumetrescu-Hurlin causality results. We reveal a one-way causality from tourism to total RE, solar RE, and hydro RE in the LR but not vice-versa. The outcome of the causality between tourism and the total RE consumption is consistent withZhang and Liu (2019). Also, other unidirectional causalities support our proposed model specifications.
We also observe a bidirectional causality between GDP and tourism in the LR. A unidirectional causality can be seen from GDP to total RE. Additionally, one way causalities are observed from GDP to solar RE and hydro RE consumption in the LR; however, not the other way around.Figure 2 captures all of the causality results.
We further aim to see the linkage of the variables in the respective models from the forecasting framework. The analysis has been carried out through the FEVD technique. The detailed results are depicted in the Appendix (Table C-E).Figure 3 shows the variance decompositions of total RE, solar RE and hydro RE consumptions, and it reveals that in the LR (over the next 15 years), 1.12 percent of the variation in the total RE consumption can be explained by tourism. On the other hand, GDP can explain 0.63 percent of the variation in the total RE consumption. Alternatively, percent of variation explained in the solar RE consumption by tourism in the LR is 4.22 percent whereas, variation explained by GDP is approximately 1 percent. Finally, tourism can explain 0.91 percent variation in the hydro RE consumption, while GDP can explain 0.84 percent variation in the LR.
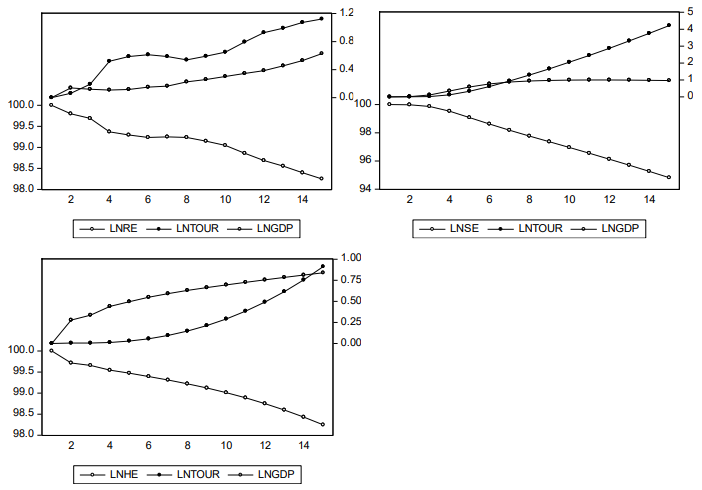
Source: Authors' compilation
It is worth noting that the percentage of variation in RE (total, solar, and hydro) consumption by tourism is not that high. It is because there are other major factors besides tourism, which can significantly explain variations in RE consumption such as energy prices, oil price shocks, access to RE technology, globalisation, and attitude towards RE by consumers.
5. Conclusion and Policy Recommendations
Tourism is now one of the emerging industries from the global perspective, linked with different socio-economic aspects, and has important policy implications (Nepal et al. 2019). However, the tourism industry's underlying connection in South Asia has not yet gained attention in the existing literature, especially in the case of tourism-energy nexus. Therefore, following the pioneering work ofAmin et al. (2020), we scrutinise the possible relationship between tourism and RE uses at aggregate and disaggregate levels for selected South Asian countries using annual data from 1995-2018.
We have applied different robust panel econometric methods in this paper. Interdependence of the variables within the cross-sections and the slope homogeneity issue have been checked cross-sectional dependency and slope homogeneity tests. The second-generation CIPS and CADF panel unit root tests are considered to examine the variables' stationarity property. The existence of meaningful LR association among the variables from each of the models has been analysed by robust Durbin-Hausman and LM Bootstrap panel cointegration tests. After that, the LR estimation of the concerned variables has been carried out by performing DCCE panel ARDL (PMG) estimation approaches. Panel LR causalities have been confirmed by applying the Dumetrescu-Hurlin non-granger causality test. Finally, Variance Decomposition analysis has been used to find the effect of tourism on REs in the future.
Given cross-sectional dependence and heterogeneity, we have revealed that all the variables are stationary at their first difference form. Panel cointegration tests have showed the presence of a LR association among the variables of the proposed models. From the obtained results of DCCE and panel ARDL (PMG), we have found that tourism has a positive association with total RE, solar RE, and hydro RE consumption in the LR. Furthermore, GDP has a positive impact on REs in the LR. On the other hand, unidirectional causalities are running from tourism to total RE, solar RE, and hydro RE consumption in the LR. Finally, Variance Decomposition analysis has revealed that tourism can explain predicted variations in RE's use for the next 15 years.
The tourism industry has recently gained momentum in the South Asian region. As an enhancement of tourism activity can stimulate RE consumption, proper energy policies are needed that can support the further sustainable growth of the tourism industry. Plans for developing tourism-related infrastructures can be recommended to facilitate RE expansion in the tourist regions. The revenues earned from the tourism industry can further be utilised to establish mini solar grids, small-scale hydropower plants, biogas plants, expand renewable grid connection, improve solar home system technologies, etc., in the regions where the number of tourist spots is high. Implementing such policies can improve the socio-economic aspects of the residents and the local environment through positive externalities.
Nevertheless, achieving greater success while executing the discussed policies, followingImam et al. (2019), we argue that the institutional robustness in the intuitional setup needs to be ensured given the common traits of the South Asian region, which have been discussed in the earlier studies. Among others,Ahmed et al. (2021);Amin et al. (2021);Cai and Aoyama (2018); andGhafoor et al. (2016) show that absence of an administrative authority in a fragmented (i.e. decentralised) system prevents and slows the formulation of the appropriate regulatory regime and execution framework. Furthermore, potential investments, especially in clean energy and demand-side management, also fade out due to a lack of improper administrative mechanisms (Amin et al. 2021). As the tourism industry accelerates renewable energy augmentation process, detailed mechanisms for legitimacy reforms and different financial schemes should be prepared to make renewable energy projects less stringent. Finally, a regional collaboration by forming a regional committee to facilitate renewable energy expansion in the tourism industry can be very effective for developing a green tourism industry in the South Asian region.
A possible extension of the analysis is to assess the liaison between tourism expansion and RE in other emerging countries, where the tourism industry is gaining momentum. Another avenue of extension is to analyse the relationship by disaggregating the tourism industry into different sub-sectors. This will help to formulate sub-sector-specific tourism-friendly RE policies in the South Asian region. One of the main limitations of the paper is the absence of control variables. The use of control variables such as regional dummy, country dummy, institutional reforms, etc., would have made the analysis even more dynamic. Also, we have only considered two disaggregated sources of RE. Augmentation of other sources (like biogas and wind) might have given the analysis another interesting path of discussion for policy implications.