
INTRODUCTION
New ordering habits are emerging in developing countries, including online ordering for various cuisines (Fortune, 2022). Considerable opportunities were presented in the sector as full-service restaurants joined the takeaway market offering new adapted menus. The global foodservice market reached 2.52 billion U.S. dollars in 2021. China, Australia, India, and South Korea are fast-growing markets, with Asia-Pacific estimated to reach sales of US$116.9 billion in 2026 (GlobeNewswire, 2022). International food chains such as McDonald’s remain popular in these countries despite the expansion of other brands (Fortune, 2022). The food sector in Thailand contributes significantly to the hospitality industry, with an estimated 530,000 food service establishments and a 62% growth rate between 2017 and 2021, reaching sales of $ 32.19 billion (Manakitsomboon, 2021). The sales are estimated to increase to $34.48 billion by 2023 despite the pandemic (Li et al., 2020).
The fast-food sector has introduced new technology to reduce costs and support services (Ishak et al., 2021). Systems have been used for a long time in the form of manual self-ordering machines (which produce a ticket) or order forms (Chong, 2022). The introduction of information systems-based (IS) self-service ordering began in the early 2010s (Sun & Song, 2010). App-based ordering systems emerged in the mid-2010s, building on earlier systems that used standalone tablets (Chavan et al., 2015). These systems have been rapidly adopted in the fast-food sector, including major global fast-food chains like McDonald’s (Baba et al., 2020). Ackam (2020,103) states, “McDonald’s identified the role of technology in its growth strategy.” To reach its strategic goals, the company emphasized three accelerators ‘digital,’ ‘delivery,’ and experience of the future.’ These accelerators focus on customer interaction with the service. The self-service ordering systems do have advantages, such as allowing customers to easily customize their orders and reducing costs (thereby improving value for money) (Baba et al., 2020), labor costs, and wait times are reduced (Leung et al., 2021).
Despite the growing popularity of self-service technologies in various consumer contexts, there has been limited research into their use in fast-food restaurants and how this affects customer perceptions (Leung et al., 2021). There are only a few empirical studies that examined the role of self-service ordering technologies in restaurants, with most studies focusing on the restaurant service but not considering the role of technology (i.e., Namin, 2017; Nguyen et al., 2018; Slack et al., 2021) or considering other forms of consumer self-service technology nor focusing on the fast-food context (Narteh, 2015; Djelassi et al., 2018; Iqbal et al., 2018; Kim & Park, 2019; De Leon et al., 2020; Marvin & Tjhin, 2020). Interestingly, studies have focused on developed economies, and less scholarly attention has been devoted to the developing countries’ context (Hassan et al., 2020), especially in the intention to reuse electronic services (e-services).
There is also a concern about dehumanizing the restaurant experience, as studies propose that customers were less inclined to visit restaurants that were using kiosk technology (Johnson, 2018). On the contrary, a consumer survey conducted in 2019 found that over 65% of the participants were more likely to go to restaurants providing self-service kiosks; participants even stated that if more than four people were queuing, they preferred to order from the kiosks (Tillster, 2020). The question of dehumanization of the service experience is only likely to become more pressing as such technologies become more embedded in the hospitality industry, particularly in contexts like fast-food restaurants, where the emphasis is on cost and speed rather than other aspects of service (Chong, 2022), especially with the introduction of self-ordering kiosks (SOKs) and the challenges the sector faces after the pandemic.
Quick-service restaurants’ steadfast growth is evident in the Thai restaurant industry. Manakitsomboon (2021) reported that as of 2019, 31.4% of the restaurant industry revenue was from fast-food businesses, including everything from global fast-food chains like McDonald’s to traditional Thai street vendors. The number of fast-food restaurants increased during the COVID-19 pandemic due to increased demand for online food delivery services (Manakitsomboon, 2021). McDonald’s renovated their outlets with digital platforms, including SOKs, cashless transactions, digital menu boards, and high-speed WiFi (McDonald’s, 2019). Thai people consume fast food at a higher rate than most developing countries (Li et al., 2020). This fact indicates that fast-food restaurants are not only prevalent and growing in Thailand but are also one of the most competitive sectors in the country’s food industry. Uslu (2020, p.23) states that “increasing competition has led to different expectations among customers.” Providing high-quality services and maintaining customer satisfaction are important factors leading to business success and even survival in fierce competition (Uslu, 2020). Based on this, e-service quality may be the key to attracting and retaining customers in digital times and meeting their expectations. A pressing challenge for food service companies is guaranteeing and keeping customer happiness (Baluyot & Pampolina, 2021). Companies value long-term and reliable client relationships (Boon-itt, 2015). Hence, the main objectives are to evaluate customer expectations and identify the aspects of anticipated e-service quality to create loyal and committed customers. As some fast-food restaurant consumers may perceive the use of SOKs as providing low value, even though they may favor the company (Boon-itt, 2015), the issue is how to evaluate such value placed on the use of SOKs, ensure customer satisfaction, and enhance their willingness to use this service again. Satisfied customers will reuse the service and may recommend the business to others (Uslu, 2020). For example, studies propose that McDonald’s saw an increase of 30% at the end of the checkout due to the ‘create your taste’ screens (Applova, 2022). It is, therefore, crucial to identify the factors that influence consumers’ use and reuse intentions to increase the predictability of customer behavior in the fast-food e-service.
This paper investigates what factors influence Thai consumers’ expectations, perceptions, experience, and satisfaction with service quality from SOKs to identify their intentions to reuse the self-service kiosks. SOKs and relevant frameworks may support managers in their decision-making on customer satisfaction and loyalty; hence this study contributes to practices and research in creating customer value from SOKs. Moreover, it highlights how customers perceive e-service from SOKs and their willingness to engage with such technology, including their perceived value and intention to reuse the service. With the development of a model, this study presents an understanding of e-service, with reference to culture and the dimensions that impact the perception of the service quality and intention to reuse. This study proposes that the SOKs service quality positively influences reuse intention in fast-food restaurants; such positive evaluation leads to favorable perceptions of using SOKs.
Small restaurants are using self-service ordering systems, including prepayment machines (Chong, 2022); however, the use of self-service ordering and payment systems is relatively new, as the first system appeared in 2010 (Sun & Song, 2010). The first app-based self-service ordering systems developed for in-restaurant use appeared around 2015 (Chavan et al., 2015). Such systems have been rapidly adopted, mainly in the fast-food sector (Baba et al., 2020). Self-ordering kiosks (SOKs) are among the most diverse technological customer-facing forms. Rastegar (2018, p.4) described a “self-service kiosk as a machine with a large touch screen that enables customers to order food, customize their menu items and even pay their bill without interacting with employees.” SOKs are providing benefits for both consumers and operators. Such customer benefits include easy access to information, customization of the order, reduced waiting time, ease of use, improved experience (Considine & Cormican, 2022; Rastegar, 2018). SOKs provide benefits to consumers with disabilities i.e. hearing impairment, as face-to-face encounter may create stress and irritation (Samengon, 2022). Customers are given self-control, independence and autonomy; however, sometimes they may find it difficult to use technology, posing some challenges in the sector in terms of service quality and customer satisfaction (Baba et al., 2020). For operators, benefits include increased sales, lower labor and operating cost (Arsalan & Latif, 2021).
To be successful, restaurants must be competitive, enhance customers’ experience and gain loyalty; hence SOKs may provide them with the technology to maximize profit and retain the competitive advantage. A key challenge is to manage customer flow during peak hours, requiring trained staff to handle queues (Chong, 2022). SOKs provide managers with data that can be used to manage queues (Arsalan & Latif, 2021). In addition, SOKs are designed to provide ease-of-use features for customers and help lessen the waiting time. However, technology errors due to technical problems may reduce the customers’ intention to use
SOKs. As a result, when errors occur, consumers do not find the process of using SOKs satisfying (Chong, 2022); hence, they may dramatically reduce their usage and acceptance of SOKs (Toh, 2018). On the other hand, studies propose that the use of technology and SOKs positively contribute to increased customer satisfaction and customer experience enhancement, boost operational efficiency, better usage of space, and finally, cost control (i.e., Ishak et al ., 2021; Leung et al ., 2021; Johnson, 2018).
SERVQUAL model of Service Quality
Without considering service quality, it would not be easy to understand what customers experience when encountering a SOK and how it meets their expectations and needs. Service quality has long been recognized as a critical aspect of customer satisfaction and competitive differentiation (Lee et al., 2009). The SERVQUAL model of service quality has been one of the most widely accepted and enduring models (Namin, 2017). The SERVQUAL model is an expectancy-disconfirmation model of service quality, which measures expected and perceived service and identifies any gaps. The five dimensions of service quality are reliability, assurance, tangibles, empathy, and responsiveness (Zeithaml et al., 1990). In the fast-food industry, service quality expectations revolve around reliable and responsive service (Namin, 2017). Although the use of this model for e-service measurement has been questionable (Lee et al., 2009), since the delivery of the service is done through the use of technology, researchers propose that the model is still valid to be used for e-service measurement (Lee et al., 2009; Namin, 2017). Zeithaml et al. (2000) suggested that attributes like efficiency, reliability, fulfillment, privacy, responsiveness, compensation are the suitable measures to assess the e-service quality, or e- SERVQUAL, which are similar to SERVQUAL hence the authors decided not to expand to this version. The e-service definition focuses on the Internet facility to shop efficiently and effectively (Gounaris et al., 2010). However, this definition is narrow as e-service in the fast-food sector should cover all elements of the service offering, such as the interaction with the service provider and the electronic channel (De Leon et al., 2020). E-service is not only the use of the interface but also the convenience, ease of use, and support staff members provide if needed. Hence this paper focuses on the SERVQUAL model as the purpose was to explore whether users would reuse the SOK rather than evaluate the e-service provided SOKs are employed as an additional channel for better, easier, and faster customer service, which practically means they have become part of the experience. However, employees and customers interact to deliver high- quality service; when customers encounter a problem while using the SOK, store employees may help them solve it promptly and effectively. SOKs are related to e-service and e-service quality, which refers to consumers’ evaluation of the quality of the service provided in a virtual marketplace (Santos, 2003; Baba et al., 2020). Although there is limited research on service quality and customer satisfaction from using SOKs, a few studies proposed that previous experience and service quality increase the likelihood of customer satisfaction (i.e., Kim et al., 2013). Other studies conducted in similar contexts proposed that service quality influences customer satisfaction (i.e., Zolkafli et al., 2016) and contributes to SOKs usage and post-purchase behaviour (i.e., Baba et al., 2020). Rastegar et al. (2021) propose that consumers’ decision to embrace SOKs usage depends on their perception of the service quality.
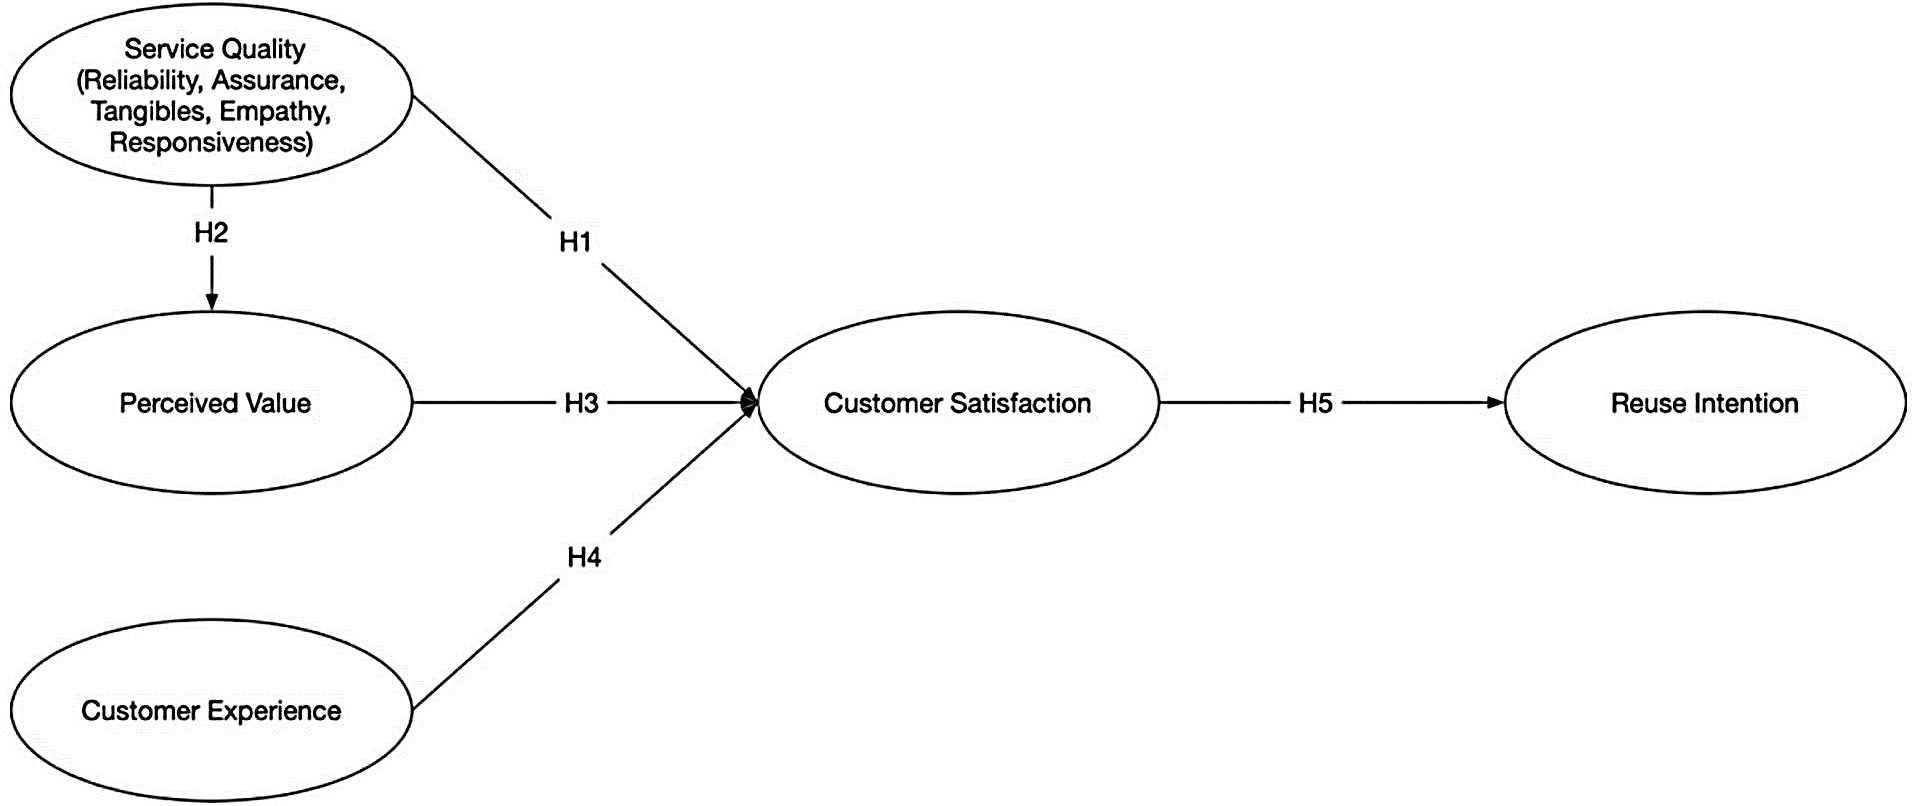
H1: The service quality of self-service ordering kiosks positively influences customer satisfaction.
Service Quality and Perceived Value
Although there is a broader consensus that perceived value relates to the value of the service compared to the cost as evaluated by the customer, there has not been a single consensus theory or definition that supports this. Vakulenko et al. (2018) support the relationship between service quality and perceived value from their systematic review of customer value in self-service technologies, including SOKs. For example, a Fiji fast-food customers survey (Slack et al., 2021) showed that employee service quality, food quality, and physical environment quality significantly influenced the restaurant’s perceived value.
H2: The service quality of self-service ordering kiosks positively influences perceived value.
Perceived Value and Customer Satisfaction
Namin’s (2017) study showed that price-value was the second strongest factor in customer satisfaction after food quality. Slack et al. (2021) also found that perceived value was a significant factor in customer satisfaction with fast-food services. Thus, in terms of fast-food restaurants generally, perceived value can be expected to influence customer satisfaction. Kim & Park (2019) propose that perceived value significantly positively affected customer satisfaction with airport self-service technology. They also proposed a direct influence of perceived value on the intention to use self-service technology. Although there is a gap in the literature related to fast-food ordering via SOKs, evidence suggests that the perceived value of these kiosks will directly affect customer satisfaction. For example, Rastegar et al. (2021) propose that perceived value affects satisfaction directly and indirectly.
H3: Perceived Value of self-service ordering kiosks positively influences Customer Satisfaction.
1.5 Customer Experience and Customer Satisfaction
Customer’s acceptance of technology and using SOKs is vital to ensure smooth operation in fast food restaurants. Kincaid & Baloglu (2007) claimed it is challenging to influence the customer’s mindset and perceptions of new technology. Older generations seem to prefer the traditional service at the kiosk, whereas the youth show higher acceptance rates of SOKs (Toh, 2018). Customer experience and satisfaction differ considering age demographics, as studies proposed that the older the customer, the higher their reluctance to use SOKs (Toh, 2018). There is a paucity of studies on SOKs and customer satisfaction, especially in the Western context. Most studies are conducted in the context of the service industries, i.e., banks and airlines. For example, Marvin and Tjhin (2020) propose that customer experience directly impacts customer satisfaction. Djelassi et al. (2018) found that evaluation of the customer experience affected waiting time satisfaction (both cognitive and affective) and overall transaction satisfaction. The literature on customer experience in the context of SOKs is fragmented and does not follow any specific theory, meaning that the internal relationships between customer experience and outcomes can be difficult to determine (Vakulenko et al., 2018). Generally, studies propose that SOKs provide customers with a new convenient service that increases customer satisfaction. For example, Yieh et al. (2012) concluded that SOKs contribute to customer satisfaction due to the convenience and ease of service use. Ograjensek and Gal (2012) suggested that satisfaction brings out positive emotions in the customers’ experience. Moreover, Shahril et al. (2021) state that customers who receive a remarkable service experience are more likely to be satisfied and spread the information among their friends.
H4: Customer experience of self-service ordering kiosks positively influences customer satisfaction.
1.6. Customer Satisfaction and Reuse Intention
Toh (2018) suggests that a negative encounter with SOKs influences the customers’ perception of this technology, dramatically reducing their usage and acceptance. Studies also propose that customer satisfaction influences revisiting intentions for fast food restaurants (Namin, 2017; Slack et al., 2021). Similarly, customer satisfaction with self-service ordering kiosks should have behavioral consequences such as reuse intentions for the kiosks. For example, Kim and Park’s (2019) study on airline self- service check-in kiosks showed that customer satisfaction had a significant, positive effect on reuse intentions. Another study investigated self-service technology use in Pakistan (Iqbal et al., 2018), suggesting a positive effect of customer satisfaction on reuse intention. Similarly, Rastegar (2018) proposed that revisit is an individual decision highly impacted by customer satisfaction from using SOKs.
H5: Customer Satisfaction positively influences the Reuse Intentions of visitors who use self-service ordering kiosks.
Figure 1: Conceptual framework
A quantitative approach was used to collect empirical data and test the hypotheses proposed in the research model. Most adults in Thailand have access to the internet via smartphones or other devices and seem competent in its use (Kemp, 2022). Hence, a survey was conducted online through Facebook and LINE, two of Thailand’s most popular social media (Kemp, 2022). The study was promoted in various general interest groups, where a link to the survey (in Google Forms) was included. The online survey was active for four weeks in April, 2022 to acquire adequate responses.
The target population for the study was adult Thai consumers who visited McDonald’s. As of 2018, 45% of adult Thai consumers in a consumer survey indicated that they had visited McDonald’s during that year (Statista, 2021). Given that those adults (aged 15 and over) comprised 83.45% of the population of Thailand in 2020 (O’Neill, 2022), this suggests that around 26 million Thai adults visit McDonald’s at least annually and, therefore, may have encountered one of the SOKs.
Purposive, convenience sampling is widely used in consumer behavior research and provides the advantage of collecting data from a large sample (Warne, 2021). Although it is a non-probabilistic sampling method, participants were selected based on their availability and willingness to participate in this study (Warne, 2021). All participants were informed about the purpose of this study and were ensured anonymity. Participants’ criteria included their age (to be above 16 and all age groups to be represented), to have used SOKs, to have visited McDonald’s (to ensure that all reflected on their experience from the same service environment). The participants’ profiles were screened to ensure they matched the criteria. They were instructed to respond if they visited a McDonald’s during the last 3 months and commend their experience.
There were 406 responses, but 27 were removed as they were found to be incomplete. A total of 379 complete questionnaires were
used; a G*Power test indicated that the sample size was sufficient. The participants’ demographic data are shown in Table 1.
Table 1: Participants’ demographic information
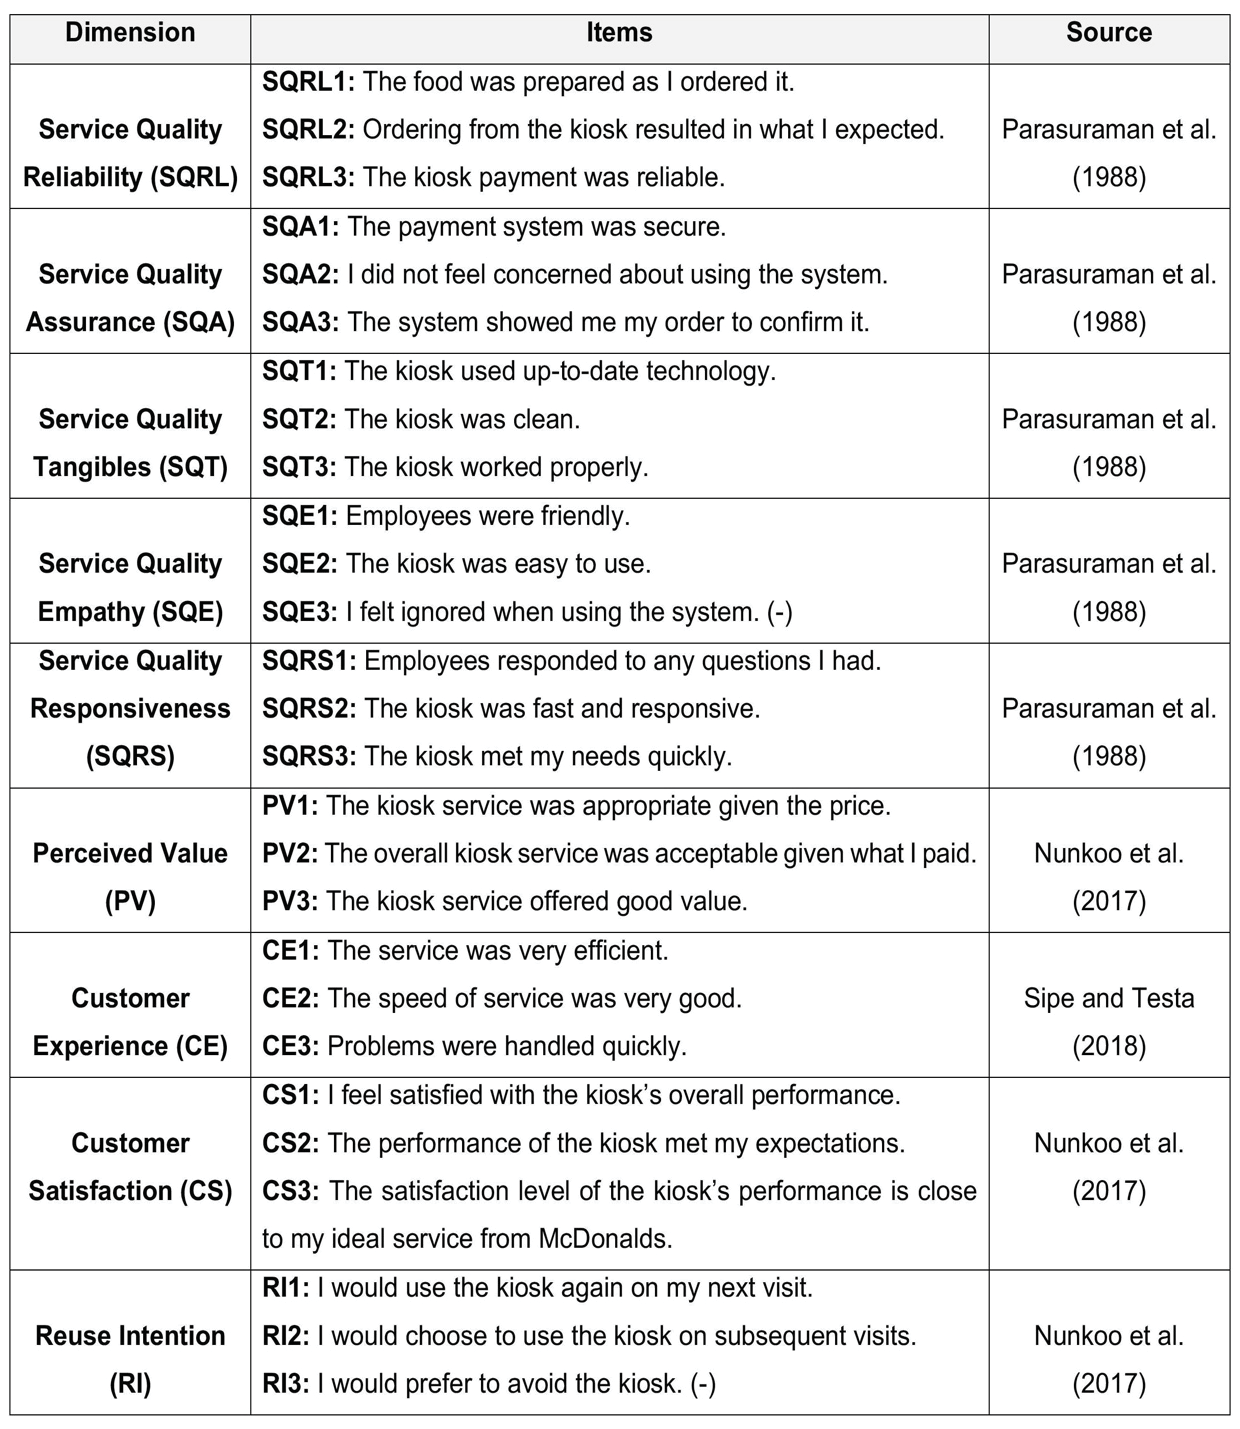
A questionnaire (summarized in Table 2) was designed to test the proposed hypotheses using the following items. All items used a five-point Likert scale; this allowed the researchers to measure and compare attitudes, which may not always be precisely quantifiable (Brace, 2018). The five service quality dimensions were adapted from the original SERVQUAL theory (Parasuraman et al., 1988), with items adapted to the service context. As SOKs are considered to provide e-service, perceived value, customer satisfaction, and reuse intention were also based on an existing instrument that dealt with service quality and satisfaction in hospitality (Nunkoo et al., 2017). The customer experience scale incorporated items from a study on customer experience in the hospitality sector (Sipe & Testa, 2018).
Table 2: Research instrument
Data analysis
Data analysis was conducted in SPSS 28. For this study, inferential statistics aimed to investigate the relationships of the conceptual framework. The internal consistency of the variables was tested, and Cronbach’s alpha coefficient showed that the variables were consistent (Brace, 2018). Table 3 shows Cronbach’s alpha testing results.
Table 3: Cronbach’s alpha testing results
|
Variables |
Cronbach’s Alpha Score |
|---|---|
|
Service Quality Reliability (SQRL) |
0.893 |
|
Service Quality Assurance (SQA) |
0.766 |
|
Service Quality Tangibles (SQT) |
0.767 |
|
Service Quality Empathy (SQE) |
0.819 |
|---|---|
|
Service Quality Responsiveness (SQRS) |
0.735 |
|
Perceived Value (PV) |
0.802 |
|
Customer Experience (CE) |
0.798 |
|
Customer Satisfaction (CS) |
0.791 |
|
Reuse Intention (RI) |
0.757 |
The lowest coefficient was observed for Service Quality Responsiveness (alpha = 0.735). The highest coefficient was observed for Service Quality Reliability (alpha = 0.893). Therefore, the scales were all sufficiently consistent, and no changes were needed before the data collection process continued.
A descriptive analysis explored the participants’ use of SOKs and their intention to reuse them. Hypotheses were tested with multiple regression analysis, which allows for more realistic modelling of the outcome variable (Warne, 2021). The service quality variable was broken into five individual scales, representing the different aspects of the RATER model (reliability, assurance, tangibles, empathy, and responsiveness) (Parasuraman et al., 1988). This led to the inclusion of seven dependent variables in the multiple regression test, including reliability, assurance, tangibles, empathy, responsiveness, perceived value, and customer experience. The dependent variable was customer satisfaction.
Participants were asked several questions (Table 4) about their consumer behavior in relation to McDonald’s, including questions such as frequency of store visits, frequency of self-service kiosk use, and who recommended that they use the self- service kiosks. Interestingly, the majority of the respondents visit McDonald’s once a week, and they use SOKs. About half of the participants reported that they decided to use the kiosks themselves (49.9%). 20.1% were encouraged to use the kiosk by a McDonald’s staff member, while 17.9% were encouraged by friends. The remaining 12.2% received information from other parties, like family members, colleagues, and celebrities. Therefore, the main forces in using the kiosks were individual decisions, staff direction, and friend groups.
Table 4: Consumer behavior toward McDonald’s
Descriptive statistics were calculated with means and standard deviations to show the central tendency and distribution of the items (Warne, 2021). The mean for Service Quality Reliability (SQRL) fell into the ‘agree’ range of the adjusted interpretation scales (M=3.93, SD=0.648); the Service Quality Assurance (SQA) mean was (M=3.88, SD=0.590); the Service Quality Tangibles (SQT) was (M=3.69, SD=0.550); the Service Quality Empathy (SQE) was (M=3.65, SD=0.486). The lowest mean was for Service Quality Responsiveness (SQRS) (M=3.63, SD=0.620). Therefore, these responses (Table 5) indicated that although the attitudes toward Service Quality dimensions were relatively consistent, the highest perceptions were for Reliability and Assurance; in contrast, the dimensions of Tangibles, Empathy, and Responsiveness were somewhat lower. Moreover, the data suggested that respondents agreed that the SOKs offer perceived value (M=3.76, SD=0.609).
3.2.2 Customer Experience and Customer Satisfaction of McDonald’s self-service kiosks
The overall mean of the scale (Table 6) indicated that respondents agreed that the Customer Experience met their expectations (M=3.64, SD=0.599). Similar responses were obtained regarding Customer Satisfaction (M=3.75, SD=0.608); the findings suggest that respondents are overall satisfied with using SOKs.
Table 6: Customer Experience & satisfaction of McDonald’s self-service kiosks
3.2.3. Intention to Reuse
The overall scale mean (Table 7) indicated that respondents agreed they would use the SOKs again (M=3.90, SD=0.587).
Table 7: Reuse Intention of McDonald’s self-service kiosks
Hypotheses 1, 3, and 4 were all concerned with the potential influences on customer satisfaction. Multiple linear regression was performed (Table 8). The ANOVA test indicated that the model predicted the outcome variable (Customer Experience) at a suitable significance level (F=138.609, p<0.001). The R-squared value also indicated that the model was good fit (R2=0.723). 72.3% of the variance in Customer Satisfaction was predicted by variance in the predictor variables. The coefficients and t-tests were used to investigate the outcomes of individual hypotheses, with the t-test (p<0.05) to indicate whether the significant factor in the model and the coefficient used to determine the strength and direction of the influence on Customer Satisfaction (Warne, 2021).
Table 8: Hypotheses 1, 3 and 4 (Influences on Customer Satisfaction)
Five independent variables were associated with Hypothesis 1: Reliability, Assurance, Tangibles, Empathy, and Responsiveness. The t-tests were used to investigate the significance of the variable in the model. The t-test outcome for Reliability indicated that there was a significant, positive influence on Customer Satisfaction (t=2.386, p=0.018); for Assurance (t=2.705, p=0.007), Tangibles (t=2.655, p=0.008) and Responsiveness (t=5.924, p<0.001). However, Empathy was slightly negative and non- significant (t=-0.184, p=0.854). A single independent variable was associated with Hypothesis 3, which was Perceived Value (t=4.418, p<0.001). A single independent variable was also associated with Hypothesis 4, which was Customer Experience (t=4.520, p<0.001). Therefore, of the seven variables tested for influencing Customer Satisfaction, all but one had a positive and significant effect on the outcome. In order to test H4, the relationship between customer experience perception and customer satisfaction regression analysis was performed. The regression test showed that customer experience had a significant effect on customer satisfaction, the third strongest influence after the responsiveness component of service quality and perceived value.
In order to test H2, multiple regression analysis was performed (Table 9). The five service quality dimensions served as the model’s independent variables, with the perceived value used as the dependent variable. The model was significant and predicted the Perceived Value variable (F=124.482, p<0.001). The model fit test was also suitable (R 2= 0.625). 62.5% of the variance in Perceived Value was predicted by variance in the five Service Quality dimensions. The t-tests were used to determine which of the Service Quality dimensions significantly influenced the Perceived Value outcomes. The t-tests for Reliability (t=5.160, p<0.001), Assurance (t=3.256, p=0.001), Empathy (t=2.477, p=0.014), and Responsiveness (t=8.267, p<0.001) all indicated that these factors were significant within the model. However, Tangibles (t=0.102, p=0.919) were not significant in perceived value. This finding suggested that, like customer satisfaction, only some of the elements of service quality affected perceived value. Hence, H2 was partially accepted.
Table 9: Hypothesis 2 (Service Quality and Perceived Value)
The final relationship investigated was customer satisfaction and reuse intentions for self-service ordering kiosks for McDonald’s in Thailand (Table 10). The data suggested customer satisfaction’s moderate and positive effect on reuse intentions. The ANOVA test confirmed the significance of the model (F=187.151, p<0.001). The model’s goodness of fit was moderately good (R2=0.332). Customer Satisfaction predicted 33.2% of the variance in Reuse Intention. This score is not as high as in the other models presented earlier; it can be suggested that this was anticipated because single regression models often have lower predictive value than multiple regression models (Warne, 2021). These results support H5, as they showed that Customer Satisfaction has a significant and positive influence on Reuse Intention.
Table 10: Hypothesis 5 (Reuse Intention and Customer Satisfaction)
All hypotheses are summarized in Table 11 below. Table 11: Summary of hypotheses outcomes
3.4 Discussion
Four of five dimensions of the SERVQUAL model (reliability, assurance, tangibles, and responsiveness) had a positive and significant influence on customer satisfaction and coincided with other studies, i.e., Namin (2017) found that reliability and responsiveness were the most important dimensions on customer satisfaction in the fast-food context. Our findings propose that service quality influences customer satisfaction from using SOKs, providing similar suggestions with other studies, i.e., on automated customer service from ATMs and self-checkout kiosks (Narteh, 2015). Nevertheless, empathy had a negative and non-significant impact on customer satisfaction, which was unsurprising. Parasuraman et al. (1988) state that empathy relates to personal contact with service personnel and the exchange relationship with them, which could be expected as SOKs involve limited contact with customer service staff.
In reference to service quality and perceived value, the findings suggested that four of five dimensions of service quality, including reliability, assurance, empathy, and responsiveness, had a significant and positive influence on perceived value. However, the tangibles dimension did not have a significant effect. Other studies have used various models on service quality, studying different factors and attributes. For example, Vakulenko et al . (2018) used product attributes, attribute performance, and consequences; De Leon et al . (2020) used convenience, customization, and design. Regardless of the model used, all studies propose a relationship of service quality and perceived value. Similarly, our study suggests that service quality significantly affects perceived value at SOKs. The relationship between perceived value and customer satisfaction was positive and significant, confirming other studies, i.e., Namin’s (2017) study on street food service, De Leon et al .’s (2020) on mobile banking, Kim & Park’s (2019) on airline self-check-in systems. Our study suggests that SOKs in fast food restaurants like McDonald’s show similar patterns to other forms of self-service technology in services.
Vakulenko et al . (2018) suggest that previous studies on customer experience are fragmented and inconsistent. Our study agrees with other empirical studies (i.e., Marvin & Tjhin, 2020; Djelassi et al ., 2018) and confirms the relationship between customer experience and customer satisfaction. These findings are consistent with consumer behavior studies which propose that customers’ satisfaction with prior experiences influences the reuse of a product or service and that customer satisfaction has a positive influence on revisiting intentions (i.e., Slack et al ., 2021; Iqbal et al ., 2018; Vakulenko et al ., 2018). Customers are generally (though not highly) positive in their perceptions of service quality, perceived value, and the experience of SOKs; similarly, they demonstrated high levels of customer satisfaction and reuse intentions of SOKs. Four dimensions of service quality (reliability, assurance, tangibles, and responsiveness), along with perceived value and customer experience, influenced customer satisfaction and perceived value. We found that SOKs users who assessed the service quality positively assessed as well the e-service and the employee service provided positively regarding reliability, problem-solving, and personal interaction. Customer satisfaction with McDonald’s SOKs significantly and positively affected customers’ reuse intention for the kiosks. We propose that the customers’ interaction with the SOK positively affects their experience and intention to reuse it; consequently, the convenience of using SOKs results in satisfaction and loyalty to the store.
This study investigated customer satisfaction and intention to reuse self-service ordering kiosks. For the purpose of this study Bangkok, Thailand was used as a context, and McDonald’s as a case. McDonald’s was selected due to its widespread adoption of technology and SOKs, paired with the popularity of this fast-food chain in Thailand. Technological innovation and SOKs are used in the fast-food sector, where customers can place orders and pay at the kiosk rather than visiting the cashier. Such a service simplifies the ordering and payment processes while providing comfort. The findings of this study propose that consumers in Thailand use SOKs at a similar frequency as they visit restaurants. Overall acceptance of the use of SOKs was high, respondents were satisfied with the kiosks, and customer experience was as expected; hence the participants were willing to reuse the SOKs. The perceived value positively affects customer satisfaction, which is influenced by customer experience. There is a positive and significant influence of customer satisfaction on reuse intentions for self-service ordering kiosks at McDonald’s. However, this was only a moderate influence, suggesting that many other factors were involved, which should be further explored. The findings of this study propose that SOKs increase staff productivity, as they feel less stress and eliminate errors as orders are sent directly to the kitchen. We also propose that labor costs can be reduced when using SOKs, as employees may perform different tasks thanks to technology without sacrificing the customer experience.
There were some interesting findings, such as the non-significance of empathy in customer satisfaction and the non-significance of tangibles in perceived value. These differences from previous studies show that the self-service ordering system can be considered a unique service environment that needs its own focus in both academic study and management. SOKs users are willing to reuse the service and value the support and help from store employees if needed.
Theoretical contribution
This study contributes to the literature by demonstrating the relationship between service quality, customer service with customer satisfaction, and reuse intentions of SOKs. Figure 2 shows a framework for customers’ intention to reuse SOKs by expanding the literature on consumer behaviour, customer value, and expectations from using SOKs.
Figure 2: Proposed framework
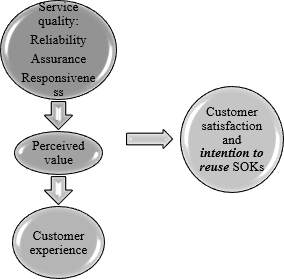
Source: Authors
This study extends the limited literature on use of SOKs (i.e., Ackam, 2020; Kim & Park, 2019). In the past ten years, there have been only some studies on customer experience and perceptions of self-service technologies such as ATMs (i.e., Narteh, 2015), online banking systems (i.e., De Leon et al., 2020), and airline self-check-in machines (Kim & Park, 2019). Other studies have focused on why consumers choose SOKs (Samengon, 2022), whereas studies have not focused on repeat use and intention to reuse, which is another contribution to the literature. Therefore, this paper contributes to the literature on customer satisfaction and intention to reuse SOKs in the fast-food restaurant sector, demonstrating the positive attitude towards technology used in these settings. The framework suggests that users of SOKs focus on their reliability and responsiveness and place less or no emphasis on personal contact, or whether the system is up-to-date as long as it works properly and is easy to use. This framework may also contribute to queue management theories with the support of technology.
4.3 Practical implications
From a practical implications perspective, it can be suggested that investments in technology are costly but critical for the success of food businesses (Ackam, 2020). McDonald’s values the role of technology in their growth as they believe it elevates the customer experience and hence brings more customers into the restaurants (McDonald’s, 2019). This study proposes that SOKs offer convenience and can increase sales, especially during peak times. Unlike humans, they even provide better opportunities for upselling (Ackam, 2020). Such service reduces customers’ stress, allows customers to pay with their phones, and provides higher service personalization as staff mainly deal with customer service. Fast-food managers can see the use of SOKs as a labor cost reduction opportunity for restaurants, especially in countries where the minimum wage has increased, making the cost of labor high and rolled on to the price; the consequence of the high labor cost is to replace people with technology (Taylor, 2019). Interestingly, McDonald’s has not adopted this strategy as they only changed the responsibilities of cashiers with more emphasis on customer service (Ackam, 2020). This example can be used as best practice for other similar businesses to follow. Fast-food managers may use SOKs as a valuable tool for international travelers who may not be familiar with the language; SOKs offer a choice of languages and a user-friendly menu. SOKs can also be seen as a source of information for managers to measure customer value for market research and decision-making. Such measurement will help fast-food restaurant managers to enhance service delivery and optimize customer satisfaction. Such systems help organizations gain customer trust and loyalty and attract new customers.
Managers may advise IT teams to improve the SOKs’ performance effectiveness to ensure the system is designed to provide speedy service and ease of use so that the customers may feel satisfied and will return. They should also invest in training employees to increase their competencies and enhance their skills in using such technologies. In the post-pandemic world, the food sector faces staggering employee shortages and high turnover, making employing and retaining staff complicated and challenging (Giousmpasoglou et al ., 2021). In view of these challenges, fast-food restaurants should adequately recruit, train and provide development opportunities for their employees, focusing on IT, to ensure effective customer service.
The restaurant sector is changing rapidly and has embraced self-service technologies. Multinational enterprises like McDonald’s and smaller chains are changing the ordering model to incorporate more SOKs (Leung et al ., 2021). Hence, operators should invest in service design to ensure customer satisfaction. They should use service staff to support customers when they use such kiosks to ease the use and reduce potential stress, but at the same time, they should endeavor to increase service quality delivered through SOKs to increase loyalty and reuse.
4.2 Limitations and future research
It can be argued that the literature on customer experience from e-services and its role in customer satisfaction is still underdeveloped and fragmented (Arsalan & Latif, 2021; Ackam, 2020). Nevertheless, the existing literature suggests a relationship between the two factors. Due to the fragmentation of the customer e-service experience construct, this area needs additional theorization and conceptual development. This study was focused on a single country (Thailand); hence, further studies should be conducted in different cultural contexts to provide generalizations on SOKs’ customer satisfaction. The authors suggest that further empirical studies should investigate differences in using SOKs, based on demographic characteristics (i.e., age, gender, income, IT literacy), customer satisfaction, and intention to reuse. We also propose that future studies may compare the intention to reuse SOKs between experienced and inexperienced users. Finally, the authors acknowledge the limitation of using the SERVQUAL model instead of the eSERVQUAL; therefore, other studies could explore the intention to reuse SOKs based on the e-service quality.