
Introduction
Mare milk has a unique nutrient profile and contains about 40 biological components such as amino acids, fatty acids, enzymes, trace elements, and vitamins in an optimal balance for utilization in the human body (Fotschki et al., 2016). Accordingly, mare milk is characterised by various therapeutic properties and has been suggested for the treatment of skin, respiratory, and gastrointestinal diseases, as well as for liver detoxification and regeneration (Jastrzębska et al., 2017; Czyżak-Runowska et al., 2018). Consumption of mare milk has also been associated with beneficial effects on the human immune and nervous systems, cardiovascular disease, and diabetes, as well as hypoallergenic properties that favour consumption of mare milk in people with milk protein intolerance or in infants as a substitute for breast milk (Brezovečki et al., 2014; Jastrzębska et al., 2017). Some studies have highlighted other benefits of mare milk, such as the presence of specific health-promoting compounds with potential antibacterial, antiviral, and anti-inflammatory effects, such as lactoferrin (Lf) and lysozyme, which are present in significant amounts compared to cow milk (Pieszka et al., 2016; Jastrzębska et al., 2017; Miraglia et al., 2020). Accordingly, the popularity of mare milk among European consumers started to increase, although there is no tradition of mare milk production in Europe. Many of the above-mentioned bioactive components of mare milk tend to lose some or all of their biological activity during heat treatments, which is the reason for the widely accepted practice of using mare milk raw, frozen or freeze-dried (Claeys et al., 2014; Pieszka et al., 2016). Another common aspect arguing against thermal treatments of mare milk are undesirable changes in sensory properties, a low microbial load (below 104 CFU/mL) and a low somatic cell count in mare milk, as well as a rare occurrence of pathogens such as Salmonella spp., Staphylococcus sp. or Escherichia coli (Salimei and Fantuz, 2012; Brezovečki et al., 2014; Claeys, 2014). Nevertheless, hygienic quality depends on raw milk management and can be immediately compromised if proper procedures are not followed during milking and collection, so mare milk can still be a source of pathogenic microorganisms (Verraes et al., 2014). Refrigeration and freezing only slow microbial growth but do not ensure inactivation of all vegetative microorganisms, including any pathogens that may be present, which is why several authors suggest mandatory pasteurization of mare milk before consumption (Hazeleger and Beumer, 2016; Czyzak-Runowska et al., 2018). However, heating processing directly causes various chemical and physical changes in milk including non-enzymatic browning also known as Maillard reactions (Van Boekel, 1998; Morales, 2008), which occurs between the free aldehyde group of the glucose unit in the lactose molecule and the amine group of lysine residues, generating 𝜀-lactulose-lysine (Amadori product) as the first stable product (Van Boekel, 1998). 5-Hydroxymethylfurfural (HMF) is one of the major intermediate products in the Maillard reactions resulting from acid breakdown of the Amadori product, but can also arise from lactose degradation and isomerisation at high temperatures (Morales and Jiménez-Pérez, 1997; Morales, 2008). Along with some other compounds such as lactulose or furosine, generated during heat treatments of milk, HMF is widely used as an indicator for assessing quality/heat-damage in dairy products (Van Boekel, 1998, Morales, 2008). To our knowledge, there are few studies that address heat-induced changes in equine milk, primarily focusing on protein degradation or loss of biological active compounds, while HMF determination has not been examined yet. Therefore, the objective of this study was to investigate how commonly heat treatments used affect the quality of mare milk and to compare those with changes detected in cow milk. Therefore, we examined the effects of different heat treatments on changes in colour, conductivity, and total dissolved solids, as well as on antioxidant properties and 5-hydroxymethylfurfural (HMF) formation in mare's milk. Heat-induced denaturation of mare's milk proteins was monitored by Sodium Dodecyl Sulfate-PolyAcrylamide Gel Electrophoresis (SDS-PAGE), while near-infrared spectroscopy (NIRs) was used to monitor structural changes in heat treated milk samples. Principal component analysis (PCA) was used to determine similarities between the samples studied with respect to the thermal conditions applied, and the resulting qualitative changes.
Materials and methods
Thermal treatments
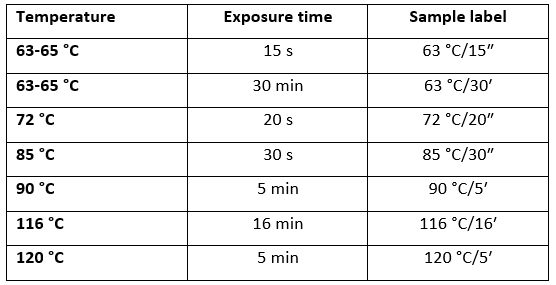
Volumes of 200 mL of fresh raw mare (Family farming Rebić, Veliko Trojstvo, Croatia) and raw cow (purchased at vending machine) milk were treated by different thermal regimes as described in Table 1. Subsequently, heat-treated samples were instantly cooled in an ice bath and subjected to analyses.
Table 1. Thermal regimes applied for batch pasteurization of mare and cow milk (according to Kontominas, 2019)
Determination of physico-chemical parameters
Active acidity of milk samples was determined by a pH meter (WTW-ProfiLine pH 3110, Xylem Analytics, Germany) and titratable acidity (TA) by a Soxhlet Henkel method according to AOAC 947.05 (AOAC, 1990a).
Milk density was determined by a lactometer calibrated at 20 °C, while electrical conductivity (EC) and the total dissolved solids (TDS) were measured by a conductivity meter (SevenCompact, Mettler Toledo, Switzerland).
Fat content was determined using the Gerber method according to ISO 19662:2018. The total protein content was determined according to modified Kjeldahl method (AOAC 991.20, 1990b; Persson et al., 2008) using Kjeltec Tecator Digestion and Destillinig unit (Digestion sistem6 1007 Digester, Destilling Unit 2100; Foss, Hilleroed, Denmark). The lactose content was determined using the Luff-Schoorl method as Marrubini et al. (2017) described.
Total solids were determined by drying at 102±2 °C according to the reference method ISO 6731:2010. Total solids non-fat (TSNF) content was calculated. Freezing point of milk was determined by a cryoscopy method according to ISO 5764:2009.
Colour determination
The colour of milk samples was determined according to the CIElab system, using a CM-3500d spectrophotometer (Konica Minolta, Tokyo, Japan) with a D65 light source and equipped with the SpectraMagic NX program for data processing. In order to determine whether the total colour difference (∆E *) was calculated according to Equation as follows:
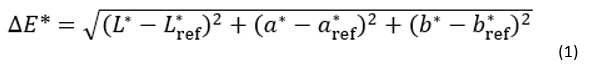
where L *, a *, and b * refer to the test (heat treated milk) samples, and L *ref, a *ref, and b *ref to the control sample (raw, untreated milk).
5-Hydroxymethylfurfural (HMF) determination
For both, the total and the free HMF content, the spectrophotometric method of Keeney and Bassete (1959) was applied following modifications described by Morales et al. (1996) and Francisquini et al. (2018), respectively.
For the total HMF content determination, 10 mL of milk was mixed with 0.3 M oxalic acid (Gram-Mol, Croatia) and heated on a magnetic stirrer (RT 5 power IKAMAG, USA) at 100 °C for 1 hour. After rapid cooling in ice bath, the treated milk samples were deproteinized by adding 5 mL of 40 % (w/v) trichloroacetic acid (TCA) (Fisher Scientific, UK) and filtered through Whatman filter paper no. 42 (Morales et al., 1996). The content of free HMF in milk samples was determined following the same procedure, excluding the heating step, as Francisquini et al. (2018) previously described.
4 mL of the obtained filtrate were incubated with 1 mL of 0.05 M 2-thiobarbituric acid (TBA) (Alfa Aesar, UK) at 40 °C for 30 min and the absorbance of the TBA incubated supernatants was read at 433 nm relative to distilled water (blank). The calibration curve obtained with pure HMF standard (5-Hydroxymethyl-2-furancarboxaldehyde, Sigma-Aldrich, Germany) from 5 to 100 µM in distilled deionized water.
Parameters of antioxidant properties
Sample preparation
For the determination of antioxidant capacity (AC) and the total phenols content (TPC), milk samples were prepared following the protocol of Alyaqoubi et al. (2014). 1g of milk was mixed with 10 mL of 1 M HCl (Gram-mol, Croatia) previously prepared in 95 % ethanol (v/v (15/85), Kefo, Croatia). The obtained mixture was incubated for 1 hour at 30 °C h under continuous stirring in a water bath at 300 rpm. Subsequently, the sample was then centrifuged at 7800 × g at 5 °C for 15 min, and the obtained supernatant was stored at -20 °C until further analysis.
Ferric reducing antioxidant power (FRAP)
Ferric Reducing Antioxidant Power (FRAP) method was performed according to the procedure described by Benzie and Strain (1999) for preparation of all chemicals and reagents and following the protocol described by Sangsopha et al. (2019) for absorbance reading. Briefly, 3.4 mL FRAP reagent was incubated for 30 min at 37 °C and subsequently added to 0.6 mL of the supernatant following by incubation at 37 °C for 60 min, after which the absorbance at 593 nm (A593) was read. The blank probe followed the same protocol, but contained the extraction solvent (1 M HCl in 95 % ethanol (v/v, 15/85)) instead of the supernatant (sample).
The standard curve was plotted using a 2 mM Trolox (Sigma-Aldrich, St. Louis, MO, USA) stock solution. Trolox concentrations used for the standard curve establishment were 25, 50, 75, 100, 125, 250, 500, 750, 1000 and 1500 μM. FRAP results were expressed as μmol TE/L.
2,2-Diphenyl-1-picrylhydrazyl (DPPH) radical scavenging activity
The DPPH assay was performed following the method of Brand-Williams et al. (1995) with minor modifications. 6.0x10⁻⁵ mol/L DPPH (2,2-Diphenyl-1-picrylhydrazyl, Sigma-Aldrich, Germany) in 95 % ethanol (Kefo, Croatia) was prepared freshly prior to each set of measurements. 100 μL of supernatant and 3.9 mL of the freshly prepared 6.0x10⁻⁵ mol/L DPPH were mixed and left for 30 minutes in a dark place followed by absorbance reading at 517 nm (A517) according to Alyaqoubi et al (2014). DPPH results were expressed as % radical scavenging activity.
Total phenol content determination
The total phenols content (TPC) was determined according to Singleton et al. (1999) with some modifications. 400 μL of the obtained supernatant, 1.6 mL of the Folin-Ciocalteu reagent (Sigma-Aldrich, Germany) prepared with water in ratio (1:10, v/v) and 2 mL of sodium carbonate (Gram-Mol, Croatia) (7.5 % w/v) were added and left at room temperature in a dark place for 2 hours. The absorbance was read at 765 nm (A765). The standard curve was plotted using 500 mg/L gallic acid (Sigma-Aldrich, St. Louis, MO, USA) as a stock solution. The results were expressed as mg of gallic acid equivalent per litre (mg GAE/L).
SDS-PAGE
The method previously described by Leboš Pavunc et al. (2012) with slight modification was used for SDS PAGE analysis. 15 µL of each milk sample were resuspended in 2 x concentrated Laemmli buffer {1.25 mL of 1 M Tris-HCl (pH=6.8) (Carlo Erba, Italy), 4 mL of SDS [10 % (w/v)] (Sigma-Aldrich, USA), 2 mL glycerol [100 % (v/v)] (Alkaloid, Macedonia), 0.5 mL 0.5 M EDTA (Sigma-Aldrich, USA), 4 mg bromophenol blue (Sigma-Aldrich, USA), 0.2 mL β-mercaptoethanol (Sigma-Aldrich, USA)}. Electrophoretic separation was performed in an electrophoresis chamber at a constant voltage of 150 V using ProSieve QuadColor Protein Marker as standard.
NIRs
NIR spectra of milk samples were measured using the NIR spectrophotometer (NIR-128-1.7-USB/6.25/50 µm, Control Development Inc., USA) with installed Control Development software Spec32, using a halogen light source (HL-2000) for the wavelength range of λ = 904-1699 nm. Each absorbance spectrum was recorded in triplicate and the mean value was calculated. Before analysis, all samples were diluted with distilled water (1:10) and approximately 2 mL of sample was transferred to a 10 mm quartz cuvette placed in a holder to avoid any light interference during the measurement.
Statistical analysis
PCA was used to investigate the similarities and differences of milk samples based on the thermal treatments performed at different temperatures. Additionally, PCA was performed to investigate the influence of thermal treatments (Table 1) and milk type (mare, cow) on colour, HMF free, HMF total, DPPH, FRAP, Phenols, TDS and conductivity. The means of the results of physical (colour, TDS, conductivity) and chemical properties (HMF free, HMF total, DPPH, FRAP, Phenols) measured in mare/cow milk samples, treated at different temperature regimes were evaluated using analysis of variance (ANOVA) while Tukey’s test was used to compare significant differences (p < 0.05) between the samples. Differences between different milk types at the same experimental conditions were analysed, as well as the differences between different experimental conditions (temperature regime) for the selected milk types. The PCA and ANOVA was performed using Statistica 14.0. (TIBCO® Statistica, Palo Alto, CA, USA).
Results and discussion
Physical and chemical properties of raw mare and cow milk
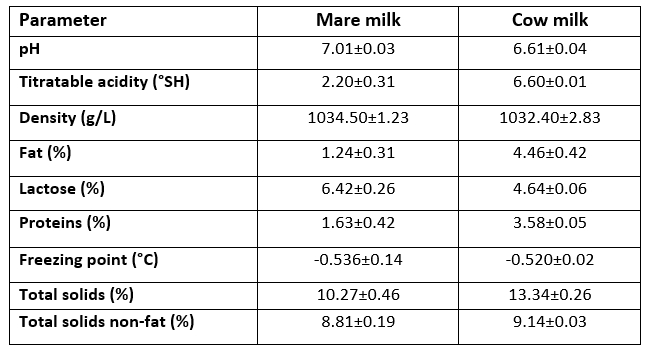
Before applying different heat treatments, physical and chemical parameters of raw mare and cow milk were determined. In comparison to cow milk (Table 2), mare milk had somewhat higher average pH value (7.01) and density (1034.50 g/L), but lower TA (2.20 °SH), total protein content (1.63 %), fat content (1.24 %) and total solids (10.27 %). In line with data published by Claeys et al. (2014), the average lactose content (6.42 %) of mare milk was significantly higher than that of cow milk (4.64 %), which is most probably the reason for lower average freezing point (-0.536 °C) of mare milk in comparison to cow milk. Additionally, the high lactose content contributes to the relatively high total solids non-fat content (8.81 % on average) of mare milk, although the total solids content (10.27 %) was considerably lower when compared to cow milk (13.34 %). Čagalj et al. (2014) and Končurat et al. (2018) observed similar results regarding the composition and physical properties of the Croatian coldblooded mare’s milk. The only exception is somewhat lower TA value (2.20 °SH on average) in comparison to results previously published by Končurat et al. (2018) (2.57-2.69 °SH) and Čagalj et al. (2014) (2.51 °SH), respectively. Such differences might be related to different stages of lactation at which the milk sample was taken for analysis, as well as to the low protein content knowing that it can significantly affect TA values (Schmidt et al., 1996). Since all of the obtained results (Table 2) correspond to the available literature data, it was evident that both types of raw milk (mare and cow) were fresh and of inherent composition.
Table 2. Average physical and chemical parameters of raw mare and raw cow milk (n=5)
Changes in colour, TDS and EC of heat-treated mare and cow milk samples
Colour is one of the most important attributes of dairy products. However, conventionally applied heat treatments can cause colour changes due to non-enzymatic browning occurring because of Maillard reactions (Morales, 2008). Values obtained for each heat-treated sample were compared with the raw milk by calculating the total colour difference (ΔE*) presented in Figure 1. Considering the obtained results, it is evident that the difference in the colour of heat-treated milk samples increased by applying higher temperature and/or longer exposure time. In addition, regardless of exposure time, similar colour changes occurred in both milk types at lower temperatures. The average ΔE* values ranged between 2.23 (cow milk, 72 °C/20″) and 3.69 (mare milk, 63 °C/30ʹ) indicating colour changes that can be perceived by unexperienced observers (Mokrzycki and Tatol, 2011). Statistical analysis revealed that samples treated at HTST regimes (72 °C/20″, 85 °C/30″, 90 °C/5ʹ) and thermisation (63 °C/15″) were not significantly different (p>0.05) with respect to the milk type, but there was a significant difference (p<0.05) among the considering the applied heat treatment (Figure 1). When comparing the aforementioned heat treatments within the same milk type, no significant differences were observed. The LTLT pasteurization at 63 °C/30ʹ resulted in the most intense changes among all applied pasteurisation regimes, indicating the effect of exposure time. Accordingly, this sample was significantly different (p<0.05) from other pasteurized and the thermalized sample, within the same milk type.
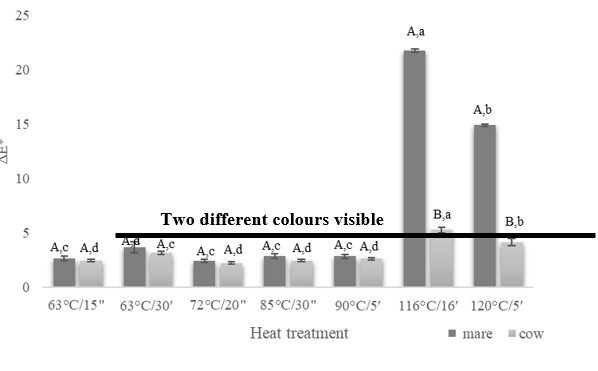
A,BThe same capital letters denote no significant differences (p>0.05) between the values obtained for the different milk types at the same experimental conditions according to Tukey’s ANOVA.
a–dThe same lowercase letters denote no significant differences (p>0.05) between values obtained for milks prepared at different experimental conditions according to Tukey’s ANOVA.
Figure 1. Colour changes (ΔE*) of mare and cow milk heat treated at different time - temperature regimes (63 °C/15″, 63 °C/30ʹ, 72 °C/20″, 85 °C/30″, 90 °C/5ʹ, 116 °C/16ʹ, 120 °C/5ʹ)
ΔE* values exceeding 5.0 and indicating the distinction of two entirely different colours to the raw milk sample were observed in mare milk samples (Figure 2) treated at batch, in bottle sterilization regimes (116 °C/16ʹ and 120 °C/5ʹ). Thereby the treatment at 116 °C/16ʹ resulted in the highest ΔE* values (21.72) of all (Figure 1), supporting previous assumptions that the longer exposure times and the high lactose content in mare milk contribute to more intense processes leading to brown colouring in milk which could be observed in our samples. Statistical analysis also revealed significant differences (p<0.05) for sterilized milk samples which were different from pasteurized samples within the same milk type. There was also a significant difference (p<0.05) among sterilized samples of the different milk types and with respect to the applied temperature/time in bottle sterilization (Figure 1), whereby mare milk samples showed significantly higher values. Thus, sterilization in bottle is from the aspect of colour changes not appropriate for mare milk processing. On contrary, ΔE* values of batch, in bottle sterilized cow milk were close to 5.0 (Figure 1), but not exceeding it, which is most probably related to considerably lower lactose content in the dry matter.
Conductivity measurements are widely used in the dairy industry, for example, as a quality control of milk to detect mastitis, for analysing fermentation processes or to monitor the start-up and pre-rinsing phases of the milk pasteurization process (Henningsson et al., 2005). Salts, including serum ions, mainly condition EC value of milk. Among other major milk components, proteins affect the conductivity by carrying a pH dependant charge and by influencing viscosity. By increasing temperature, viscosity decreases, the degree of dissociation of the salts and hydrodynamic radius change, all of which affects the increase in electrical conductivity. Other effects of increased temperature on milk include the association of dissolved calcium and phosphate with casein micelles and the formation of solid calcium phosphate Ca3(PO4)2 which also positively affects conductivity. EC in normal milk of healthy cows usually ranges between 4.0 and 5.5 mS at 25 °C, and increases with milk sample temperature (Norberg et al., 2004). The average value obtained in this study for EC of raw cow milk was 5160.75 µS/cm at 20 °C, and increased slightly with the intensity of the applied temperature/time regime reaching highest value for sterilized milk, which corresponded well to previously described correlations and data published by Norberg et al. (2004) and Nielen et al. (1992). Raw mare milk showed significantly lower values ranging about 1.51 mS/cm, which was expected due to the considerably lower total solids and solids non-fat dry matter (Table 3) and thus almost a twofold lower mineral content as Claeys et al. (2014) already highlighted. Fernando et al. (1985) found that EC value of milk is proportional to Cl- concentration, which is according to Claeys et al. (2014) almost 10 times lower in mare (19 mg/100 mL) than in cow (110-119 mg/100 mL) milk. Our results on EC of raw mare milk correspond to Cais-Sokolińska et al. (2017), who previously published similar findings on EC of mare milk while investigating its change during fermentation. According to the Tukeys ANOVA, EC values of all heat-treated milk samples were significantly different (p<0.05) considering the applied temperature/time regime within the same milk type. Also, significant differences (p<0.05) were observed when comparing EC values of the same heat treatments among different milk types (Table 3). Opposite to cow milk, EC values of heat-treated mare milk showed an increasing trend. Such results indicate that raw milk responds differently to heat induced changes in EC than cow milk, most probably due to different mineral content and mineral profile, as well as to different casein/whey protein ration and protein charge.
Table 3. Total dissolved solids (TDS, mg/L) and electrical conductivity (EC, µS/cm) of raw and heat-treated mare and cow milk samples
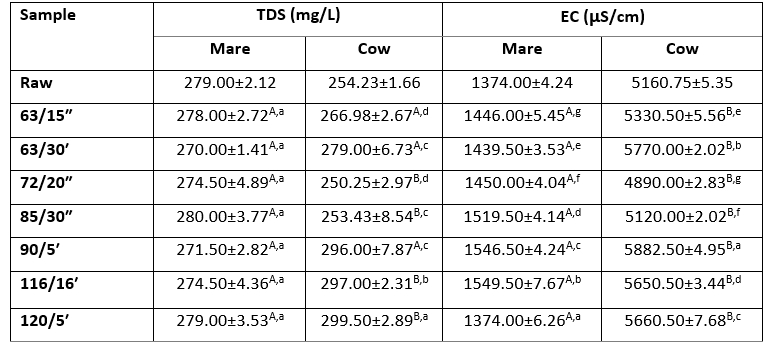
A,BThe same superscript capital letters denote no significant differences (p>0.05) between the values obtained for the different milk types at the same experimental conditions according to Tukey’s ANOVA.
a–gThe same superscript lowercase letters denote no significant differences (p>0.05) between values obtained for milks prepared at different experimental conditions according to Tukey’s ANOVA.
TDS values in mare milk samples were not statistically different (p>0.05) among each other, while all cow milk samples were significantly different (p<0.05) according to the applied heat treatment (Table 3). When looking at the same heat treatment but different milk types, statistically significant differences (p<0.05) were obtained for HTST samples 72/20ʺ and 85/30ʺ, and for the in bottle sterilised samples. Such results are corresponding to previous findings of Atekwanaa et al. (2004) who concluded that TDS was positively correlated to EC, with the conversion factor from TDS into EC (as µS/cm) between 0.55 and 0.8, which can be applied to our results.
HMF content in heat-treated mare and cow milk
5-HMF in milk is usually expressed by the free and the total 5-HMF content. The free HMF content represents its actual concentration mainly formed in Maillard reactions during heat treatment, while the total HMF content refers to the sum of the free HMF and the potential/bound 5-HMF (HMF precursors). Thus, the total HMF determination requires a preliminary step in sample preparation including acid digestion, usually with 0.3 N oxalic acid, at about 100 °C to convert the Amadori products into HMF (Ritota et al., 2017). Knowing that, some authors have only examined the free HMF content in heat-treated milk, while in this study both values were determined and are presented in Figure 3. The HMF content in cow milk samples ranged from approximately 2.33 to 30.22 μmol/L for free HMF and from 4.7 to 61.04 μmol/L for the total HMF content. On the other hand, for mare milk samples free HMF ranged from 2.36 to 30.22 μmol/L and total HMF from 5.3 to 70.26 μmol/L. As could be expected, the total HMF content (Figure 3b) was significantly higher compared to the free HMF (Figure 2a) content, which is probably related to the above-mentioned digestion step during sample preparation prior to analysis. Hou et al. (2022) recently highlighted that the European Food Safety Authority (EFSA) reported a maximum detectable amount of 15 mg/kg HMF in milk and dairy products. Neither of the samples in this study contained values near that amount. According to EFSA (2010), 5-HMF could naturally occur in milk in amounts up to 0.03 mg/kg. So, the detection of the total (cow: 2.70 μmol/L, mare: 2.54 μmol/L) and the free HMF (cow: 1.43 μmol/L, mare: 1.36 μmol/L) in raw milk samples was not unusual. Czerwonka et al. (2020) extensively analysed the HMF content in market milk, which included samples raw, liquid and powdered milk as well as infant formulas. The determined 5-HMF varied widely (3.3–136.8 μmol/L) with the average value of 54.8 μmol/L. Similar values were obtained in our study in both milk types, but in contrast to Czerwonka et al. (2020), we observed a clear distinction between sterilised and pasteurized milk samples. Indeed, it could be noticed that higher processing temperatures and exposure times resulted in higher content of free HMF in both milk types (Figure 2a). These results corresponded to findings previously published by Özdal et al. (2018) and Morales et al. (2000) who detected that HMF levels increased with increasing the thermal processing intensity. In line with that, sterilised milk samples (116 °C/16ʹ and 120 °C/5ʹ) contained higher amounts of both, free and total HMF (Figure 2) compared to pasteurised samples.
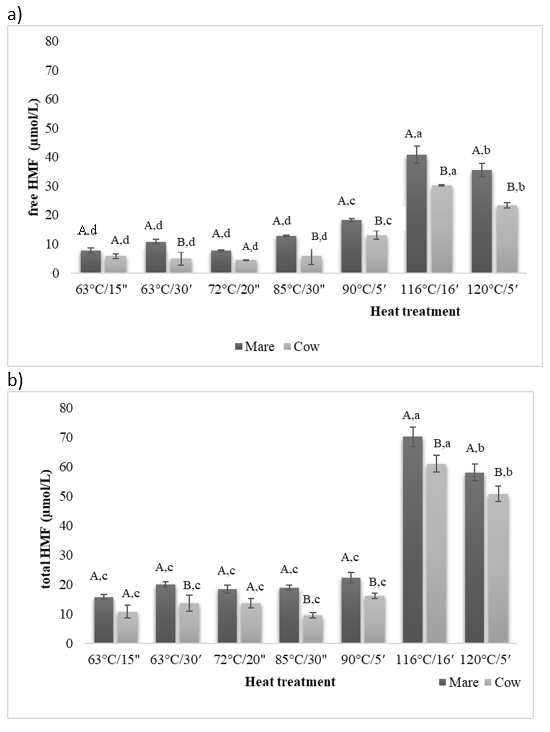
A,BThe same superscript capital letters denote no significant differences (p>0.05) between the values obtained for the different milk types at the same experimental conditions according to Tukey’s ANOVA.
a–cThe same superscript lowercase letters denote no significant differences (p>0.05) between values obtained for milks prepared at different experimental conditions according to Tukey’s ANOVA.
Figure 2. Free (a) and total (b) HMF content (µmol/L) in heat-treated (63 °C/15″, 63 °C/30ʹ, 72 °C/20″, 85 °C/30″, 90 °C/5ʹ, 116 °C/16ʹ, 120 °C/5ʹ) mare and cow milk
Comparing milk samples sterilized at different time/temperature regimes, Calligaris et al. (2004) found that higher concentration of free and total HMF was measured in milk samples that had been treated longer, which indicates that, in addition to the temperature itself, the duration of heat treatment also has a significant effect on the formation of HMF. Similarly, in our study significantly (p<0.05) higher values of free and total HMF content were obtained for samples treated longer but at lower temperature (sample 63 °C/30ʹ) and sterilisation (sample 116 °C/16ʹ) regimes, for both milk types. Statistical analysis also revealed that sterilised, LTLT (63 °C/30ʹ) and two HTST samples (85 °C/30ʹʹ, 90 °C/5ʹ) were significantly different (p<0.05) with respect to the milk type (Figure 2), whereby values determined for mare milk were higher. The low fat content along with high lactose content of mare milk (Table 1) might have led to a more intense HMF formation in mare milk in comparison to cow milk, which was previously confirmed by Morales and Jiménez-Pérez (2008). Higher lysine content of mare milk (Mazhitova and Kulmyrzaev, 2016; Teichert et al, 2021) is another factor which could have affected such results, since lysine is also one of main reactants in Maillard reactions
Antioxidant properties
The antioxidant activity of milk depends on various factors such as the animal species, lactation stage and the presence of various bioactive components such as proteins, bioactive peptides, sulphur containing amino acids, minerals (Zn, Se), vitamins (E and C), retinol and β-carotene, catalase, superoxide dismutase and glutathione peroxidase (Khan et al., 2019; Stobiecka et al, 2023). Since the chemical composition of different types of milk varies, the antioxidant activity is expected to vary as well. Stobiecka et al. (2023) recently concluded that the content of vitamins A, E and β-lactoglobulin (β-Lg) largely determines the antioxidant potential of cow milk, while Zulueta et al. (2009) previously found caseins to be mainly responsible for the total antioxidant capacity of cow milk. In contrast to that, antioxidant activity of mare milk has primarily been related to the high contents of Lf, lysozyme and vitamin C, as well as to the non-protein nitrogen (NPN) and bioactive peptides (Abd El-Salam and El-Shibiny, 2013; Narmuratova et al., 2022, Pieszka et al., 2016). Although there are numerous assays that can be applied to determine antioxidant activity of milk and dairy products, DPPH, FRAP and ABTS are among the most commonly used methods (Stobiecka et al., 2022). The DPPH method measures to which degree a product can reduce the free DPPH radical, while the FRAP method measures the ability of the sample to reduce the ferric ion (Smet et al., 2008). The DPPH radical scavenging activity of mare milk was significantly lower compared to cow milk, but the obtained values were much more consistent and showed no significant (p>0.05) changes with respect to the applied heat treatment (Table 4). Opposite to that, there was a certain drop in DPPH scavenging activity in cow milk samples, but significant differences (p<0.05) were only observed for sterilization regimes. Some authors previously found that antioxidant activity of milk measured by the DPPH method is mainly related to whey proteins, especially Lf and β-Lg, as well as to the content of sulphur-containing amino acids with free sulfhydryl groups serving as hydrogen donors for the DPPH radical (Smet et al., 2008; Stobiecka et al., 2022). Zulueta et al. (2009) found that caseins are mainly contributing to the total antioxidant activity of milk measured by radical scavenging activity against peroxyl radicals induced by 2,2´-azobis(2-amidinopropane) dihydrochloride (AAPH) by the ORAC method. Knowing that β-Lg in mare milk does not contain free sulphhydryl groups, and that mare milk contains lower amounts of cysteine in the NPN (Abd El-Salam and E-Shibiny, 2013) and much lower concentrations of casein fractions than cow milk (Potočnik et al., 2011; Claeys et al., 2014), the results presented in Table 4 are sound. At temperatures above 90 °C β-Lg tends to form complexes with κ-casein via free sulfhydryl groups (Čurlej et al., 2022), which might also be reflected in a greater loss of radical scavenging activity determined in cow milk (Table 4). On the other hand, mare milk is characterized by a considerably higher NPN content (10-15 %) compared to cow milk, with urea being its most dominant component (Guha et al., 2021), while Cloetens et al. (2013) previously found that urate is the major antioxidant in the low molecular weight fraction of NPN. This might explain the more stable DPPH scavenging activity of mare milk (Table 4) with respect to the applied heat treatments.
Table 4. Antioxidant activity (DPPH, FRAP) and total phenol content (TPC) of heat-treated mare and cow milk expressed as the reducing power of DPPH radical (%), the Trolox equivalent (μmol TEQ/L) and gallic acid equivalent (mg GAE/L)
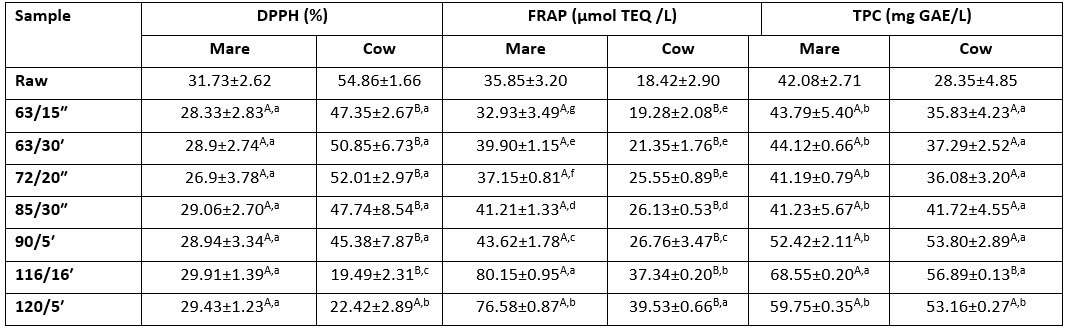
A,BThe same superscript capital letters denote no significant differences (p>0.05) between the values obtained for the different milk types at the same experimental conditions according to Tukey’s ANOVA.
a–gThe same superscript lowercase letters denote no significant differences (p>0.05) between values obtained for milks prepared at different experimental conditions according to Tukey’s ANOVA.
The FRAP values of heat-treated mare and cow milk were significantly different with respect to the milk type and the applied heat treatment (Table 4) ranging from approximately 35.85 to 80.15 μmol TE/L in mare milk and from 18.42 to 39.53 μmol TE/L in cow milk, respectively. Compared to raw cow milk (18.42±2.90 μmol TE/L), the obtained FRAP values are considerably higher in raw mare milk (35.85±3.20 μmol TE/L). Such results are probably related to the higher content of urate in NPN as well as to the higher content of Lf and lysozyme in mare milk (Salimei and Fantuz, 2012; Abd El-Salam and E-Shibiny, 2013; Claeys et al, 2014). More precisely, some authors previously reported that the most of the ferric-reducing activity of milk proteins was found in the low molecular weight fraction of whey, which is most likely associated to urate (Chen et al., 2003; Ostdal et al., 2000), Lf and lysozime (Smet et al., 2008). When comparing different heat treatments within the same milk type, FRAP values increased with the intensity of the applied heat treatment whereas the sterilised milk samples demonstrated the highest values. Statistical analysis showed that all heat-treated mare milk samples were significantly different (p<0.05) from each other. In contrast to that, cow milk samples treated at temperatures below 85 °C were not different (p>0.05), while samples treated at and above 90 °C were significantly different (p<0.05) to each other as well as to the lower temperature regimes (63 °C /15″, 63 °C /30ʹ, 72 °C /20″, 85 °C /30″). Bressa et al. (1996) reported that antioxidant activity increases during milk heating most probably due to the formation of Maillard reaction products such as melaonidins, with well-known antioxidant properties. Shukla and Bajwa (2013) studied effects of heat treatments similar to those applied in our study on antioxidant activity in sucrose-milk protein model systems and found that heat treatments might increase the antioxidant activity of milk due to protein unfolding and exposure to various reactions. Oh et al. (2014) found that Maillard reaction products (MRP) resulting from unfolded milk proteins had higher antioxidant activities than intact proteins. As we previously discussed, in comparison to cow milk, mare milk showed a more intense 5-HMF formation during all applied heat-treatments (Figure 2), indicating more intense Maillard reactions. Accordingly, more MRP with antioxidant properties obviously arise during heat-treatment of mare milk contributing to a more intense increase in the FRAP antioxidant activity (Table 4). Manzi and Durazzo (2017) studied antioxidant properties of industrially heat-treated milk by using different assays, and observed the highest values for FRAP in UHT milk probably due to the development of antioxidant compounds that occur during this severe heat-treatment. Similarly, Calligaris et al. (2004) also found that heat treatments caused an increase in the antioxidant properties of the milk samples studied. They concluded that the changes in the reducing properties of milk when heated were due not only to the thermal degradation of naturally occurring antioxidants but also to the formation of new oxidative species in the early stages of the Maillard reaction. Abarshi et al. (2021) investigated antioxidant properties of raw, pasteurized and fermented horse milk by applying FRAP assay. They also found that pasteurisation caused higher antioxidant activity compared with raw mare milk. Accordingly, the observed trends in increasing antioxidative activity of heat-treated mare and cow milk (Table 4) measured by the FRAP assay correspond to the findings of the aforementioned studies.
Total phenols content
The content of total phenols ranged from approximately 42.08 to 68.55 mg GAE/L in mare milk and from 28.35 to 46.89 mg GAE/L in cow milk (Table 4). Velázquez Vázquez et al. (2015) conducted an extensive study in order to develop and validate a technique for extracting total phenolic compounds (TPCs) from a milk matrix and analysing them using the Folin–Ciocalteu method. They obtained an average TPC value of 49.00±10.77 mg GAE/L for cow milk, which was somewhat higher in comparison to our results, but concluded that there was a high variability among species and among members of the same species. Up to now, there are no published data for comparison of the total phenols content of raw mare milk. However, the obtained almost two-fold higher TPC values (42.08 mg GAE/L) in comparison to raw cow milk (28.35 mg GAE/L) are most probably related to different feeding system of mares. Besides, mare milk contains much higher content of Lf, lysozyme, unsaturated fatty acids and vitamin C, which have been found along with some other milk components (vitamins B1, B6, C and folic acid; amino acids, proteins, organic acids) to enter reactions with the Folin Ciocalteau reagent (Everette et al., 2010). Therefore some authors suggested that Folin Ciocalteu method could also be used for determination of antioxidant activity. Zor et al. (2022) most recently reported that phenolic compounds were directly related to antioxidant activity in both, correlation analysis and PCA. The positive correlation between the FRAP method and the assay with the Folin-Ciocalteu reagent, was also confirmed by Alyaquobi et al. (2014) who determined the antioxidant activity and total phenols of goat milk by using these methods. Our results confirm these findings, since the obtained FRAP values show identical trends as the TPC values (Table 4), regardless of the milk type. Thus, the TPC values (Table 4) also increased in heat treated milk when compared to raw milk, whereby the highest values for both milk types were determined in sterilized milk samples, too. Statistical analysis revealed no significant differences (p>0.05) among different milk type samples treated at the same temperature/time regimes. The only exception was the treatment 116 °/6ʹ which showed the highest values in both milk types and the obtained values were significantly different (p<0.05) indicating the importance of exposure time being greater than that of the exposure temperature (Table 4). Comparing the values of different heat treatments among the same milk type, statistically significant differences (p<0.05) were observed only for samples 116 °/6ʹ in mare milk, and for both sterilised cow milk samples. Considering the fact that the MRP formed during heat treatments obviously caused the increase in FRAP values (Table 4), TPC values were probably affected in similar way.
SDS-PAGE results
SDS-PAGE is successfully used to quantify main proteins in milk in a single gel (Dupont et al., 2018). This technique allows a clear separation of all the whey proteins and caseins, and thus enables an insight into their denaturation caused by different heat treatments. Figure 3 contains the results of the SDS-PAGE protein profile of raw and heat-treated cow and mare milk.
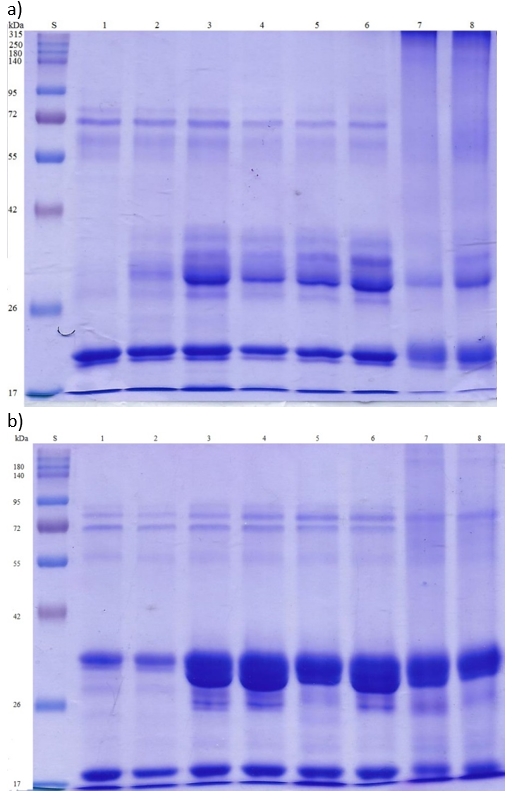
S - standard; 1 - raw milk; 2 - 63 °C /15”; 3 - 63 °C /30ʹ; 4 - 72 °C /20″; 5 - 85 °C /30″; 6 - 90 °C /5ʹ; 7 - 116 °C /16ʹ; 8 - 120 °C /5ʹ
Figure 3. Protein profiles of raw and heat-treated mare (a) and cow (b) milk analysed by SDS-PAGE
The S band represents the solution of protein standards with molecular weight from 17 to 315 kDa, which corresponds well to molecular weight of casein and whey protein fractions in milk. According to Figure 3, raw milk samples (column 1) show some differences related to the present protein fractions. Raw mare milk shows most visible bands (Figure 3a) for lower molecular weight (Mw) fractions (between 17 and 26 kDa) which correspond to glycosylated α-LA (17 kDa; Girardet et al, 2004, Lisak Jakopović et al., 2016), β-Lg (18.4 kDa; Dupont et al, 2018), glycosylated α-lysozime (21.5 kDa; Girardet et al, 2004), α- (23 kDa), β – (24 kDa) and κ- (19 kDa) casein (Potočnik et al., 2011; Dupont et al. 2018), as well as the mixture of approximately 60 % of glycosylated lysozime and 40 % of an equine β-casein carboxy-terminal peptide (19 kDa) typically found in equine milk (Gerardet et al., 2004). Opposite to that, raw cow milk (Column 1, Figure 3b) shows most visible bands around 17 kDa fraction corresponding to glycosylated α-LA (17 kDa; Girardet et al., 2004, Lisak Jakopović et al., 2016) and β-Lg (18.4 kDa; Dupont et al., 2018), as well as between 26 and 42 kDa corresponding to casein fractions with molecular weight of approximately 29 kDa (α-, β - and κ- casein) (Potočnik et al., 2011; Čurlej et al., 2022). Another group of visible bands for both types of raw mare milk (Figure 3) is in the Mw area between 55 and approximately 80 kDa (Figure 3a) corresponding to the imunoglobulin heavy chain fraction at 55 kDa (Inglinstad et al., 2010), the serum albumin fraction at 66 kDa and Lf at 76.1 kDa (Inglinstad et al., 2010, Narmuratova et al., 2022). Thus, raw cow milk is obviously deficient in small molecular weight fractions between 17 and 25 kDa which were observed in raw mare milk (Figure 3a). Considering heat-treated milk samples, thermisation at 63 °C/15ʺ (column 3) as the mildest applied regime caused no significant changes in both milk types. Pasteurized mare milk bands (columns 3-6, Figure 3a) indicate some changes in low molecular fractions between 17 and 26 kDa, which might correspond to interactions between the κ- casein and whey proteins resulting in protein complexes of molecular weight between 26 and 42 kDa, as some authors already described (Donato and Guyomarcʹh, 2009, Čurlej et al., 2023). Mare milk β-Lg band remained more or less stable after the applied pasteurization regimes, while sterilization regimes (columns 7 and 8) caused a certain denaturation, which is visible as lighter bands (Figure 3a). Such results correspond to Uniacke Lowe et al. (2010) who previously found that equine β-Lg was more heat resistant than bovine. In line with that, denaturation of β-Lg in cow milk (Figure 3b) most probably started already at the LTLT pasteurization (column 3) and intensified by increasing the temperature, which is visible as lighter bands in the Mw area around 17 kDa. The observed lighter bands might also occur due to interaction between β-Lg and casein at higher temperatures (columns 4-8), which might be the reason for somewhat lighter bands of casein as well (Figure 3b). The bands corresponding to the SA fraction and the Lf fraction, respectively, were somewhat lighter for HTST pasteurization regimes (columns 4-6) in both milk types which might indicate partial denaturation of these fractions, while they are not visible in sterilized mare milk samples (columns 7 and 8, Figure 3a) indicating a complete denaturation.
NIRs and PCA results
Several authors highlighted NIRs as a very useful, rapid, non-destructive and reliable method which could be used for qualitative analysis of structural changes in raw and heat-treated cow and mare milk (Ru and Glatz, 2000, Tsenkova et al., 2000, Melfsen et al., 2012, Holroyd, 2013, Riu et al., 2020;). According to the NIR spectra shown in Figure 4a, it is evident that a significant increase in absorbance occurs in the wavelength range of 904-985 nm, 1150-1250 nm and 1350-1699 nm. Absorption bands in the range of 904-985 nm were associated with the third overtone of C - H and the second overtone of O – H stretching. In the range of 1150-1250 nm, absorption bands were associated with the second overtone of C – H and the fourth overtone of C = O stretching. The combination of the first overtones of N – H, O – H and C – H stretching appear in the wavelength range 1350–1699 nm (Aeornouts et al., 2011) and could be associated with the water and protein content in milk (Holroyd, 2013).
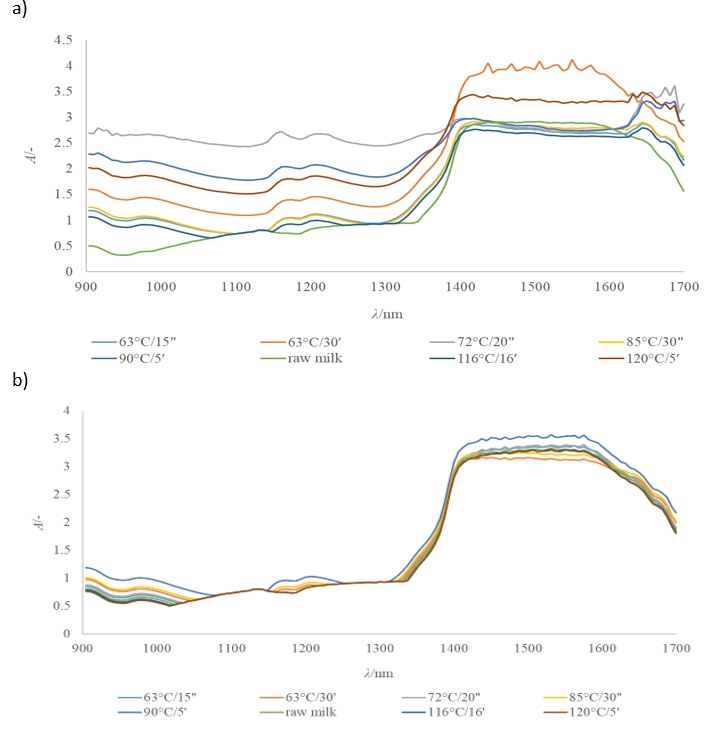
1 - raw milk; 2 - 63 °C/15”; 3 - 63 °C/30’; 4 - 72 °C/20″; 5 - 85 °C/30″; 6 - 90 °C/5’; 7 - 116 °C/16’; 8 - 120 °C/5’
Figure 4. Raw NIR spectra of a raw and heat-treated mare (a) and cow (b) milk samples
In contrast to the considerably different NIR spectra obtained for raw and heat-treated mare milk samples (Figure 4a), NIR spectra for cow milk samples (Figure 4b) are more similar. However, some spectral overlaps and similarities were obtained for raw mare milk and its pasteurized samples treated at 63 °C/15 sec and 85 °C/30 sec, respectively (Figure 4a). Such results indicate structural similarities. Higher absorbance observed for mare milk treated at 63 °C/30 min (Figure 4a) could be related to probable formation of protein complexes, as indicated by SDS-PAGE electrophoresis (Figure 3a). On the other hand, in cow milk, higher absorbance was observed at 90 °C, which could also be connected to proteins denaturation and the complex formation between κ-casein and whey protein (Čurlej et al., 2023; Donato and Guyomarcʹh, 2009) (Figure 4b).
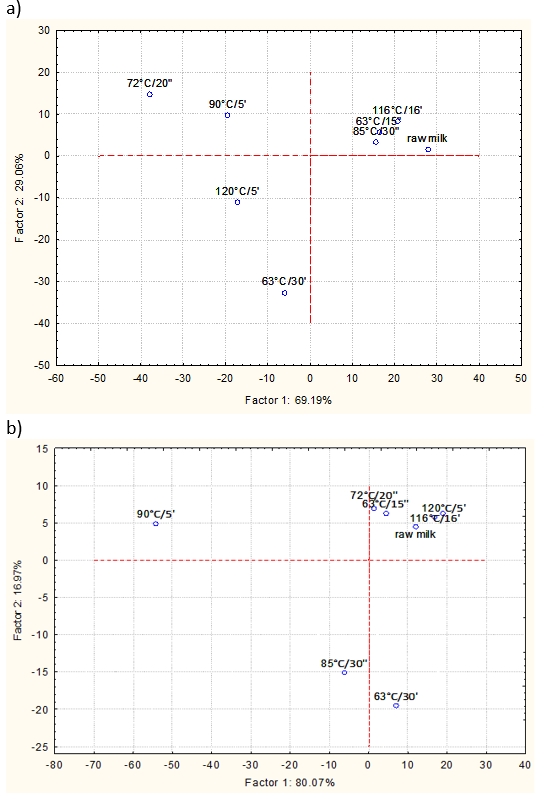
Figure 5. Principle component analysis (PCA) of NIR spectra obtained for raw and heat-treated mare (a) and cow (b) milk samples
PCA is a linear transformation that converts the data to a new coordinate system, where the PC1 represents the most variability in the data (Zhe Ma, 2014). In this study, PCA was used to reduce the number of variables and to express the data based on their similarities and differences according to the applied heat treatment. The raw (unprocessed) NIR spectra were used to perform PCA. Figure 5 shows that over 90 % of the variance (PC1 + PC2) in the observed data set could be explained in both milk samples. Heat-treated mare milk samples (63 °C/15”; 72 °C/20″; 85 °C/30″; 90 °C/5’; 116 °C/16’) are grouped in the first and second quadrants, while the samples 63 °C/30’ and 120 °C/5’ are positioned in the third quadrant. The highest applied temperature of 120 °C and the longest applied treatment of 30 minutes, respectively most probably influenced the separation of samples 63 °C/30’ and 120 °C/5’. Somewhat different pattern was observed for cow milk samples 63 °C/15”, 72 °C/20″, 90 °C/5’; 116 °C/16’ and 120 °C/5’, all of which were grouped in the first and second quadrant. Thereby only samples treated at 63 °C/30’ and 85 °C/30” were positioned into the fourth and third quadrants (Figure 5b). The longest applied treatment of 30 minutes most probably influenced the separation of sample 63 °C/30’, but at this point, it remains unclear why the sample 85 °C/30” was separated from other HTST treatments. Partial explanation might be offered by the results of statistical analysis regarding the HMF content (Figure 2b) which revealed this sample as significantly different from other HTST pasteurized samples. It is also unclear how raw milk samples were positioned and further studies are required to explain such results.
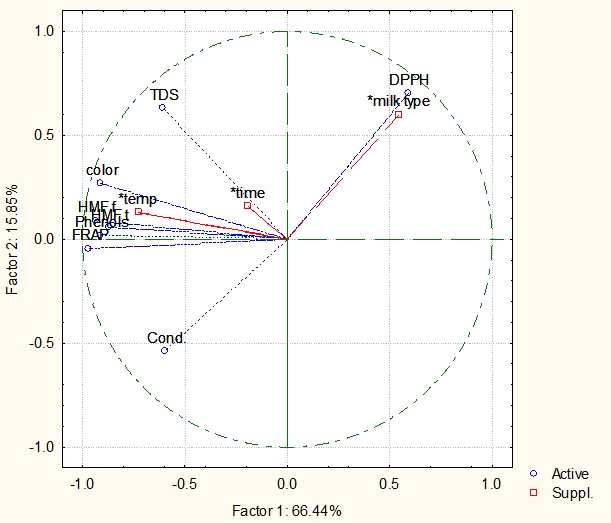
(Active variables: colour (ΔE*), HMF f (free HMF), HMF t (total HMF), DPPH, FRAP, Phenols, TDS (Total Dissolved Solids), Cond (Conductivity). Supplementary variables: temp (temperature), time (exposure time in min), milk type (heat-treated mare and cow milk samples)
Figure 6. Principal Component Analysis (PCA) of the heat-treated mare and cow milk samples
Based on the results obtained from Figure 6, it can be seen that the output variables such as colour, HMF free, HMF total, total phenols, TDS are positioned in the second quadrant, FRAP and Conductivity in the third quadrant while DPPH is placed in the first quadrant. Input variables such as exposure time to heat treatment and temperature are positioned in the second quadrant, while milk type is in the first one. Accordingly, almost overlapping of parameters such as DPPH and milk type in the first quadrant occurs, indicating the dependence of antioxidant activity by the DPPH method on type of the milk sample, which could be confirmed by our experimental results (Table 4), since DPPH values were observed for cow milk samples. Temperature and time influenced the concentration of free and total HMF, phenols, colour and TDS, while neither of the three supplementary variables affected antioxidant activity determined by the FRAP method and EC of heat-treated milk samples. According to the obtained results, first two components (Factor 1 and Factor 2) can explain 82.29 % of variance (66.44 % + 15.85 %), in the observed data set.
Conclusion
According to the obtained results mare milk showed higher values of all parameters, which could be related to compositional differences. PCA revealed that temperature and time influenced the concentration of free and total HMF, total phenols, colour and TDS, while no influence was determined for antioxidant activity determined by the FRAP method and EC of heat-treated milk samples. Thus, in bottle sterilization at 116 °C/16ʹ and 120 °C/5ʹ resulted in the most intense colour changes (ΔE*>5), the highest free and total HMF concentrations and protein denaturation, thus being inappropriate for mare milk processing. Neither of the experimental milk samples contained HMF above the maximum detectable amount of HMF (15 mg/kg) in milk and dairy products reported by EFSA. Overall, the applied HTST regimes (72 °C/20ʺ, 85 °C/30ʺ, 90 °C/5ʺ) as well as thermisation at 63 °C/15ʺ were appropriate for mare milk processing in terms of the studied qualitative changes. However further studies are needed to optimise the correlations between parameters examined in this research as well as to examine changes in sensory properties.
References
AOAC Official Method 991.20 (1991). Nitrogen (total) in milk. Official methods of analysis (15th ed.) 2nd supplement. Association of Official Analytical Chemists. Arlington, VA
Atekwanaa, E.A., Atekwanaa, E.A., Roweb, R.S., Werkema Jr., Dale, D., Legalld, F.D. (2004): The relationship of total dissolved solids measurements to bulk electrical conductivity in an aquifer contaminated with hydrocarbon. Journal of Applied Geophysics 56 (4), 281-294.https://doi.org/10.1016/j.jappgeo.2004.08.003
Czyżak-Runowska, G., Wójtowski, J., Niewiadomska, A., Markiewicz-Keszycka, M. (2018): Quality of fresh and stored mares milk. Mljekarstvo 68 (2), 108-115.https://doi.org/10.15567/mljekarstvo.2018.0204
ISO 6731:2010 Milk, cream and evaporated milk - Determination of total solids content (Reference method)
ISO 5764:2009 Milk - Determination of freezing point - Thermistor cryoscope method (Reference method)