
Introduction
Yoghurt, which is one of the most heavily consumed varieties of dairy products, has an important place in human nutrition as part of the daily diet. In addition to being extremely rich in protein, fats, and minerals, yoghurt is also an important source of probiotics (Song and Aryana, 2014).
During yoghurt fermentation, lactic acid bacteria (LAB) produce many compounds including organic acids (mainly lactic acid), bacteriocins, exopolysaccharides, and vitamins (Devanthi, et al., 2018). LAB are exposed to various abiotic and biotic factors during fermentation, such as acidic, thermal, osmotic, oxidative, and other types of stress, which seriously affect their metabolic activities and production efficiency (Papadimitriou et al., 2016).
LAB, similarly to all other bacteria, perceive non-ideal physical, chemical, and biological conditions in the environment as stress. These stress factors can affect the cell walls and membranes of LAB (Lakhotia, 2001). In response to these various stress conditions, LAB use assorted strategies to resist the damage caused by harsh environments. LAB protect themselves against stressful environments with a strategy called cross-protection, which is commonly observed in LAB. This strategy increases the tolerance of LAB to harsh conditions through preliminary adaptation to mild stress conditions (Yang et al., 2023). The stress response against these stress factors ensures the survival of the LAB (Zhang et al., 2018). Although no extensive research was performed on this strategy, the emergence of multi-omics technologies combined with molecular methods in recent years has allowed a better elucidation of the molecular mechanisms involved in the cross-protection and confirmation of the existence of this strategy. Various key genes and proteins linked to the cross-protection mechanism have been identified (Lin et al., 2020).
Response mechanisms against stress factors cause LAB metabolism to function differently compared to regular metabolism under optimal conditions. This leads to various changes in the production of metabolites, including changes in the production rates, proportions, and types of produced metabolites. In this study, two bacterial strains used in the production of yoghurt ( S. thermophilus and L. delbrueckii subsp. bulgaricus) were subjected to three distinct stress conditions (low pressure, infrared light, and low pressure + infrared light) and then used as starter cultures for yoghurt production. The produced yoghurts were stored for 7 days and examined for the changes in their quality during storage.
Materials and methods
Materials
The pasteurized milk used in the production of yoghurt in the research (Brix: 11.70 %, acidity (°SH): 7.11, pH: 6.72, fat content: 3.72 %, protein content: 3.01 %) was obtained from a chain grocery store operating in the city centre of Afyonkarahisar, Turkiye. Brix values of milk samples were determined using a refractometer (Atago, RX 50000, Japan). Acidity of the samples was determined by the Soxhlet-Henkel method (°SH) using a SH burette (Funke-Gerber 0-25 graduations). The fat content was determined according to the Gerber method using a special milk butyrometer with 0-8 graduations and was expressed as a percentage. The protein ratio was calculated by determining the nitrogen amount of the samples subjected to wet combustion using the micro Kjeldahl method and multiplying the amount of nitrogen found by a factor of 6.38 (AOAC, 2016).
Starter cultures
Strains of Streptococcus thermophilus (DSM 20617, ATCC 20617) and Lactobacillus delbrueckii subsp. bulgaricus (DSM 20081, ATCC 11842) were used in this study.
Processes applied to starter cultures
Starter cultures of the two bacterial strains were first incubated for 48-72 hours under anaerobic conditions at 45 °C in De Man, Rogosa and Sharpe broth (110661, Merck Millipore, Germany). At the end of the incubation period, the bacteria that proliferated in the broth were inoculated on Streptococcus agar (11007, Merck Millipore, Germany) or Lactobacillus bulgaricus agar (17154, Merck Millipore, Germany) media, depending on the strain, and re-incubated for 48-72 hours under anaerobic conditions at 45 °C.
After the incubation period, the bacteria were subjected to low pressure, infrared (IR) light, or a combination of low pressure + IR light for 1 and 2 hours separately under conditions determined because of preliminary tests in a cabinet specially designed for this purpose. The conditions of the environment for the low pressure and IR light + low pressure applications were as follows: pressure: -300 mbar; temperature: 45 °C; humidity: 55.7 %; oxygen concentration: 0.06 %; and carbon dioxide: 0.13 ppm. The conditions for the IR light application were as follows: temperature: 37 °C; humidity: 65.1 %; oxygen concentration: 14.3 %; and carbon dioxide: 0.733 ppm.
After the stress applications were completed, samples were collected separately from the bacterial colonies in petri dishes with a sterile loop and suspended in tubes containing 10 mL of sterile physiological saline (115525, Merck, Germany) until a homogeneous turbidity was achieved. The density of the obtained inoculum suspension was adjusted to the 0.5 McFarland standard (8.17 log CFU/mL) with the help of a densitometer (1B, Biosan, Turkey).
Production of yoghurt
The pasteurized milk used in this study was heated to 45 °C and then transferred into sterile containers of 200 mL. Bacterial inocula were prepared according to the 0.5 McFarland turbidity standard and were then inoculated separately in containers with 200 mL of pasteurized milk at a proportion of 1 part S. thermophilus and 1 part L. delbrueckii subsp . bulgaricus. Inoculated milk samples were then left for incubation at 45 °C (Incubel, MMM, Germany) until the pH value of the samples reached 4.60. Samples that completed incubation were rapidly cooled to 4 °C and kept in a refrigerator at 4 °C for 7 days until the analyses were completed.
Physicochemical analyses
All analyses carried out throughout the course of this study were repeated in triplicate. The pH values of the milk samples were measured with a digital pH meter calibrated with buffers of pH 4, 7, and 10 (HI 2215 pH/ORP, Hanna Instruments, Smithfield, RI, USA) (AOAC, 2016).
Colour (L*, a*, b*) value analyses
The colour values of the samples were measured with a colorimeter (Chroma Meter, CR-400, Japan) according to the Hunter Lab colour measurement system (Ruiz-Gutiérrez et al., 2014).
Texture analysis
Firmness, consistency, cohesiveness, and viscosity index values of the yoghurt samples were determined with a TA. XT Plus Texture Analyzer (Stable Micro Systems, UK) using back extrusion rigs (model A/BE, inner diameter of 40 mm). Since higher temperatures would affect the textural parameters, analyses were carried out while the samples were at temperatures of 4-8 °C. The device parameters were as follows: load cell: 5000 g; trigger load: 4.5 g; test speed: 60 mm/s; probe penetration: 15 mm (García-Gómez et al., 2018).
Syneresis values (%, w/w)
The syneresis values (%) of the yoghurt samples were measured using the centrifugation method. For this purpose, yoghurt samples (m0 = 25 g) were weighed and transferred to centrifuge tubes on day 1 of storage. They were then centrifuged at 25 °C for 25 minutes. The supernatant (separated yoghurt water) was separated and weighed and that value was taken as m. Syneresis values were then calculated according to the following equation (Bhullar et al., 2002).
Syneresis (%) = (m0/m) × 100
Organic acid analysis
The organic acid contents of the samples were determined using a HPLC system (Shimadzu Prominence, Shimadzu Corp., Japan). Alquots of 4 g were taken from the yoghurts and 20 mL of 0.01 N H2SO4 was added. These mixtures were then vortexed, passed through 0.45-µm filters, and injected into the HPLC system (Güzel Seydim et al., 2000). The specifications of the system used are as follows: CBM: 20ACBM; detector: DAD (SPD-M20A); column oven: CTO-10ASVp; pump: LC20 AT; autosampler: SIL 20ACHT; computer program: LC Solution; column: ODS 4 (250 mm × 4.6 mm, 5 µm; Inertsil ODS-4, GP Sciences, Japan); mobile phase: ultrapure water adjusted to pH 3 with orthophosphoric acid (Aktaş et al., 2005).
Aroma component analysis
The aroma components of the yoghurt samples were analysed with a GC-MS system (Agilent 7697A Headspace Sampler, 7890A GC, and 5975C MS, Agilent Technologies, USA). First, samples of 4 g/mL were taken and injected into the headspace system. The column temperature was held at 35 °C for 5 minutes and then increased to 150 °C at a rate of 50 °C per minute, and then it was held at 150 °C for 5 minutes. The detector and injector temperatures were set to 200 °C and 180 °C, respectively. Other specifications were as follows: flow rate: 25 psi (He); needle: 90 °C; transfer line: 120 °C; vial oven: 85 °C; thermostat time: 5 minutes; pressurization time: 0.5 minutes; injection time: 0.08 minutes; withdrawal time: 0.5 minutes (Yılmazer and Seçilmiş, 2006).
Microbiological analysis
Serial dilutions of the yoghurt samples were prepared for analyses, and the analyses were performed using the spread plate technique. For bacteria count measurements, S. thermophilus samples were incubated on Streptococcus agar (11007, Merck Millipore, Germany) and L. delbrueckii subsp . bulgaricus samples were incubated on Lactobacillus bulgaricus agar (17154, Merck Millipore, Germany), both under anaerobic conditions at 45 °C for 48-72 hours (Bracquart, 1981).
Experimental design and statistical analysis
This study was conducted using a completely randomized research design with a factorial structure (3 × 7). The factors were storage time (0, 4, and 7 days) and yoghurt samples (control, 1 or 2 hours of low pressure, 1 or 2 hours of IR light and 1 or 2 hours of low pressure + IR light). A two-way analysis of variance was used to determine the differences between the samples during the storage period (P<0.05). Interactions between sample types, between storage times, and between sample types and storage times were determined by the correlation analysis. The results of the analysis were subjected to the ANOVA procedure followed by Duncan’s multiple range tests (IBM SPSS Statistics 23, IBM Corp., USA). The design was completely randomized via replications.
Results and discussion
pH value
The samples that were subjected to low pressure for 2 hours reached a pH value of 4.60 the fastest, completing incubation in 4 hours and 20 minutes. The samples that were subjected to IR light for 2 hours reached a pH value of 4.60 the slowest, taking 7 hours to complete incubation (Figure 1).
The pH values of all samples decreased during the storage period (p<0.05). The samples with the highest pH values at the end of storage, reaching a pH value of 4.50, were the samples subjected to IR for one hour. On the other hand, the samples with the lowest pH value at the end of storage, reaching a pH value of 4.34, were the samples subjected to low pressure + IR light for 2 hours (Table 1). In general, an increase in the duration of exposure to low pressure, IR light, and low pressure + IR light corresponded to larger decreases in the pH values of the samples. In addition, the organic acids produced by the starter cultures, mainly lactic acid, also influenced the reduction of pH values.
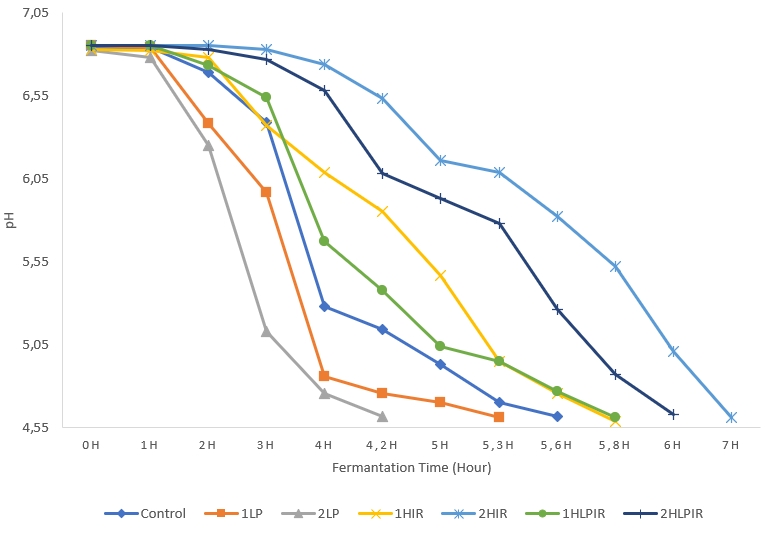
Figure 1. Change of pH value of samples during the fermentation
Table 1. Ls means values for storage time, samples and storage time x samples interaction on pH, syneresis (%), L*,a* and b* values
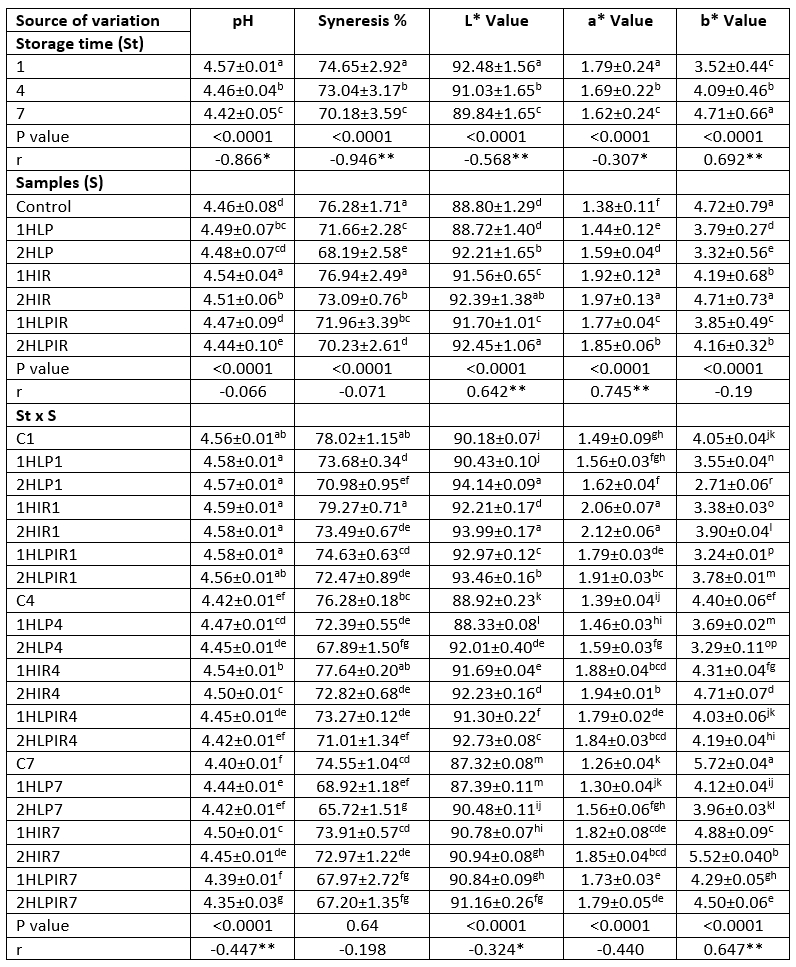
a - p (↓): Values with the same capital letters in the same column for each analysis differ significantly (p<0.05). p<0.0001: Statistically too much significant. **. Correlation is significant at the 0.01 level (2-tailed). *Correlation is significant at the 0.05 level (2-tailed).
Colour values
During storage, the L* and a* values of all samples decreased, while the b* values of all samples increased (p<0.05). Throughout the study, the samples that were subjected to low pressure and IR light for 2 hours had the highest and second highest L* values, respectively. In contrast, control samples and samples that were subjected to low pressure for 1 hour had the lowest L* values. An increase in the duration of exposure to stressors caused an increase in L* values. It was determined that the yoghurt samples subjected to IR light for 2 and 1 hours had the highest a* values, while the control samples and the samples subjected to low pressure for 1 hour had the lowest a* values. Subjecting samples to IR light and a combination of IR light + low pressure increased the a* values. An increase in the duration of the samples’ exposure to stressors also caused a parallel increase in a* values (Table 1). It was determined that the samples subjected to low pressure had the lowest b* values, while the control samples and the samples subjected to IR light had the highest b* values. An increase in the duration of exposure to low pressure caused a decrease in b* values, while an increase in the duration of exposure to IR light caused an increase in b* values. Jakubowska and Karamucki (2019) similarly reported that L* and a* values decreased and b* values increased in yoghurt samples during storage.
Additionally, it was determined that L* and a* values decreased and b* values increased in parallel with the decrease in pH values of the samples during storage. Similar to our research findings, Cais-Sokolinska and Pikul (2006) stated that pH change was effective on the colour values of yoghurt during storage.
Syneresis % values (w/w)
It was determined that the samples that were subjected to IR light for 1 hour had the least serum separation during storage, while the samples that were subjected to low pressure for 2 hours had the most serum separation during storage (Table 1). Syneresis, which can be defined as the amount of water separated because of the contraction of yoghurt clots, is directly linked to the fermentation time and degrees Brix of yoghurt (Tamine and Robinson, 2004). It was previously reported that low and rapidly developing acidity also influences syneresis (Lucey, 2001), which confirms our own research findings. Subjecting the starter cultures used in yoghurt production to low pressure, IR light, and a combination of low pressure + IR light resulted in a decrease in syneresis % values. In contrast, increasing the duration of exposure to these stressors increased the syneresis % values. Exposure to low pressure affected syneresis values the most, followed by exposure to low pressure + IR light and exposure to IR light, respectively.
Texture values
Although the firmness and consistency values of all samples decreased during storage, their cohesiveness and viscosity index values increased (Table 2; p<0.05). At the beginning and the end of storage, samples that were subjected to IR light for 2 hours had the highest firmness values at 200.88 g and 141.415 g, respectively, while samples subjected to low pressure for 1 hour had the lowest firmness values at 72.535 g and 36.92 g, respectively. At day 1 and day 7 of storage, samples subjected to low pressure for 2 hours had the highest consistency values among the different yoghurt samples, at 3024.915 g s and 2543.655 g s, respectively, while the control samples had the lowest consistency values at 1224.27 g s and 823.76 g s, respectively (Table 2).
The cohesiveness and viscosity index values of the samples subjected to low pressure for 2 hours increased the most during the 7-day storage period, while those of the control samples increased the least. An increase in the duration of exposure to stressors from 1 hour to 2 hours caused a decrease in cohesiveness and viscosity index values. Exposure to low pressure had the most profound effect on these values, followed by exposure to low pressure + IR light and to IR light alone.
Table 2. Ls means values for storage time, samples and storage time x samples interaction on firmness (g), consistency (g sec), cohesiveness (g) and index of viscosity (g sec)
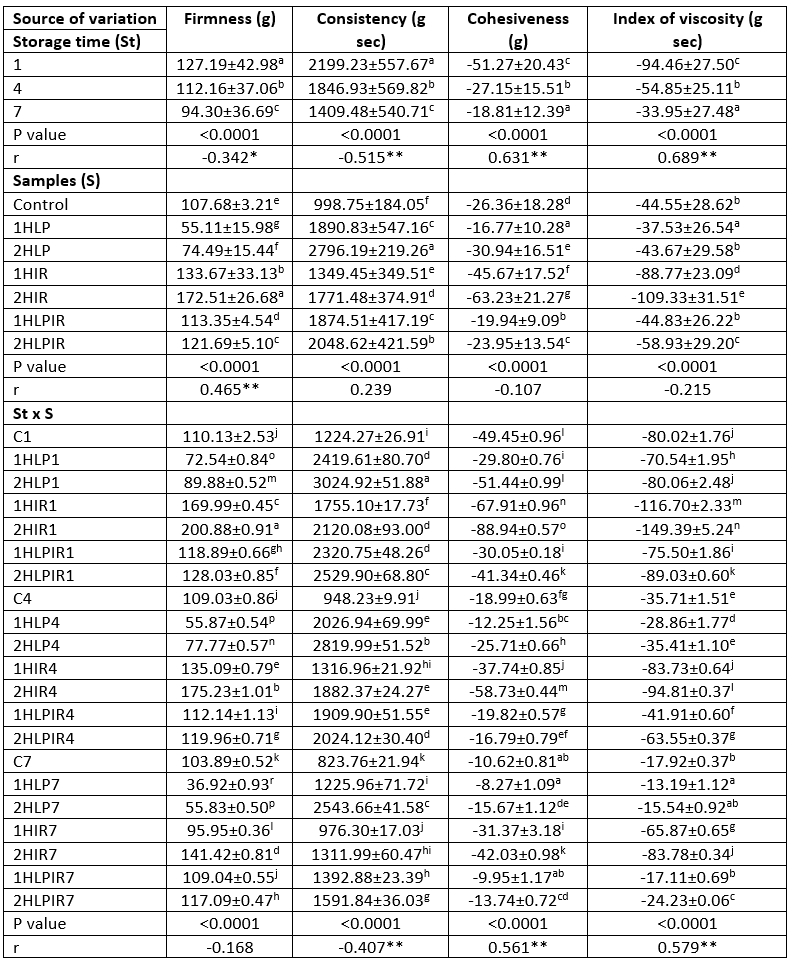
a - p (↓): Values with the same capital letters in the same column for each analysis differ significantly (p<0.05). p<0.0001: Statistically too much significant. **Correlation is significant at the 0.01 level (2-tailed). *Correlation is significant at the 0.05 level (2-tailed).
Most of the osmotic stresses that LAB encounter affects their cell walls. Responses to this stress perceived by the cell wall are generated by several regulatory systems (Silver, 2003). The main response of LAB to osmotic stress is producing or importing small molecules called osmolytes (e.g., glycine betaine, choline, or proline) to balance the difference between intracellular and extracellular concentrations (Molenaar et al., 1993; Glaasker et al., 1998; Sleator and Hill, 2002; Papadimitriou et al., 2016). LAB respond to stressors such as UV and IR light through similar mechanisms (Papadimitriou et al., 2016). Studies have shown that stress factors induce the synthesis of at least 14 polypeptides in LAB as a response against stressors (O’Sullivan and Condon, 1997). As a result of these mechanisms, LAB convert osmolytes that they intake or synthesize intracellularly into very different compounds using different enzyme systems and metabolic pathways. Most of these components are then exported out of the cell. The produced intracellular and extracellular polypeptides are the main factors causing detectable physical differences after fermentation.
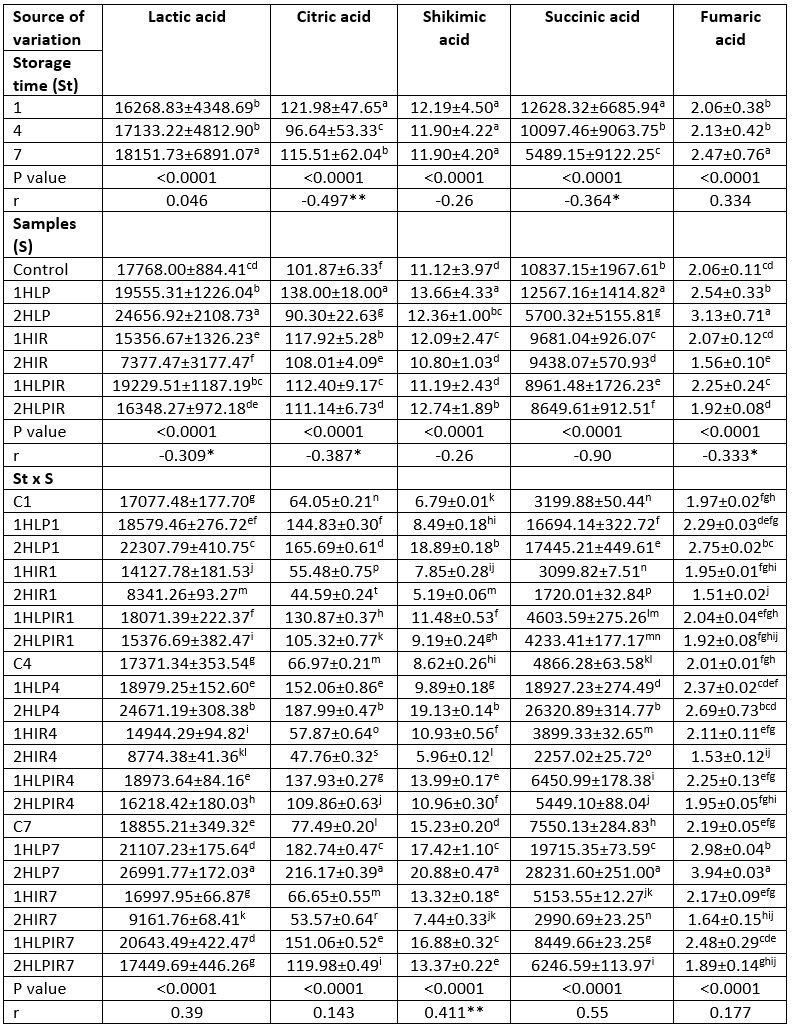
Organic acid values
Organic acid values of all samples increased during storage (p<0.05). Among the seven different sample types, samples that were subjected to low pressure for 2 hours had the highest overall organic acid values on the first and last days of storage. Samples subjected to low pressure for 1 hour had the second highest overall organic acid values, except for shikimic acid. In contrast, it was determined that the yoghurt samples produced with starter cultures that were subjected to IR light for 2 hours had the lowest overall organic acid values, except for oxalic acid, on the first and last days of storage (Table 3). Similar the other results obtained in this study, organic acid values changed depending on the duration of exposure to stressors. In this context, an increase in the duration of exposure to low pressure increased the organic acid contents, while an increase in the duration of exposure to IR light and low pressure + IR light decreased the amount of organic acids produced.
Table 3. Ls means values for storage time, samples and storage time x samples interaction on organic acids (mg/kg)
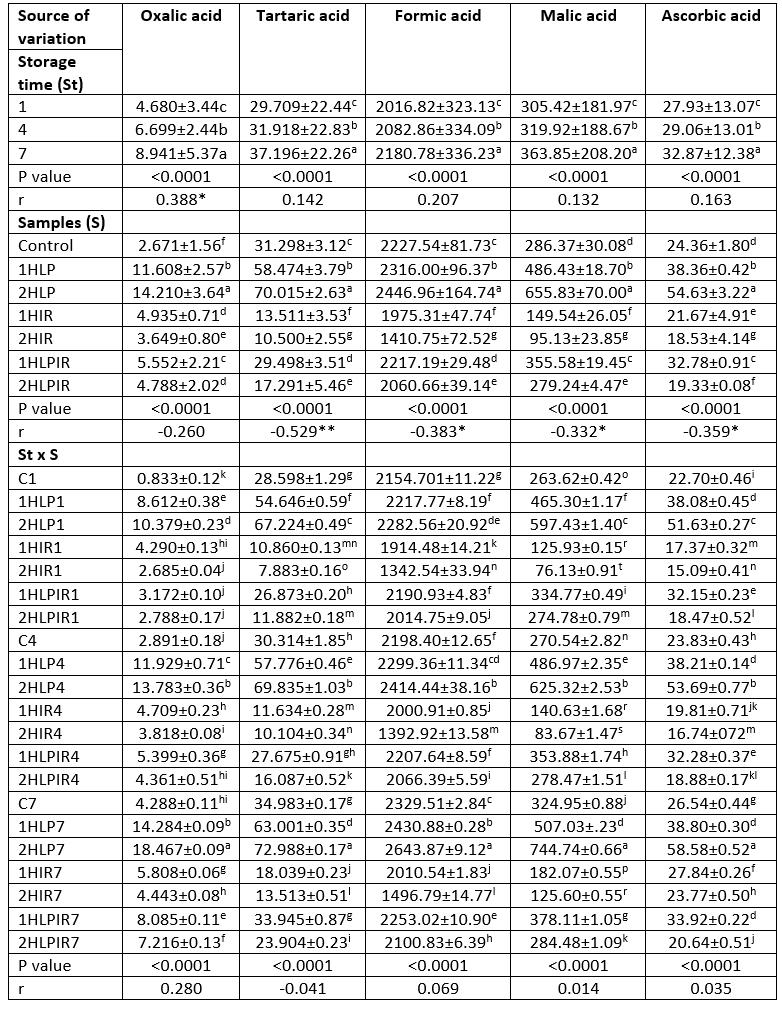
a - t (↓): Values with the same capital letters in the same column for each analysis differ significantly (p<0.05). p<0.0001: Statistically too much significant. **Correlation is significant at the 0.01 level (2-tailed). *Correlation is significant at the 0.05 level (2-tailed).
In all samples, lactic acid was the most prevalent organic acid in terms of amount (mg/kg) at the beginning and end of storage among the ten different organic acids analysed. This was followed by succinic acid, formic acid, and oxalic acid, respectively. The highest amounts of lactic acid on the first and last days of storage were 22307.79 mg/kg and 26991.77 mg/kg, respectively, and these values were detected in samples subjected to low pressure for 2 hours. In contrast, the lowest amounts of lactic acid were 8341.26 mg/kg and 9161.76 mg/kg, respectively, and these values were detected in samples subjected to IR light for 2 hours (Table 3).
In parallel with our research findings Adhikari et al. (2002) and Donkor et al. (2016) stated that organic acid values in yoghurt samples increased during storage.
Table 3 (Continue): Ls means values for storage time, samples and storage time x samples interaction on organic acids (mg/kg)
a - t (↓): Values with the same capital letters in the same column for each analysis differ significantly (p<0.05). p<0.0001: Statistically too much significant. p<0.05: Statistically significant. **Correlation is significant at the 0.01 level (2-tailed). *Correlation is significant at the 0.05 level (2-tailed).
Aroma component values
All aroma component values of the yoghurt samples increased during the 7-day storage period (p<0.05). As with organic acid values, it was determined through analysis that samples subjected to low pressure for 2 hours had the highest aroma component values at the beginning and end of storage, followed by samples subjected to low pressure for 1 hour (except ethanol). In addition, it was determined that the yoghurt samples produced with the starter cultures that were subjected to IR light for 2 hours had the lowest aroma component values on days 1 and 7 of storage (except acetaldehyde on day 7) (Table 4).
Table 4. Ls means values for storage time, samples and storage time x samples interaction on aroma (mg/kg)
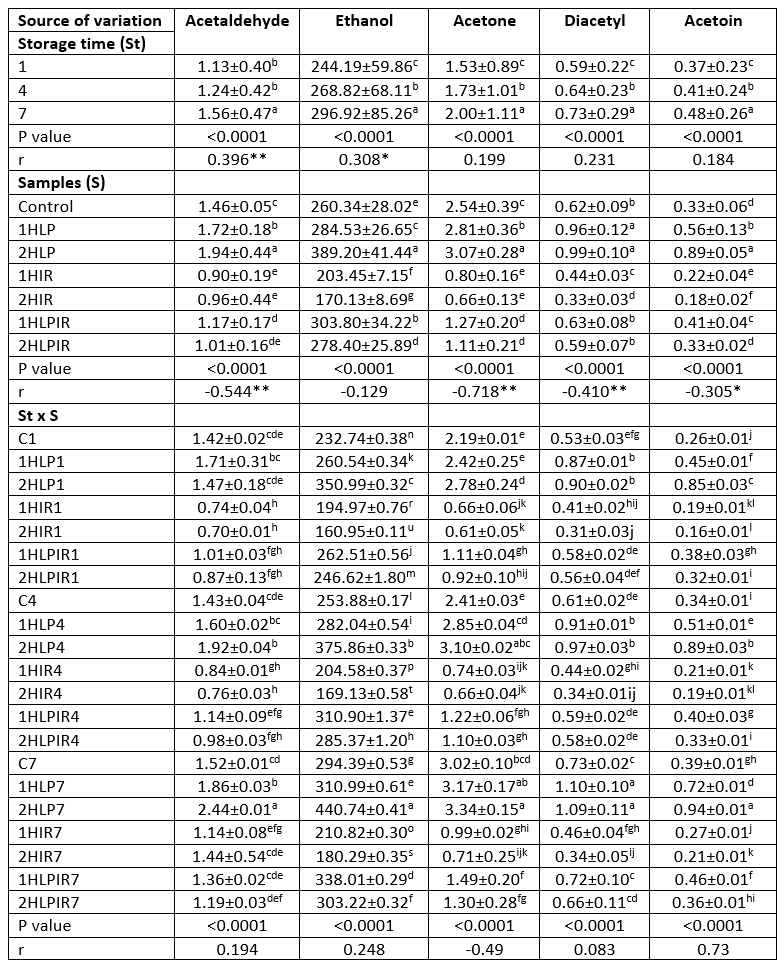
a - u (↓): Values with the same capital letters in the same column for each analysis differ significantly (P<0.05). p < 0.0001: Statistically too much significant. **Correlation is significant at the 0.01 level (2-tailed). *Correlation is significant at the 0.05 level (2-tailed).
An increase in the duration of exposure to low pressure increased all aroma component values except ethanol, while an increase in the duration of exposure to IR light and low pressure + IR light decreased aroma component values.
Like other results obtained in this study, aroma component values changed depending on the duration of exposure to stressors. An increase in the duration of exposure to low pressure increased the aroma component values, while an increase in the duration of exposure to IR light and low pressure + IR light decreased the amounts of produced aroma components.
Ethanol was the most prevalent aroma compound in terms of amount (mg/kg) on days 1 and 7 of storage in all analysed yoghurt samples. This was followed by acetic acid, propionic acid, and butyric acid, respectively. The highest amounts of ethanol at the beginning and end of storage were 350.99 mg/kg and 440.74 mg/kg, respectively, and these values were detected in samples subjected to low pressure for 2 hours. In contrast, the lowest amounts of ethanol were 160.95 mg/kg and 180.29 mg/kg, respectively, and these values were detected in samples subjected to IR light for 2 hours (Table 4).
Table 4 (Continue): Ls means values for storage time, samples and storage time x samples interaction on aroma (mg/kg)
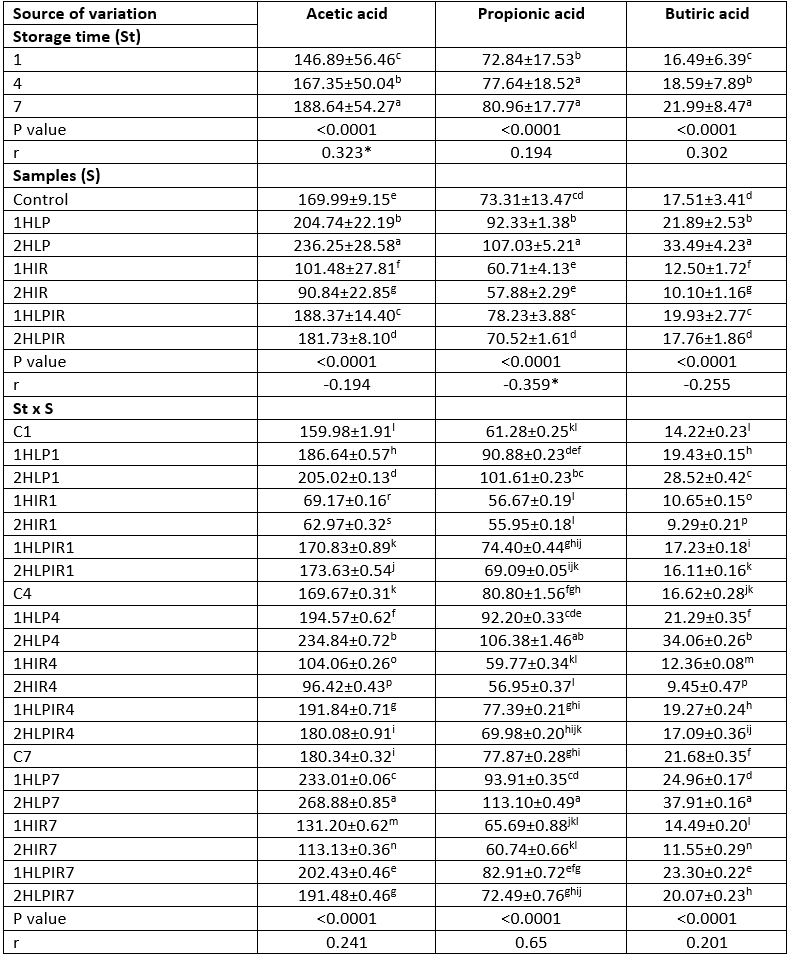
a - p(↓): Values with the same capital letters in the same column for each analysis differ significantly (p<0.05). p<0.0001: Statistically too much significant. p<0.01: Statistically significant. **Correlation is significant at the 0.01 level (2-tailed). *Correlation is significant at the 0.05 level (2-tailed).
In the presence of glucose and citrate, heterofermentative LAB species use homofermentative and facultative glycolytic pathways to form 2 moles of lactic acid and ATP for every 1 mole of glucose consumed. Mainly under stress conditions, lactococci and thermophilic lactobacilli metabolize citrate and produce pyruvate. Environmental conditions determine the fate of pyruvate. Pyruvate is produced from each mole of citrate, followed by acetoin, butanediol, and diacetyl, which protect the cell against stress. In addition, some species metabolize citrate and synthesize acetic acid and ATP under conditions of carbohydrate starvation (Starrenburg and Hugenholtz, 1991; Bove et al., 2012; Papadimitriou et al., 2016).
Based on the results of the present study, it is thought that the metabolic system described above is responsible for the higher amounts of organic acids and aroma components contained in yoghurts produced using starter cultures subjected to low pressure, IR light, or a combination of low pressure + IR light compared to control samples.
Microbiological analysis
The S. thermophilus and L. delbrueckii subsp . bulgaricus counts of the seven different sample types of yoghurt increased over the first 4 days of storage and decreased in the following days in all cases (p<0.05). It was found that samples subjected to low pressure + IR light for 1 hour had the highest S. thermophilus counts on the first and last days of storage, while samples subjected to IR light for 2 hours had the highest L. delbrueckii subsp . bulgaricus counts on the first and last days of storage. Samples subjected to low pressure for 2 hours had the lowest counts of both bacteria. The highest L. delbrueckii subsp . bulgaricus and S. thermophilus counts on the first and last days of storage were 7.34 and 7.33 log CFU/g (first day) and 7.15 and 7.22 log CFU/g (last day), respectively, in samples subjected to low pressure + IR light for 2 hours and IR light for 2 hours. In contrast, samples subjected to low pressure for 2 hours had the lowest L. delbrueckii subsp . bulgaricus and S. thermophilus counts on the first and last days of storage at 6.89 and 7.03 log CFU/g (first day) and 6.61 and 6.60 log CFU/g (last day), respectively (Table 5).
Table 5. Ls means values for storage time, samples and storage time x samples interaction on S. thermophilus, L. delbrueckii subsp. bulgaricus, species bacteria count (log cfu/mL)
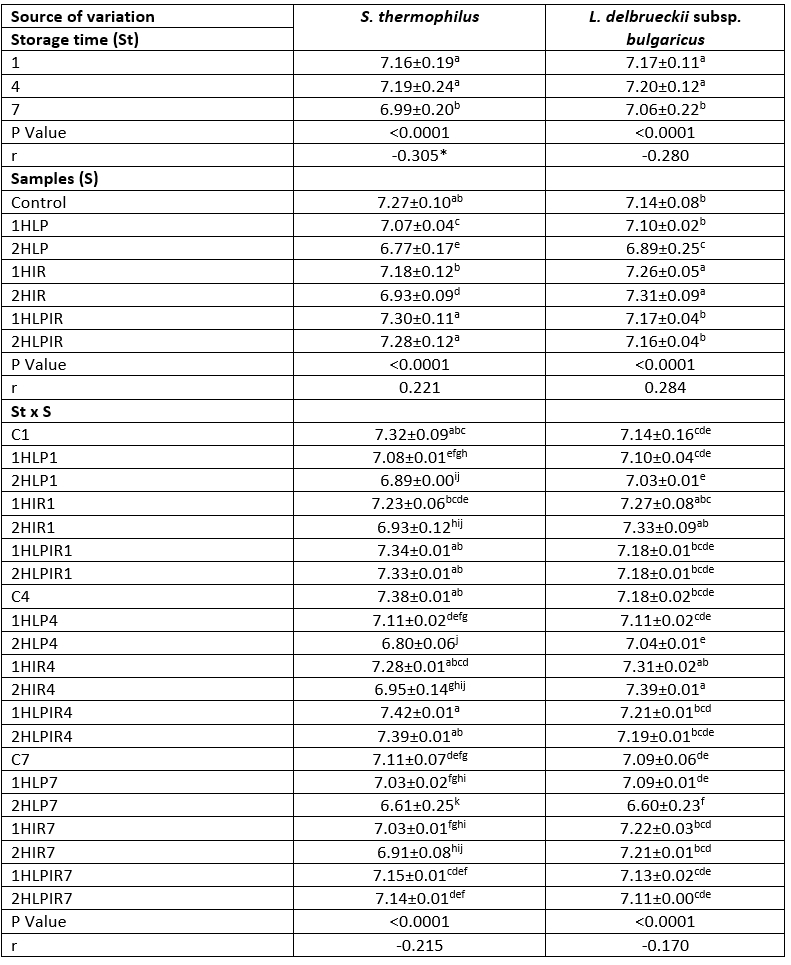
a – p (↓): Values with the same capital letters in the same column for each analysis differ significantly (p<0.05). p<0.0001: Statistically too much significant. **Correlation is significant at the 0.01 level (2-tailed). *Correlation is significant at the 0.05 level (2-tailed).
LAB encompass a very wide variety of species (Vandamme et al., 2014), and each species included in this group responds to stress differently. The responses of some species may be much stronger, faster, or more continuous, while the responses of other species may be weaker, slower, or non-persistent (Papadimitriou et al., 2016; Kajfsz and Quivey, 2011). The differences that occurred between microbiological analysis results can be explained by the different stress responses of LAB species.
Conclusion
It was found that among yoghurts produced using starter bacteria exposed to three different stress conditions, the yoghurts produced with bacteria subjected to low pressure had lower fermentation times, higher organic acid and aroma component contents, and less serum separation during the storage period. It was also determined that increasing the duration of exposure to low pressure made the resulting effect stronger. In addition, it was found that yoghurt samples produced with bacteria exposed to stress conditions had higher L* and a* values, lower b* values, improved textural values, and higher bacterial counts during storage compared to control samples.
In this study, the effects of the response mechanisms of two different starter bacteria to different stressors on the quality of yoghurt over the course of a 7-day storage period were also examined. It was determined that, among the three considered stress conditions, exposure to low pressure positively affected the physicochemical, textural, and microbiological quality of yoghurt during storage, and extending the exposure time further increased that effect.
In recent years, the increase in demand for safer and functional foods produced without the use of additives has led food manufacturers to work in this direction. It is thought that the yoghurts obtained in this study can offer alternative solutions to the search for additive-free, microbially safer, functionally enriched and longer shelf-life products.