
Uvod
Forest roads are important structures that provide transportation from the establishment stage of the forest to the production stage. Road planning and production activities are important elements of forestry activities (Abdi et al., 2009). Planning of forest roads is of great importance in order to carry out production processes efficiently, safely, comfortably and economically (Abeli et al., 2000; Aruga et al., 2005).
For a long time, the economic feasibility of forestry production works has been the main objective in the establishment and maintenance of forest road networks (Weston et al., 2004; Palmgren et al., 2004; Huang et al., 2006; Saari et al., 2007; Pentek et al., 2007; Demir, 2007; Acar and Ünver, 2007; Gümüş et al., 2008). However, recently, the use of new techniques (Wallace et al., 2016; Wilkinson et al., 2016; Akgül et al., 2017; Türk, 2019; Yurtseven et al. 2019; Türk et al., 2022; Eker, 2023) has led to the evaluation of different factors. One of these techniques is the use of UAV systems on forest roads.
In some forestry studies, decision support systems based on spatial data and computer-aided decision support systems have been widely used. In order to use these new systems successfully and effectively, the topographical features of the forested areas should be represented in the computer in the way closest to reality with the help of DEMs. UAV systems can produce DEMs with high resolution and accuracy.
New generation image processing techniques have a significant impact on the widespread use of UAV platforms. The increasing use of the structure-from-motion (SfM) algorithm, which is considered as the development of photogrammetry, in the digital environment is of great importance in the development of UAV systems (Gülci et al., 2021). High resolution DEMs and orthophotos can be easily created with many commercial or open source software programs based on SfM logic (Shervais, 2015; Wallace et al., 2016).
Globally, studies on forest roads using UAV systems have been increasing recently. Buğday (2018) found the cut and fill volumes of a forest road with UAV. Studies on UAV-based road surface deformation monitoring were carried out by Türk et al. (2019a), Türk et al. (2019b) and Eker (2023). In these studies, the amount of erosion and accumulation on the road surface was determined. Yurtseven et al. (2019) stated that in a point cloud-based study on forest road surface modelling, the road surface models obtained with a terrestrial laser scanner and UAV were close to each other in terms of precision, and that UAV systems can be used in forest roads. In addition to UAVs, there are also studies on forest roads using terrestrial photogrammetry.
In the construction of forest roads, the most important component of road construction cost is cutting work (FAO, 1992). Cut earthworks constitute the largest economic item of the forest road construction cost. Therefore, accurate estimation of excavation volumes is important (Gümüş et al., 2003; Contreras et al., 2012). In the construction of a forest road, the determination of land classifications and the amount of cut is essential for the determination of the road construction cost and the correct calculation of the payment to be made to the contractor company (Acar and Karabacak, 2012).
In this study, the usability of UAV technology in determining forest road cut volume, the comparison of UAV and field measurement results, and the determination of land classifications from UAV images were investigated.
Materijali i metode
Study area - Područje istraživanja
Taşlıyayla Forest Management Sub-Directorate, which was selected for the study area, is located within the borders of Bolu Province, Türkiye (Figure 1). Geographical coordinates are 31° 27' 33" - 31° 41' 57" to the east and 40° 27' 55" - 40° 34' 00" to the north. Within the scope of the study, 640 m of the secondary forest road, which is an unpaved road, was classified as a type B forest road with 5-m platform width according to Communiqué 292 in Turkey. The roads are used for secondary transport. The longitudinal slope of the road where the study was carried out is on average 2.19% and the dominant aspect is west. The average altitude of the study area is 1400 m. According to the climate data of the nearest meteorological station, the average annual temperature is 11.7°C and the average annual precipitation is 439 mm. The total size of Taşlıyayla Forest Management Sub-Directorate is 10310 ha, of which 7202 ha is forested area and 3108 ha is unforested area. The existing forest road length in the sub-directorate is 42 km and the density per hectare of forest roads in active use is 7.59 m/ha (Anonymous, 2018). The main tree species of the region are Scots pine ( Pinus sylvestris L.), Caucasian fir ( Abies nordmanniana subsp. Bornmülleriana Mattf), sessile oak ( Quercus petraea), and poplar ( Populus).
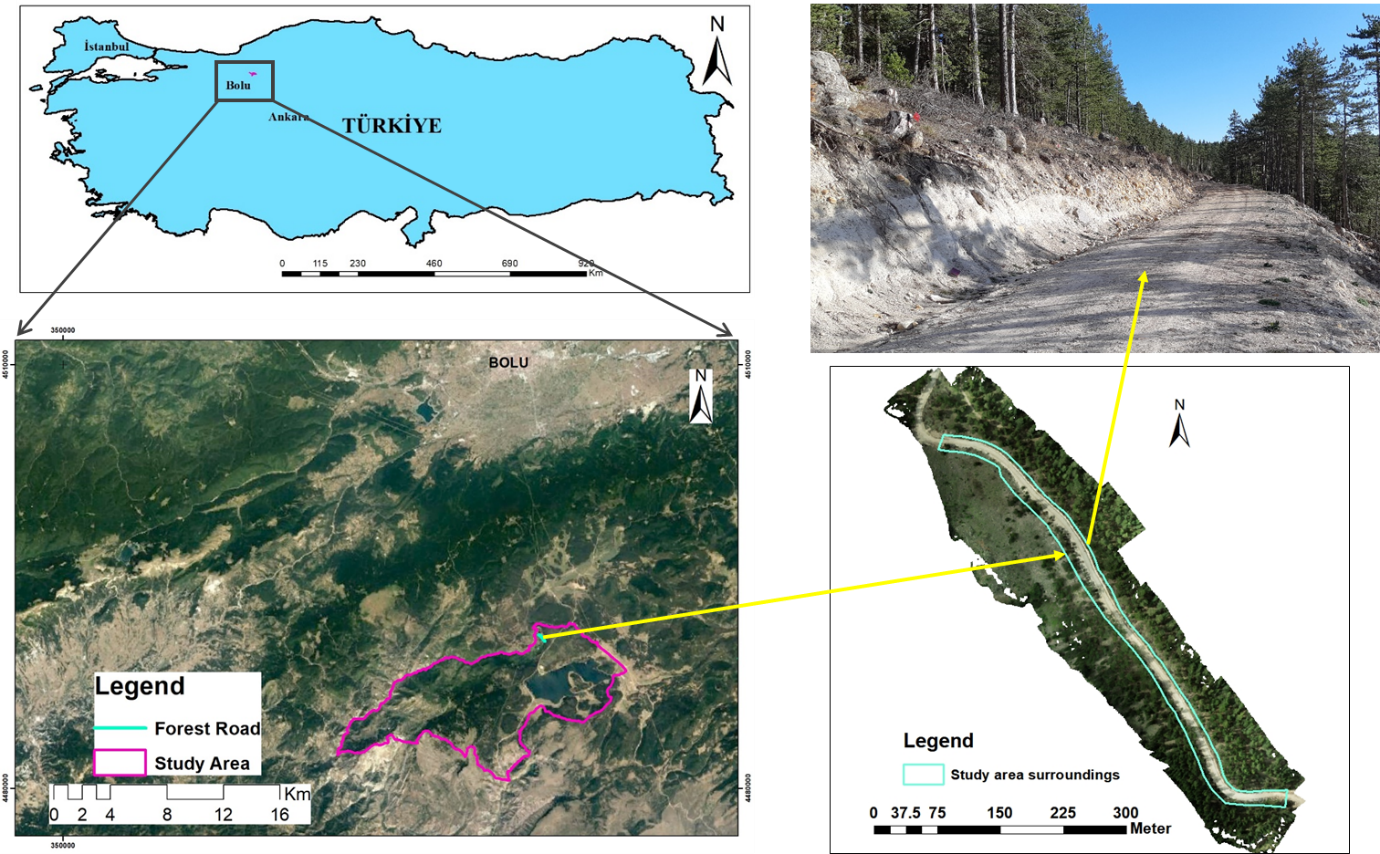
Figure 1. Study area and its surroundings
Slika 1. Područje istraživanja i njegova okolica
Taking digital images with UAV system -- Snimanje digitalnih slika pomoću UAV sustava
The basic steps of image acquisition with UAV are: pre-field preparation, preparation of flight plans, realisation of the flight with field work, and post-flight operations (Eker et al., 2018). In the pre-field preparation phase, some necessary preliminary information such as weather conditions and topography of the relevant area should be obtained before travelling to the field (Lindner et al., 2016; Eker et al., 2018).
In the study, the first flight was carried out on 17.04.2019 before the road construction and the second flight was carried out on 13.09.2020 after the road construction. The first flight was performed with the DJI Mavic Pro model over the road construction area cleared of trees. The flight was planned adaptively to allow image acquisition with a fixed 1.5 cm local resolution and using UgCS 2.18.98 flight planning software. In this context, a flight plan with 75% front and side overlap was created at an altitude of 80 m AGL (above ground level) in relation to the DEM.
The second flight was performed with another UAV platform, the DJI Phantom 4 RTK system, after the road construction was completed, and the flight planning process was created with the DJI GS RTK application from the control of the DJI Phantom 4 RTK system. In this context, firstly, the DEM data of the site (SRTM DEM with 30 m resolution) and the vector data (in KML format) covering the boundaries of the flight area were transferred to the controller via SD card in Global Mapper software. Then, using these data, a topography-adaptive flight with 75% front and side overlap ratios and 100 m AGL was planned.
Before the flight of both UAV platforms in the field, 6 ground control points (GCPs) were selected on the road platform so that they would be clearly visible in the images to be taken with the UAV. In order to minimise the UAV errors and to obtain the closest data to the reality, the following procedure was conducted. The X, Y, and Z coordinates of each GCP established on the road platform with red spray paint in the TUREF TM33 coordinate system were measured horizontally and vertically by a CHCN X91 GNSS receiver (horizontal and vertical accuracy: <0.05 m RMS) with an error of 1-2 cm. When using the GNSS system, TUSAGA-Active (CORS-TR) system was used for accuracy correction. Figure 2 shows the locations of the GCPs. Flights were carried out after the completion of the land application of the GCPs to the terrain.
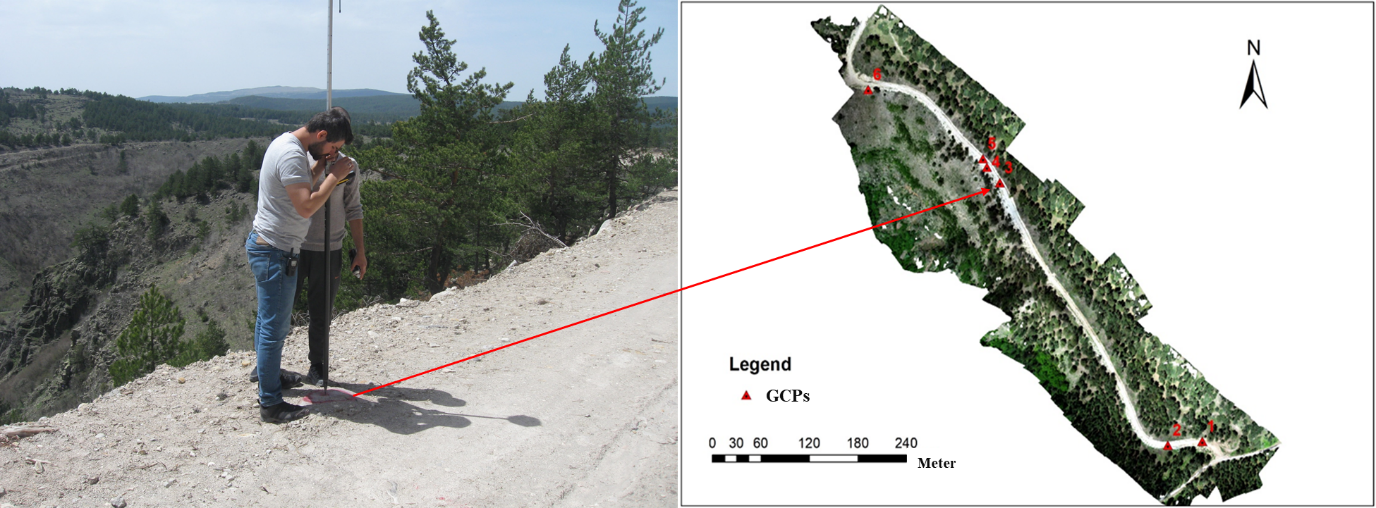
Figure 2. The GCPs were marked in the area and their coordinates were measured with RTK-GNSS receiver
Slika 2. GCP su označene na području i njihove koordinate su izmjerene RTK-GNSS prijemnikom
Processing of digital images taken by UAV -- Obrada digitalnih slika snimljenih UAV-om
Agisoft Metashape Professional Version 1.5.2 software was used to process the images taken by the UAV and produce point clouds, DEMs and orthophoto images of high resolution and accuracy (Figure 3). The software was run on the Windows 10 64-bit operating system. While the accuracy level of the image orientation process was set as medium, the quality settings were selected as high for the other depth map generation and dense cloud generation stages. A 48 GB Intel ® Xeon ® CPU E5-1650 v3 @ 3.50GHz processor model and 4 GB AMD FirePro W5100 graphics card workstation were used for processing, visualisation and analysis of UAV data.
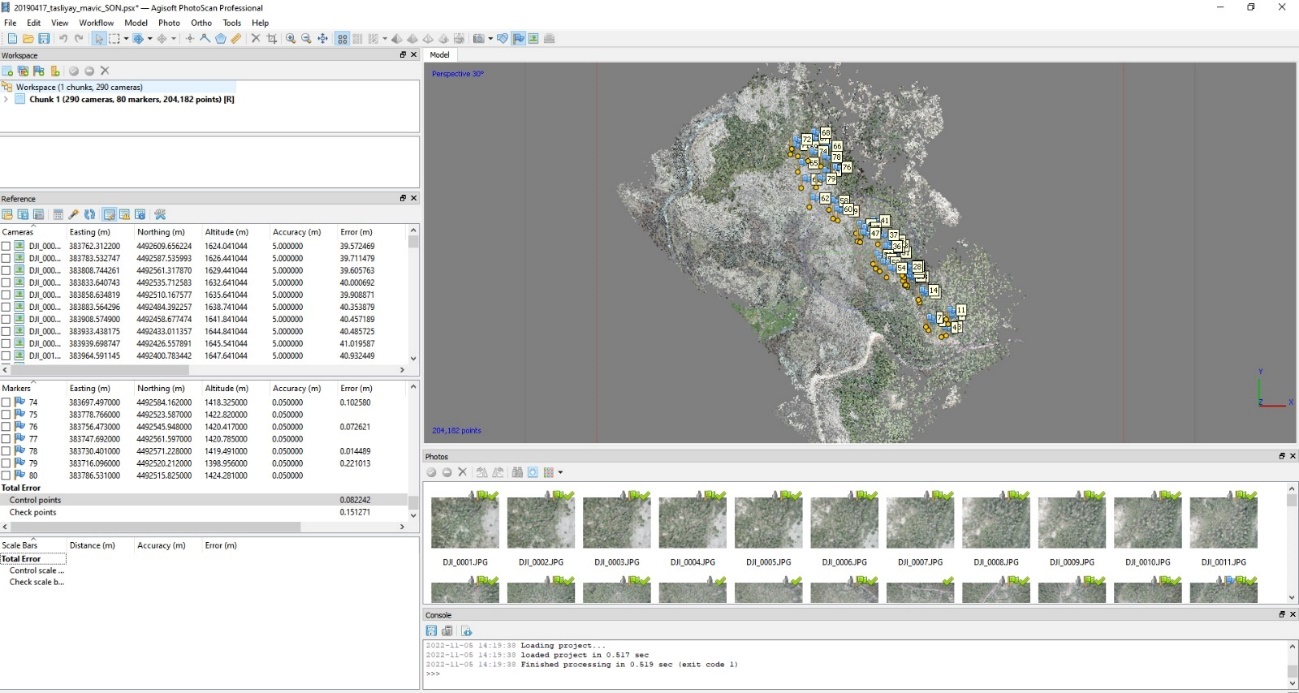
Figure 3. Data processing in Agisoft Photscan Professional version 1.5.2 software
Slika 3. Obrada podataka u softveru Agisoft Photoscan Professional, verzija 1.5.2
Since the first flight was flown by GNSS, the GCPs were defined, whereas in the second flight the GCPs were only used as control points to ensure the georeferencing error of the model. The outputs of the photogrammetric analysis of the images were dense point cloud data in LAS format, and DEMs and orthophotos in TIFF format. Then, all DEMs and orthophotos were reduced to the same size by using vector data representing the study area in SHP format to ensure spatial consistency in the analyses. In addition, since there is forest cover outside the road construction area, the DEMs and orthophotos were produced without vegetation cover by performing ground classification (Classify Ground Point) in Agisoft software after the dense cloud generation stage in order to calculate the material volume more accurately (Figure 4).
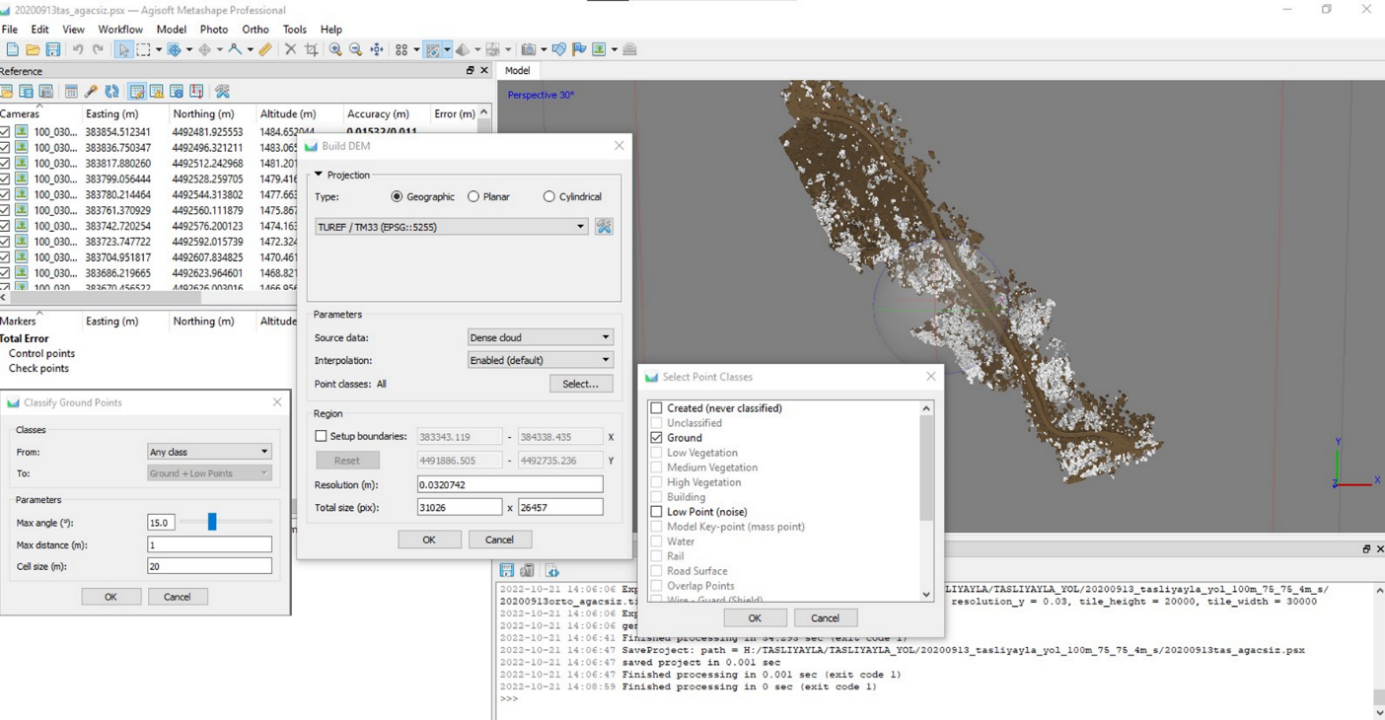
Figure 4. Ground classification in Agisoft Photscan Professional version 1.5.2 software
Slika 4. Klasifikacija tla u softveru Agisoft Photoscan Professional, verzija 1.5.2
Determination of geometric properties of the road -- Određivanje geometrijskih svojstava ceste
After the construction of the road examined in the study was completed, measurements were made related to the geometric properties of the road. These include: longitudinal slope of the road, road width, and width, height and slope of the cut slope. In addition, land classes were also observed and the determined classification was noted in %. Measurements and observations were made at 20 m intervals on the road cross section. The obtained data were recorded in the field report prepared in advance. Clinometer, laser meter and lath were used in the measurements related to the road. The other method used to determine land classes was performed on the Google Earth Engine platform (Figure 5) using JavaScript coding language. The orthophoto image produced from the second flight data was utilised on the platform.
The Google Earth Engine platform offers the possibility to obtain satellite images more easily (Xiong et al., 2017). In addition, it allows the data to be processed in the cloud base and allows easier data to be obtained from high-capacity images on the petabyte scale. In addition, it allows the use of JavaScript and Python coding languages (Agapiou, 2017). The interface of the platform has areas where work files are kept and processed and the result files are stored, and it works in connection with the platform where the result files are stored (Tamiminia et al., 2020).
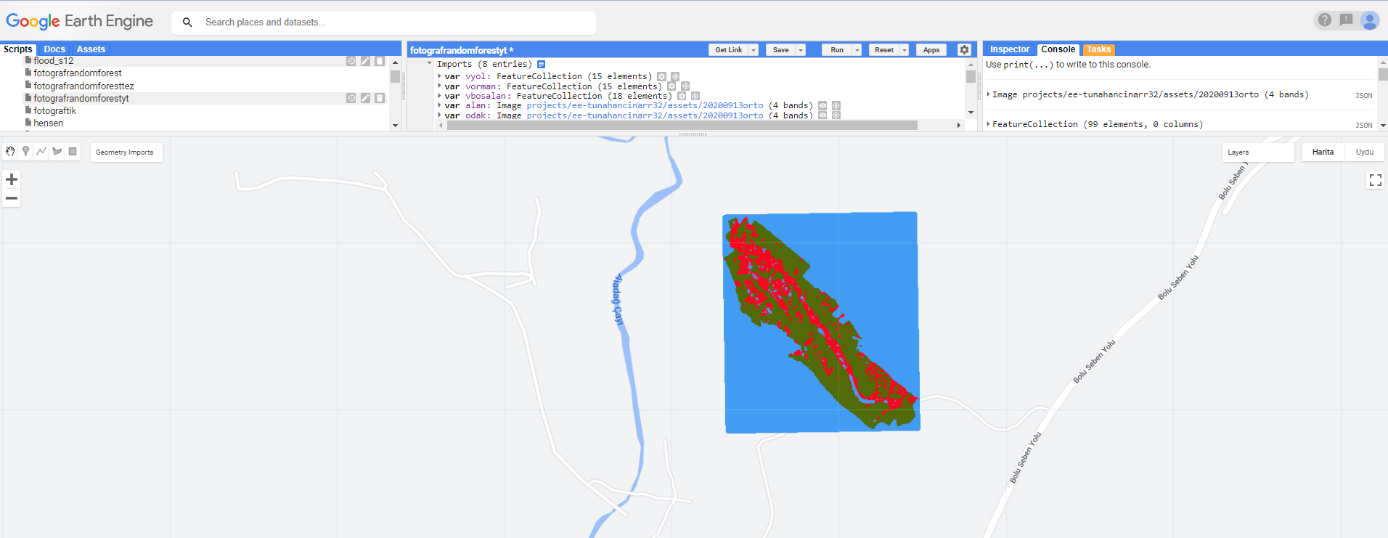
Figure 5. Google Earth Engine platform interface
Slika 5. Sučelje platforme Google Earth Engine
The obtained image was classified with random forest (RF). RF is the most preferred method in decision trees in general. It is also highly preferred in remote sensing and is widely used in pixel-based classification in forested areas (Breiman 1999; Breiman 1996). The RF algorithm is based on the Gini index. The Gini index measures the purity of an attribute with respect to classes, and for a given training set T, a random selection of pixels is said to belong to class and . The Gini index was formulated as follows:
(1)
In the formula, is the probability that the selected states belong to , while , which is a different case shown in the formula, shows the probability of belonging to . Due to this situation, each different situation selected is subjected to different classes within itself (Breiman et al., 1984; Pal, 2005).
In the accuracy assessment phase, kappa analysis was used. Kappa analysis is among the most widely used techniques for accuracy assessment (Foody, 2020). Kappa analysis gives the kappa ( estimate, which is a measure of agreement and accuracy, and is applied at the stage of obtaining accuracy information about the analysis (Congalton, 1991; Rwanga and Ndambuki, 2017). The formula applied in the kappa analysis was as follows:
(2)
In the formula, is defined as the proportion of two observed matches or total accuracy, while is defined as the probability of this match occurring randomly, i.e., of random accuracy (Gwet, 2001; Sim and Wright, 2005; Gwet, 2010).
Determination of cut volume -- Određivanje volumena usjeka
Determination of cut volumes from UAV data - Određivanje volumena usjeka pomoću podataka UAV-a
In the study, the DEM differences method was used to determine the cut volume. In this process, the DEM is applied by subtracting the value of each pixel (in the DEM, this value is the height above sea level) that constitutes the DEM data produced in raster format from the value of the overlapping pixel in the other DEM in the time series. DEM differences were subtracted from the second flight based on the first flight data (Figure 6).
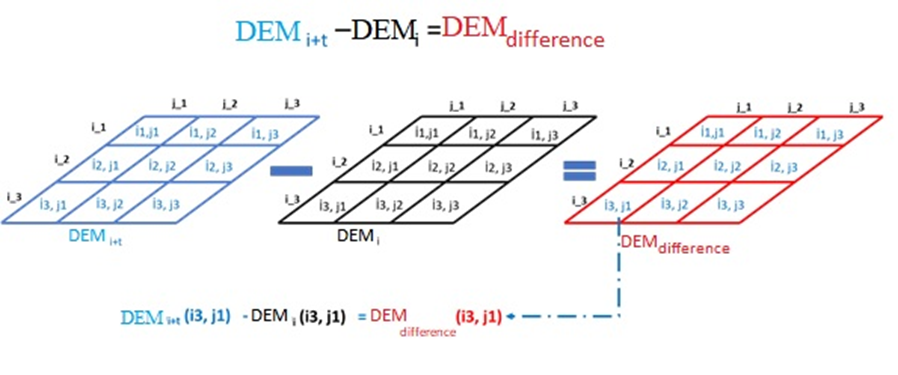
Figure 6. DEM difference data generation
Slika 6. Generiranje DEM podataka razlike
The boundaries of the study area were cut and subtracted from the generated DEM difference data. Then, the volume and area of the cut was determined. For the determination of volume and area, a plug-in in the form of a toolbox was designed within the ArcMap module of ArcGIS software with Python programming language (Türk et al., 2022).
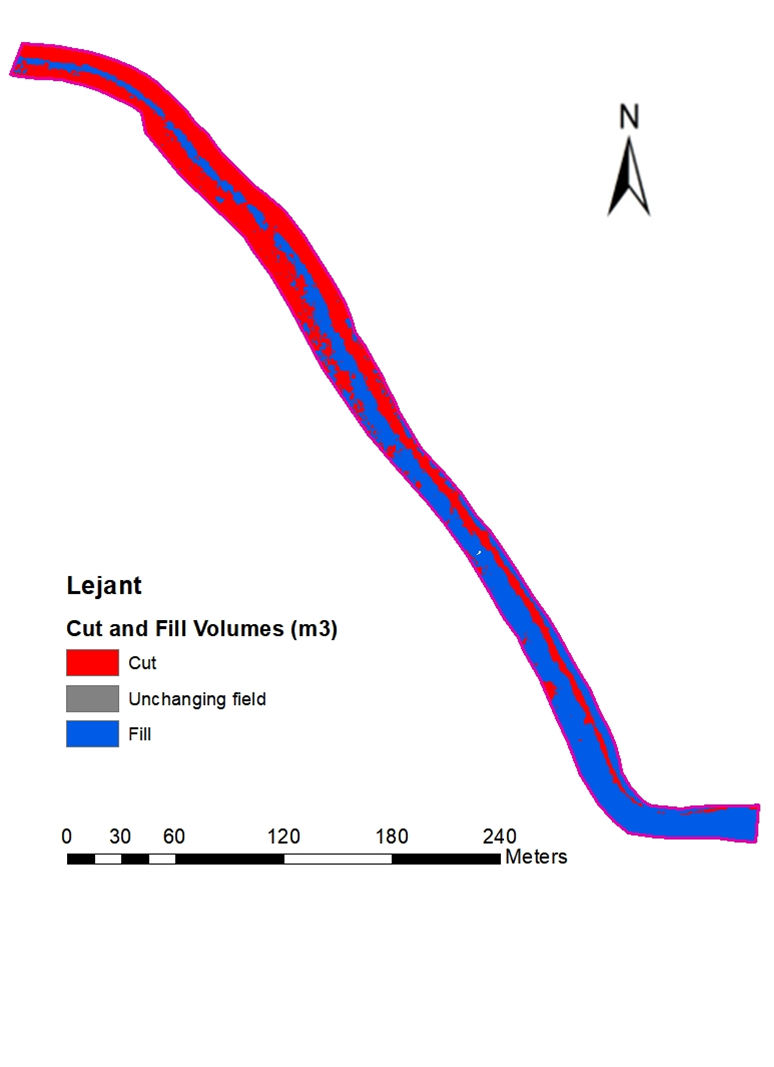
From the generated algorithm difference data, the accumulated volume and area were calculated for all pixels with positive difference values and the eroded volume and area were calculated for all pixels with negative values (Figure 7-a). The algorithm saved the volume and area information as a text file (.txt extension) defined as workspace. In the text file, the lower (0.93 m) and upper limit (2.75 m) values were determined according to the cut slope heights (Figure 7-b). In addition, areal and volumetric maps were created by classifying the cut and fill of the road separately with ArcGIS software. The orthophoto image produced from the flight data after the road construction was completed and used to determine the land classes.
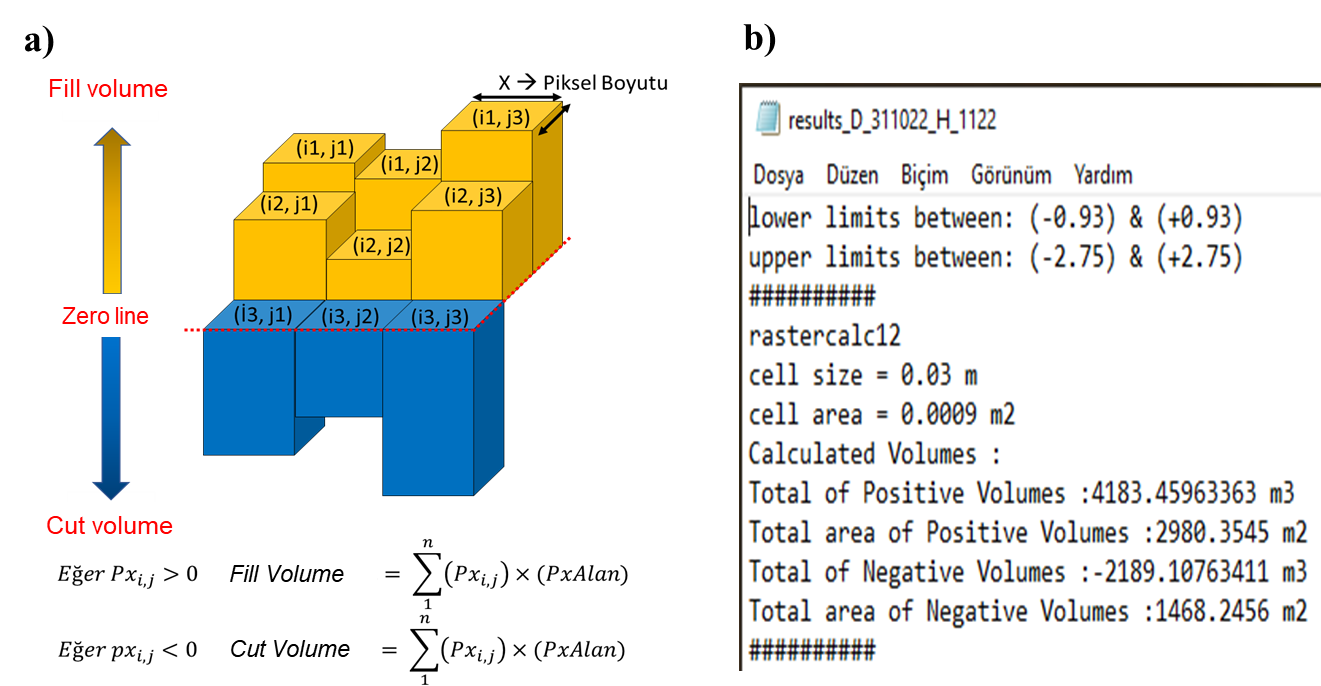
Figure 7. Analyses for the determination of cut and fill volume: a) Obtaining cut and fill volumes and areas from DEM difference data, b) Text file of toolbox output
Slika 7. Analize za određivanje volumena usjeka i nasipa: a) Dobivanje volumena i površina usjeka i nasipa iz DEM podataka razlike, b) Tekstualna datoteka s izlaznim podacima
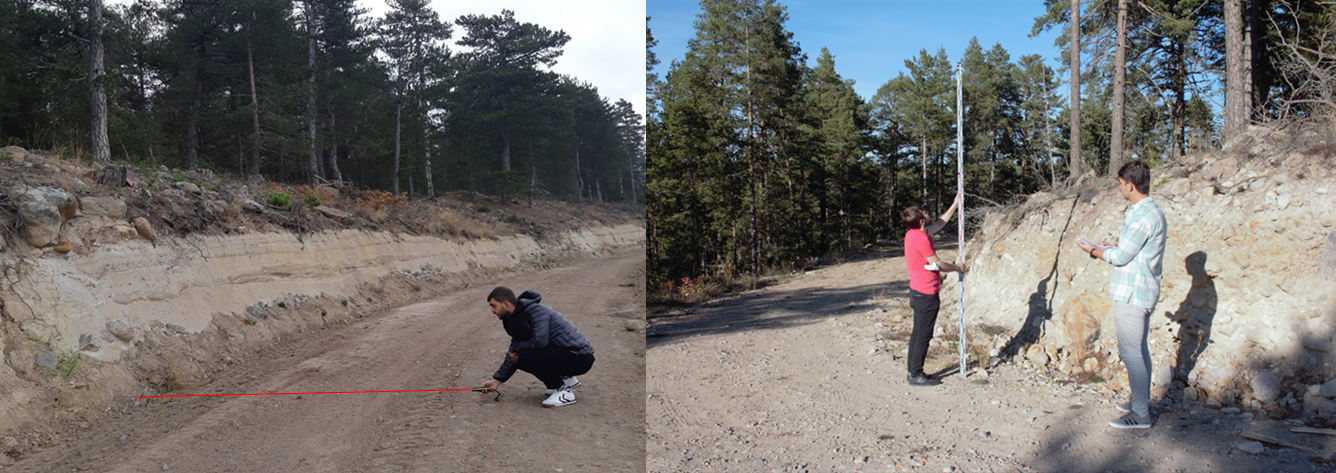
Determination of cut volume from field measurements- Određivanje volumena usjeka pomoću terenskih mjerenja
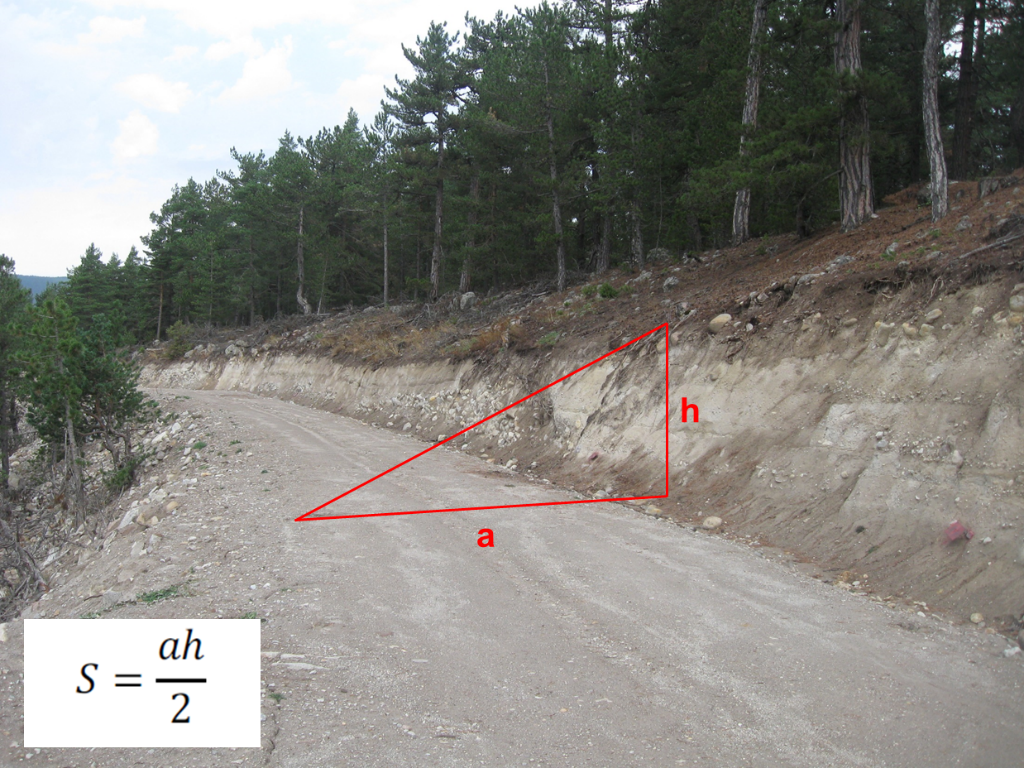
In the study, measurements were made to determine the cut, since the knowledge of the cut volume and land classifications are the most important components of the road construction cost. In the study area, profile points were marked on the road surface every 20 m from the starting point of the road. Taking into account the right triangle calculation, at the marked profile points, the cut width of the road (a) was measured with a laser meter and the cut slope height (h) was measured with a lath (Figure 8). While determining the cut width, the part of the road remaining in the cut, in other words, the part where the cut ends and the fill begins, was taken into consideration. In line with the obtained data, the areas of each profile were found by using the triangular area calculation (Figure 9). Then, the average area of the two profiles was multiplied by the intermediate distance (20 m) to calculate the volume between the two profiles. In addition, the average ditch volume between each profile (0.18 m2*20=3.6 m3) was added to this amount calculated in accordance with the Communiqué No. 292 of the General Directorate of Forestry of Türkiye.
Rezultati i diskusija
Findings on forest road characteristics and digital elevation modelling -- Rezultati karakteristika šumskih cesta i digitalnog modeliranja elevacije
Findings related to some geometrical properties of the road examined in the study are given in Table 1. When Table 1 is considered; the longitudinal slope of the road, which also has a negative slope, was measured as 2.19% on average, while maximum slope was 8.15%, minimum slope -0.2% and the road width 5.23 m on average. The average length of the cut slope was 3.53 m, the average height was 1.70 m and the gradient was 67%. Apart from these, soil classes were also observed and it was determined that approximately 48% of the road consisted of soil and 52% of the road consisted of loose soil. Figure 10 shows the land classes in the orthophoto and field images of the forest road examined in the study. In order to obtain more accurate results in the determination of soil classes, JavaScript coding language was used on the Google Earth Engine platform by utilising the orthophoto image. According to these results, 46% of the cut slope was determined as soil (0.04591 ha) and 54% as loose soil (0.05482 ha). The results are in close agreement with the field observations. In addition, the vegetation on the slope was determined as 0.002 ha in the classification. In the accuracy assessment phase of the classification, the overall accuracy coefficient was 89.09 and the kappa coefficient was 0.86. The agreement power of the values is very high (0.81-1.00). Figure 11 shows the land classes map.
Table 1. Findings related to some geometrical properties of the road and land classes
Tablica 1. Rezultati vezani uz određena geometrijska svojstva cesta i klasa zemljišta
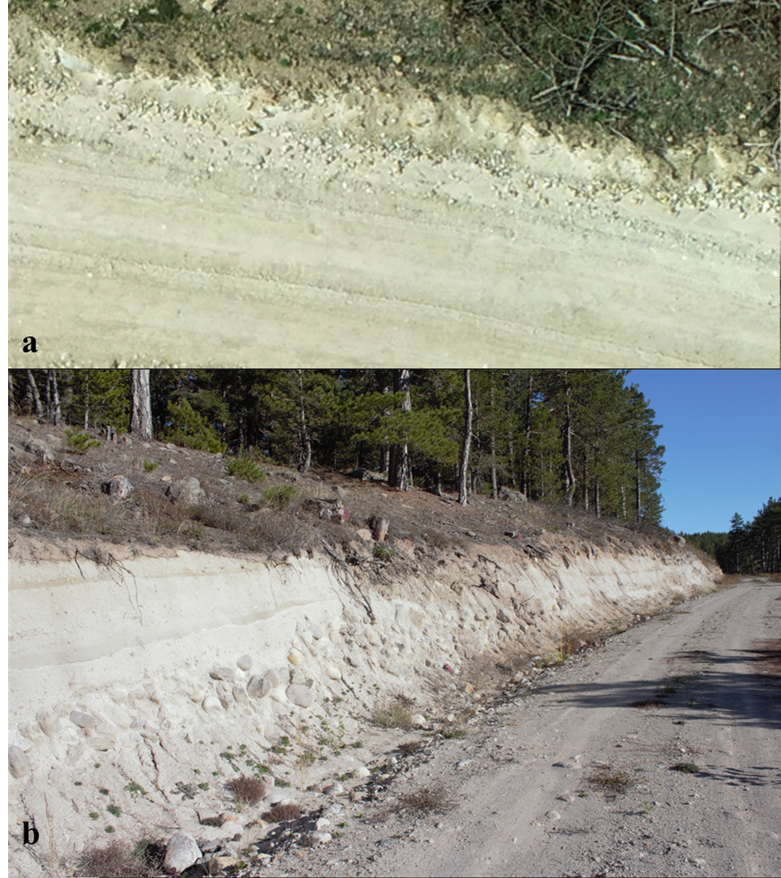
Figure 10. Land class status of the study area in orthophoto (a) and in the field (b)
Slika 10. Status klase zemljišta na području istraživanja na ortofoto snimku (a) i na terenu (b)
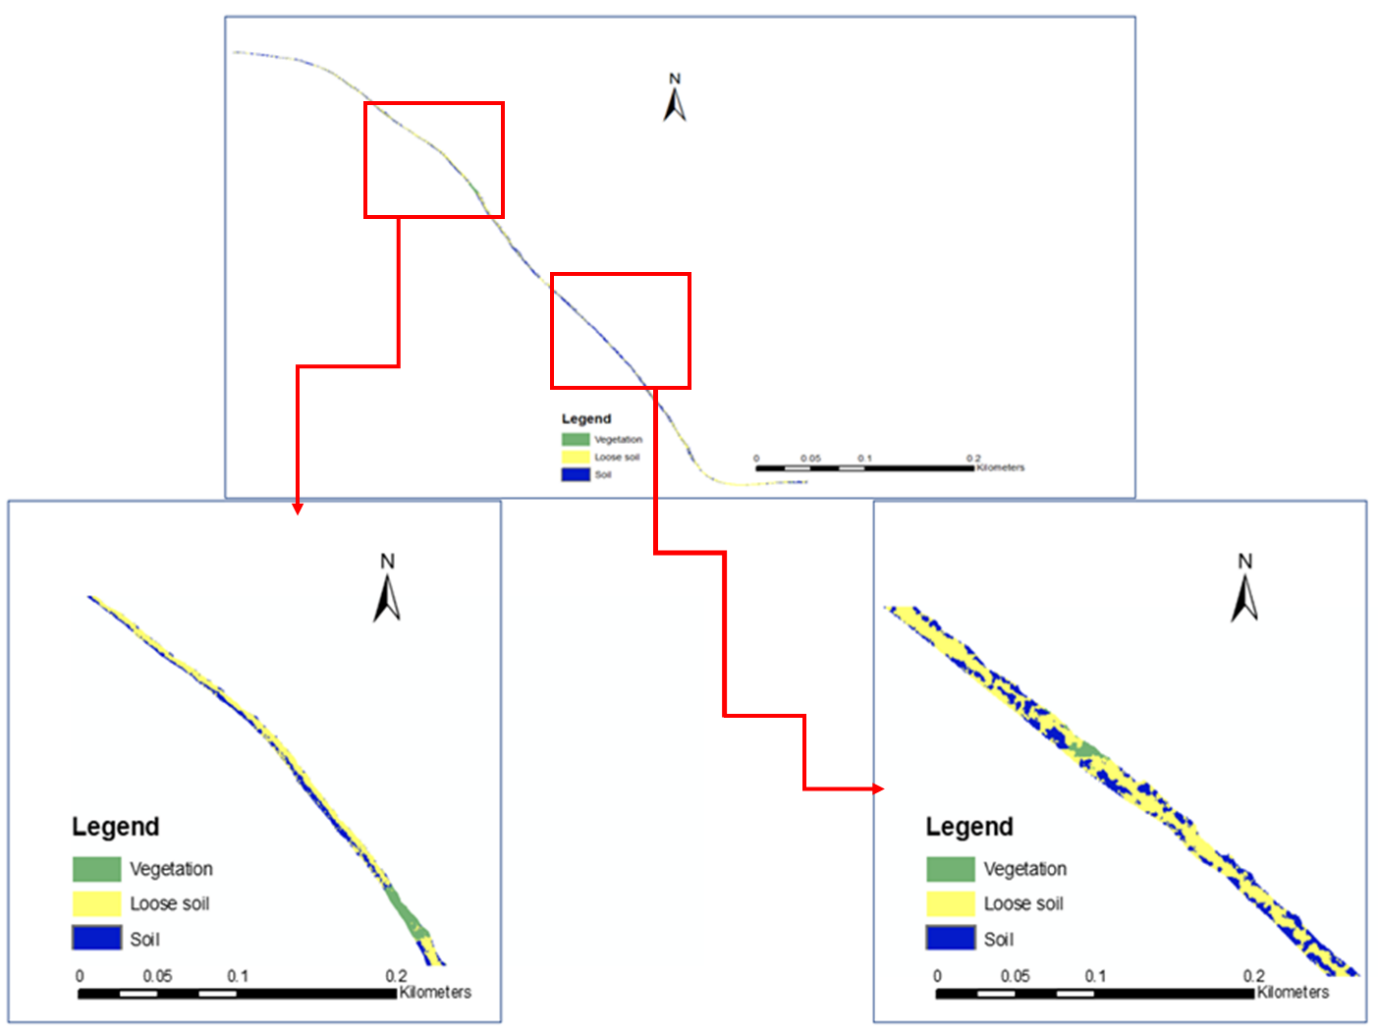
Figure 11. Map of land classes
Slika 11. Karta klasa zemljišta
The images obtained from the flights in the study area were geo-referenced and a point cloud was created with the SfM algorithm. Then, the DEMs and orthophotos of the road were produced (Figure 12 and Figure 13). According to the first flight results, the DEMs and orthophotos were obtained with 10 cm and 5 cm resolution, respectively. According to the results of the second flight, the DEMs and orthophotos were produced with 3 cm and 1.5 cm resolution, respectively. At the beginning and end points of the road before the forest road was constructed, the lowest land elevation was 1417 m and the highest land elevation was 1428 m in the DEM. After the forest road was constructed, the lowest land elevation was found to be 1417 m and the highest land elevation was found to be 1431 m in the DEM.
In order to determine the image accuracy, the error rates of the UAV time series GCP Z differences were also investigated in the study. For this purpose, the Z values of the GCP points that were fixed in nature (tree roots, rocks, etc.) were utilised. The amount of error in the DEMs produced using UAVs was analysed by examining the differences between the fixed points of the GCPs. As a result of the analysis, the average error of the DEMs was found to be 3 cm.
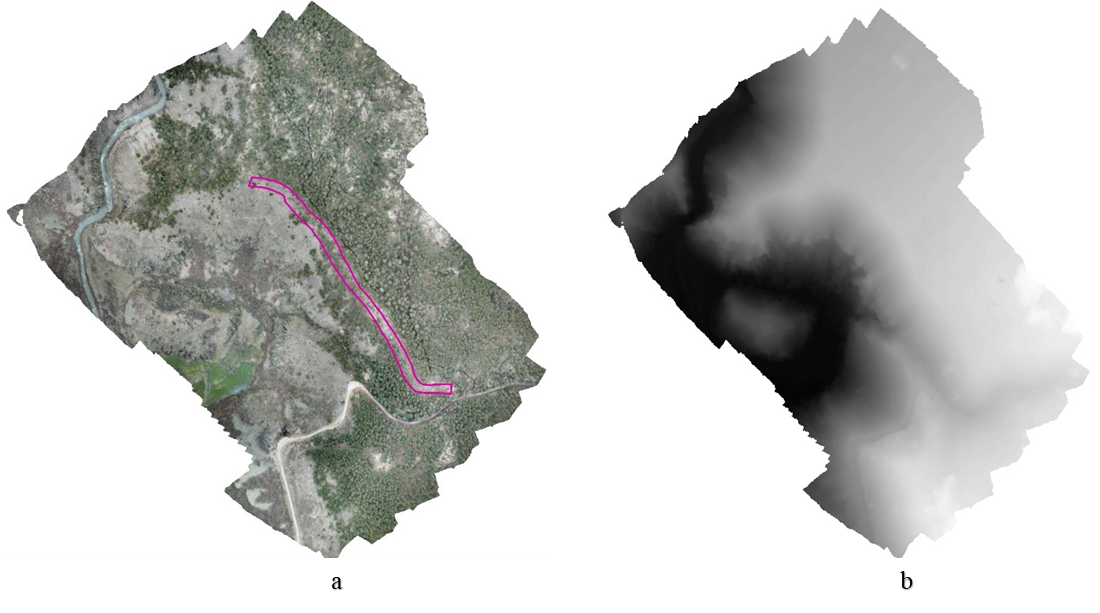
Figure 12. Orthophoto (a) and DEM data (b) of the study area before the road was constructed
Slika 12. Ortofoto (a) i DEM podaci (b) područja istraživanja prije izgradnje ceste
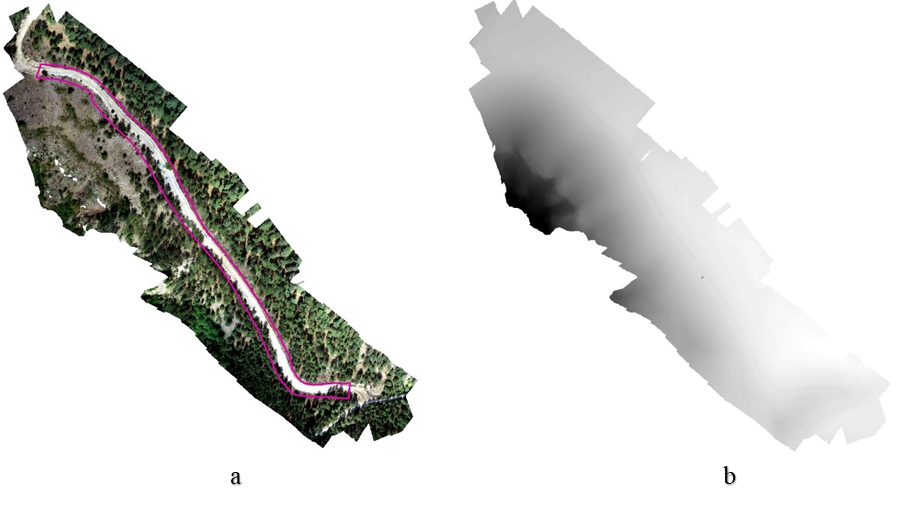
Figure 13. Orthophoto (a) and DEM data (b) of the study area after road construction
Slika 13. Ortofoto (a) i DEM podaci (b) područja istraživanja nakon izgradnje ceste
Findings related to cut volumes -- Rezultati vezani uz volumene usjeka
Findings on volumes obtained from UAV data - Rezultati volumena dobiveni pomoću podataka UAV-a
According to the results obtained from the UAV data in the study; 2189 m³ cut and the cut area were calculated as 1468 m² (Figure 14).
There are limited studies on the determination of cut volume with UAV (Akgül et al., 2017; Anurogo et al., 2017). Gülci and Kılınç (2018) evaluated soil pile volume measurements with UAV, and as a result of the study, a 38.56 m³ volume was found, while the difference between total station measurement was 1.94 m³. Generally, there are studies on the deformation of forest roads using UAV and terrestrial photogrammetry in the literature. This and other studies have shown that UAVs can play an important role in volume calculations on forest roads. In addition, land classes, which are important in determining the progress payment costs, were easily determined with UAV data in this study.
Findings on volumes obtained from field measurements - Rezultati volumena dobiveni terenskim mjerenjima
According to the results of the field measurements, the average profile area of the road was 3.23 m2 and the total cut volume was 2080 m3, of which 996 m3 was soil and 1084 m3 was loose soil (Table 2).
Table 2. Findings related to excavation area and volume
Tablica 2. Rezultati vezani uz površinu i volumen iskopa
Rezultati usporedbe podataka o volumenu usjeka
When the cut volume data after the forest road construction were compared, the cut volume calculated from the UAV flight data was found to be 2189 m³ and the cut volume calculated from the field measurements was found to be 2080 m³. It was determined that there was a difference of 110 m³ between the amount calculated as a result of the flights performed by UAV and the amount calculated by using field measurement data. The UAV results were about 5% higher than the field measurement results. It is estimated that this difference is small enough to be insignificant in forest road volumetric studies and that the reason for this difference may be human errors in field measurements.
ZAKLJUČCI
In this study, the amount of forest road cut and land classes, which are important in determining unit prices in forest road construction, were determined by UAV and field measurements, and the usability of UAV was investigated by comparing the two different methods. A total of two flights were carried out before (April 2019) and after (September 2020) the construction of the forest road examined in the study.
According to the UAV flight data and field measurement results, the total cut volume was found to be 2189 m³ by UAV and 2080 m³ by field measurement. There is a difference of +5% between the UAV data and the currently used method (field measurement). Since this difference is negligible, it validates the usability of the UAV. In addition, land classes were also easily identified from the orthophoto images produced. Google Earth Engine platform was used for the first time in the determination of forest road land classes and gave successful results. In similar studies, this platform should be used by integrating with UAV data.
Determining the amount of cut in forest road construction is time-consuming and labour-intensive in terms of land measurements. In addition, the experience of the personnel making measurements on the field is important. The results of this study show that negative experiences can be eliminated with the use of UAVs.
In this study, as an alternative to the traditional cut amount determination method, the amount of excavation in forest road construction was determined with UAV. In order to calculate the amount of cut of forest roads with UAV, the stand must be removed from the area before the road construction is started. Otherwise, it should be taken into consideration that flight difficulties and problems in image capture may occur. If it is not possible to remove the stand in the construction area before road construction, more accurate DEM data can be obtained by changing the UAV camera (LIDAR camera) even if there is forest cover.