
1. Introduction
Pestil, also known as an 'orjik', was discovered by Armenians in Malatya approximately 200 years ago. Due to its acceptable flavour, pestil has been made in various forms and under several names since then (Yavuz, 2019). According to Turkish Standards Institute, it is described as “concentration of grapes, plums, apricots and mulberries juices and pulps by the addition of edible starch, sweeteners such as sugars, and additives and dried in thin layer shape” (Bedir and Karaoğlu, 2022). Traditional pestil production is as follows; mulberry molasses (also known as şıra), obtained by compressing mulberries, is blended with honey, milk, and sugar and cooked in a vacuum pan before adding flour or starch. After that, the mixture is combined until the end result has a gel-like texture known as "herle." A day later, the pestil is removed from the cloth without tearing after the herle has been stretched out on a piece of cloth that is about 1 mm thick to dry (Baltacı et al., 2016;Levent and Yuksel, 2022).
Elasticity of pestil, which affected the formulation of herle, is important parameter for both production process and sensory characteristics. Wheat flour/starch, which is widely used in the formulation, provides elasticity to the pestilLevent and Yuksel 2022(). In case only starch is used in herle formulations,it causes the starch to retrograde and the pestil gets harder during the storage. The final result is not preferred due to its firmness and this condition results in economic losses for manufacturers. However, when the formulation involves just wheat flour, the starch rate decreases, making the final product softer(Levent and Yuksel 2022). Important characteristics of pestil, like firmness, viscoelasticity, shelf life, and water holding capacity, can all be enhanced by utilizing various types of flour.
The development of food products, quality control, sensory quality, design, and evaluation of process equipment are all impacted by rheologyGundurao et al., 2011(). Additionally, the rheological properties are crucial for food processing procedures such as coating, injection molding, spraying, extrusion, stirring, dispersing, and mixingGöksel et al., 2013(). Flour or starch is an essential component in pestil manufacturing, because they have a significant impact on the elasticity of the structure. Usually, pestil is manufactured in Gumushane city with only wheat flour incorporation in the pestil composition, whereas other pestil manufacturers located in different geographical regions prefer to use starch (Yavuz, 2019;Yuksel et al., 2020). Due to the fact that starch retrogrades during storage, a pestil formulation containing only starch may be stronger than others. However, the final product may be softer when wheat flour is substituted for starch in the pestil formulation since the starch content of the pestil product is lower than when 100% starch is used in the formulation (about 70% of wheat flour is starch). Most customers agreed that pestils made with wheat flour are softer than pestils made with starch. However, the largest problem affecting the pestil manufacturers today is how long the products will last in storage (Yavuz, 2019;Yuksel et al., 2017). More research should be conducted to address this issue.
This study, based on the problem experienced by the pestil producers, is aimed to reveal the rheological quality of pestil (herle) products obtained by using different types of flour (wheat, potato and corn flour) in the flour formulation used in the pestil production. To determine the viscous and elastic properties of pestil (herle) samples, apparent viscosity, G' (elastic modulus), G'' (viscous modulus), and tan δ (G''/G') analyses were performed.
2. Materials and methods
Materials
In this study, wheat, corn, and potato flours were utilized in the pestil manufacture to produce products with acceptable rheology. In this study, wheat, corn, and potato flours, milk, honey, sugar, mulberry molasses, and water were used to make pestil (herle). All of the components were purchased at regional markets in Gumushane city.
Pestil (Herle) production
The pestil is produced using the following formulation rates (Table 1): 70 g/100 g drinking water, 12 g/100 g flour, 9 g/100 g sugar, 1.5 g/100 g flower honey, 6.5 g/100 g milk, and 3 g/100 g mulberry molasses. Pestil manufacturing was carried out under room conditions (25±5 °C). The mixture of 70 g/100 g drinking water, 1.5 g/100 g flower honey, 9 g/100 g sugar, and 3 g/100 g mulberry molasses was cooked for 20 minutes. Then, 6.5 g/100 g milk was added to it. Afterwards, flour mixes were added in the proportions specified in Table 1 and mixed for 15 minutes. This mixture is called herle. The samples were kept in a 70±3 °C water bath throughout the rheological analysis.
Rheological analyses
Flow behaviour graphs, viscosity values, and variations in viscous and elastic properties of the samples over time were investigated. For this purpose, a parallel plate geometry (35 mm diameter, 1,000 mm gap) was used with the Anton Paar MCR 102 rheometer (Thermo Scientific, Germany). Shear stress was measured in the shear rate range of 1-100 s-1 at 70 °C in order to determine the parameters of the flow behaviour. The apparent viscosity was measured at a shear rate of 50 s-1. Frequency sweep analyses were conducted at 70 °C and in the linear viscoelastic region. The viscous and elastic characteristics of the samples were determined by obtaining frequency sweep graphs. The values of, G' (elastic modulus), G'' (viscous modulus) and tan δ (G''/G') were determined. Frequency scanning analysis was determined in the frequency range of 0.1-100 Hz, and temperature scanning was determined in the temperature ranges used in the product's processing (Göksel et al., 2013).
Statistical analysis
The results were statistically evaluated using SAS 8.0 (SAS Institute, 1999) and the Design Expert statistical package. The effect of the variables on the results was evaluated by the analysis of variance (ANOVA), and group averages were compared using multiple comparisons (p = 0.05). As a result of the 15-point study (Table 1), determined according to the experimental design prepared with the simplex lattice mixture method, the second-order polynomial equation (1) of each response variable is as follows:
The data in the equation; Y is the predicted response variable, while the wheat, corn, and potato flours (X1, X2, and X3) reflect process variables, b1, b2, b3, b12, b13 and b23 show constant coefficients.
Table1. Simplex lattice combination design developed for pestil production (g/100 g)*.
* The remaining 88 g/100 g of the 12 g/100 g mixture is made up of other components.
3. Results
The viscosity curves for each sample and rheological analysis results are displayed in Figure 1 and Table 2. In all samples, it is seen that viscosity reduces as shear rate increases. Pseudoplastic behaviour is the term used to describe systems in which viscosity reduces as shear rate increases. The apparent viscosity values at constant shear rate should be provided since the viscosity of the pseudoplastic material cannot be expressed with a single point, because it falls as the shear rate increases. At a shear rate of 50 s-1, the apparent viscosity values of herle samples, generated by various formulas, were analysed. Sample number 13 (12 g/100 g potato flour) had the highest apparent viscosity value, whereas sample formulation number 11 (12 g/100 g wheat flour) had the lowest apparent viscosity value. In general, compositions using potato flour exhibit greater apparent viscosity values. The samples that contained potato flour had the highest apparent viscosity among those made with a single type of flour, while the samples that contained wheat flour had the lowest values (Table 2).
Table 2. Apparent viscosity, elastic and viscous modulus of the samples.
*G′; elastic modulus, G′′; viscous modulus.
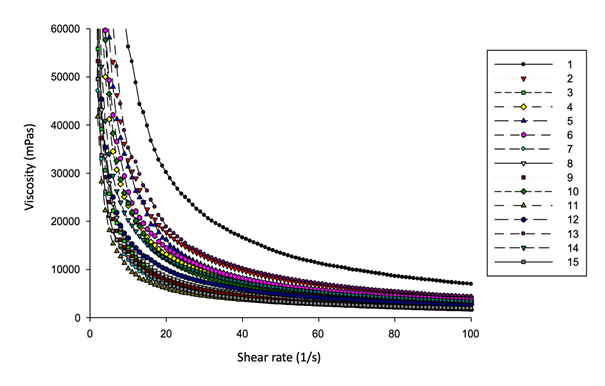
Figure 1. The flow behavior of herle samples.
The elastic (G') and viscous (G'') characteristics of herle samples were evaluated at 10 and 50 Hz frequency levels (Figure 2 and Figure 3). In every sample, the elastic modulus was greater than the viscous modulus. Furthermore, an increase in frequency value is observed to correspond with an increase in both viscous and elastic properties. Another term used to define viscoelastic modulus is tangent delta (tan δ) value, which is the ratio of viscous modulus to elastic modulus. Tan δ values were less than 1 in all samples. Tan δ levels have been found to be lower at low frequencies than at high frequencies. This demonstrates that sample viscous characteristics are lower at low frequencies than high frequencies (Figure 4). Analysis of variance (ANOVA) was used to examine the effect of the factors on all responses according to the results of the experiment. A p value of more than 0.05 indicated that an effect was not significant. Examining the ANOVA table shows that the linear data (A, B, and C) significantly (p<0.05) change the apparent viscosity, G', G'', and tan δ values. It is shown that when wheat-corn, wheat-potato, and corn-potato flours are combined, the tan δ values measured at 10 Hz changes significantly (Table 3).
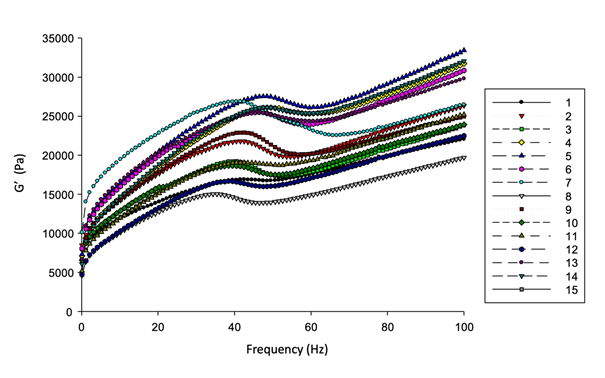
Figure 2. G’ values of herle samples versus frequency (Hz).
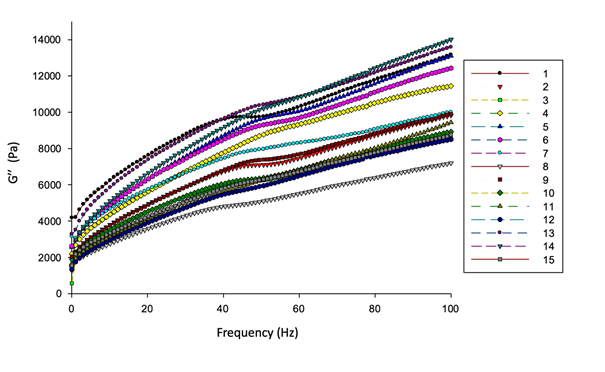
Figure 3. G'' values of herle samples versus frequency (Hz).
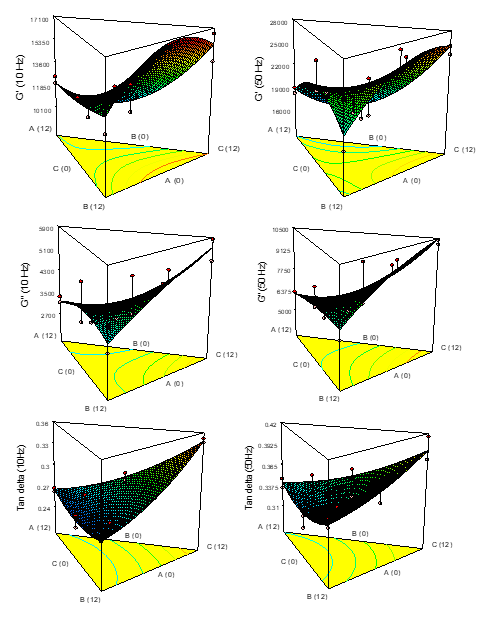
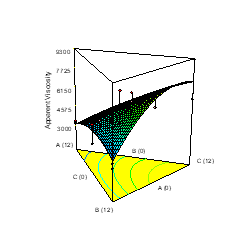
Figure 4. The G’, G’’, tan δ and apparent viscosity of different flours used herle samples (A: wheat flour, B: corn flour, C: potato flour).
Viscosity and frequency examining data were evaluated in the optimization of herle manufacture utilizing various ratios of potato, corn, and wheat flour. Regression analysis and the analysis of variance (ANOVA) were employed in the optimization design to characterize the statistical significance of model terms and analyse the fit of the model. Multiple linear regression analysis was used to generate mathematical models that expressed the link between each response and the process factors in the optimization research. In order to achieve this, each variable's linear effect terms and interaction effect terms were added to the models, and the rise in the sum of squares and model lack of fit values was examined. ANOVA findings indicated that effects with a p value larger than 0.05 among model terms were insignificant. For response surface findings, the lack of fit value of the model needs to be statistically significant (p>0.05). At 95% confidence level, each response's model deviation was insignificant (Table 3).
Table 3. The variance analysis of samples.
*A: Wheat flour. B: Corn flour. C: Potato flour. R2: Coefficient of determination. *p<0.01. **p<0.05. G’; elastic modulus, G’’; viscous modulus.
It was concluded that the linear model was appropriate after incorporating the herle samples' rheological data into the model. The range of determination coefficient values were found as a 0.64 – 0.98. The tan δ values at a frequency of 10 Hz produced the highest R2 value. For every response, the lack of fit was determined to be insignificant (p>0.05). The terms in the model are A; wheat flour, B; corn flour, C; potato flour, and AB; the combined effect of wheat flour and corn flour, AC; the combined effect of wheat flour, potato flour, and BC; the effect of corn flour and potato flour when used together.
All parameters have a positive impact on apparent viscosity values at 50 s-1 shear rate (Table 4). When the equations are analysed, it is clear that the addition of potato flour causes a significant change in apparent viscosity. Adding potato flour has a greater impact on G', G'', and tan δ values, compared to other flour types.
Figure 4 shows the apparent viscosity of herle samples based on independent variables, as well as the response surface graph and contour lines for G', G'', and tan δ values at 10 Hz and 50 Hz frequencies.
Table 4. The final equation of the rheological analysis results of the samples in terms of real values.
* A: Wheat flour. B: Corn flour. C: Potato flour. G′; elastic modulus, G′′; viscous modulus.
4. Discussion
The addition of potato flour increases apparent viscosity, G′, G′′, and tan δ values. In the pestil samples, it was found that the viscosity reduced as the shear rate increased. According to the findings of the rheological investigation, this type of flow exhibits pseudoplastic behaviour. Examining all of the data showed that the formulations incorporating potato flour generally had higher apparent viscosity values. Upon reviewing the literature, it was found that adding potato starch to the product formulation increased the product's viscosity Singh et al., 2002Xu et al., 2017(; ). According to Xu et al., (2017) when the gelatinized starch in potato granules absorbs water, it becomes extremely viscous. Additionally, a high level of macromolecular disorganization made gelatinized starches more soluble, resulting in the formation of viscous pseudoplastics. According to Singh et al., (2002) there were notable differences in the swelling power and solubility of corn starches and all potato starches. Corn starches exhibited significantly lower solubility and swelling power than potato starches, which has an impact on the viscosity of the product.
While the loss modulus (G′′) measures the energy lost or dissipated per cycle of sinusoidal deformation and indicates the viscous nature of the material, the storage dynamic modulus (G′) measures the energy stored in the material and recovered from it per cycle and represents the elastic nature (Singh et al., 2003). When the effect of the addition of corn and potato flours on elastic (G') and viscous modulus (G'') was examined, it was observed that formulations containing more corn flour had lower G′ and G′′ values. The final product's the firmness results in the similar results were found by Singh and Singh (2003), who found that corn starch had lower G' and G'' values than potato starches, making it an unfavorable product. This could be due to the fact that corn starch granules are more rigid (Singh and Singh 2003). When investigating the samples for their viscous and elastic characteristics, it was found that each sample had greater elastic characteristics. Starch content is high in flours made from wheat, corn, and potatoes. The two primary components of starch are amylopectin and amylose. These two essential components differ significantly in their properties (Yuksel et al., 2022). Amylose solutions are highly recrystallized (known as retrogradation), resulting in strong gels and films. On the other hand, amylopectin retrogrades slowly, generating weak gels and fragile coatings. Amylose levels and branched long chain distributions of amylopectin influence starch properties such as gelation, adhesion, and retrogradation. Endogenous lipids in grain starches, as well as phosphate monoesters in potato starch, have a major effect on starch's functional qualities (Yuksel and Campanella, 2018). Cereal and legume starches, including corn, wheat, rice, and peas, are known to maintain firm, increased granules and form powerful gels. On the other hand, at the same starch concentration, waxy starch, potato starch, and tapioca starch either cannot form gels at all or only very weakly can. These starches have an ability to expand and spread easily after heating, due to the lack of endogenous amylose. Potato starch is the most viscous and has the lowest pasting temperature of all the natural starches. This is due to the pushing force between phosphate monoester groups and large granule sizes (Ai and Jane, 2018). Potato and cassava starches need lower pasting temperatures than cereal starches. Due to the highly negatively charged phosphate groups in potato starch, viscosity formation begins at lower temperatures. The viscosity of potato starch is incredibly high. Cereal starches have a low viscosity because of their poor swelling properties (Waterschoot et al., 2015;Gandhi et al., 2021). This literature review provides the insight into the effects of potato flours on the pestil sample viscosity results. The structural changes in the pestil samples attributed to the addition of potato flours can be explained by potato structure components.
Tan δ values of different formulations were changed between 0.24±0.01 and 0.42±0.01 (at 10 Hz and 50 Hz). Foods act more solid-like than liquid-like, as shown by the tan δ is less than 1 (Crockett et al., 2011). It is observed that higher tan δ is present in formulations containing higher potato flour ratio. It indicates that the elastic properties prevailed over the viscous properties. According to Xu et al., (2017), potato granules exhibit more solid-like activity than liquid-like behaviour. Under the conditions of a high temperature system, gelatinization happened on potato starch granules and when rehydrated, these gelatinized starches can form a paste and exhibit gum-like properties (Xu et al., 2017).
5. Conclusion
In this study, herle was made with potato and maize flour instead of wheat flour along with wheat flour. It is observed that viscosity decreases with increasing shear rate in all samples and this type of behaviour is pseudoplastic behaviour. A more viscous herle sample was found to develop as a result of the increased amount of potato flour. Rheological characteristics of corn flour were similar to those of wheat flour. As a result, this study showed that producing pestil with wheat and maize flours, which have comparable rheological properties instead of potato flour, will result in softer and more consumer-preferred pestil.
Author Contributions: Ferhat Yuksel, Conceptualization and writing the initial Draft, Review & Editing, Investigation, Visualization and Project administration, Methodology and Investigation. Busra Yavuz, Methodology and Investigation. Merve Tuğçe Tunç, Review & Editing, Data Curation, Validation, Methodology and Investigation.
Funding: This work was funded by the Research Project Unit of Gumushane University (Project Code: 18. F5115.02.01)
Conflicts of Interest: The authors declare no conflict of interest.