
INTRODUCTION
Chamomile (Matricaria recutita L., Asteraceae) is one of the most widely used medicinal plants in the world. Its dried flower heads have traditionally been used for centuries to treat a variety of ailments, including skin and mucous inflammatory and infectious conditions, gastrointestinal complaints, and neurological disorders (1–3). Modern studies have confirmed the broad spectrum of its pharmacological activities, including anti-inflammatory, antimicrobial, antioxidant, antispasmodic, antiulcer, antidiabetic, anti-anxiety, and metabolism-regulating effects (3, 4). Due to its therapeutic potential, the European Medicines Agency endorses the herbal drug Matricariae flos for oral treatment of mild gastrointestinal complaints, inhalation for cold symptoms, and topical application for mild skin and mucous membrane inflammations, ulcers, and irritations, including in the genital and anal areas (5).
The therapeutic effects of chamomile flowers are largely attributed to their essential oil, which is rich in sesquiterpenes such as bisabolol and its oxides A and B, bisabolone oxide A, chamazulene, and β-farnesene. In addition, the flower heads contain various classes of polyphenols, including flavonoids, phenolic acids, and coumarins (6, 7). The concentration of these bioactive constituents is a crucial quality parameter that directly determines the efficacy of the herbal drug and related phytotherapeutics. However, previous studies have shown that the phytochemical composition of chamomile flowers varies considerably and is influenced by various factors such as genetic diversity (8), geographical origin (9), environmental and cultivation conditions (8, 10–12), harvest time (13), post-harvest processing (14, 15), and isolation methods (16). Standardised plant material with defined levels of active compounds is therefore essential to ensure consistent quality, safety, and therapeutic efficacy. To this end, the European Pharmacopoeia prescribes a minimum content of 4 mL essential oil per kilogram of dried flowers and 0.25 % apigenin-7-glucoside (A7G) (17). However, these specifications only apply to herbal medicinal products and galenic preparations, whereas chamomile sold in the EU as a food or food supplement is subject to food law, which focuses on safety and labelling rather than pharmaceutical quality. In the absence of strict quality standards, products with inconsistent or inferior phytochemical profiles may be in circulation, raising concerns about their authenticity and therapeutic reliability. Meanwhile, the growing global demand for herbal products has increased the popularity of herbal teas, one of the most accessible and widely used forms in phytotherapy, with chamomile dominating this segment (18). Both chamomile loose tea and tea bags are available through various distribution channels, including pharmacies, supermarkets, drugstores, and health food stores, with tea bags predominating for convenience and further questioning consistency and efficacy.
Phytochemical analysis plays a crucial role in assessing and improving the quality of herbal products, supporting the development of quality standards, and raising awareness of quality issues in the herbal market (19). However, the quality assessment of plant-based preparations remains a particular challenge due to their complex chemical profiles and inherent variability. Metabolomics and other non-targeted fingerprinting techniques provide comprehensive insights into phytochemical composition, but the resulting datasets are often very complex and difficult to interpret. Chemometric approaches address this problem by reducing the dimensionality of the data and uncovering hidden patterns (20). Principal component analysis (PCA), an unsupervised method, converts multivariate metabolite data into uncorrelated principal components (PCs) that represent the most important sources of variation and reveal clustering patterns and the variables driving them. Agglomerative hierarchical clustering (AHC) complements PCA by grouping samples into clusters based on their chemical similarity, providing a hierarchical view of their relatedness. In contrast, supervised pattern recognition algorithms are typically used to construct classification models and assign samples to predefined classes based on calibration sets of known information. Among these, partial least squares-discriminant analysis (PLS-DA) is one of the most commonly used chemometric approaches. PLS-DA condenses metabolite data into latent variables while incorporating class membership, enabling both reliable sample discrimination and identification of key features that drive this separation. This dual capability makes it particularly valuable for quality control of herbal products, where binary categorical classes, such as different pharmaceutical forms or processing methods, can critically influence chemical composition. Previous studies have shown that the integration of these statistical models into phytochemical research enhances the robustness of quality control and strengthens the scientific framework necessary to ensure the authenticity, consistency, and safety of herbal products (20, 21).
In this context, the present work aimed to provide a chemometrically-supported quality assessment of commercially available chamomile teas based on the analysis of essential oil and flavonoid constituents. To our knowledge, this is the first comprehensive phytochemical profiling of the two main classes of chamomile flowers, covering both loose and tea bag forms, and providing new insights into their quality and therapeutic reliability. By coupling with chemometric modelling, an objective distinction between the teas has been achieved, and key quality markers were identified, thereby advancing a more rigorous and scientifically grounded framework for chamomile quality assessment.
EXPERIMENTAL
Plant material
A total of 22 different batches of chamomile (Matricaria recutita L.) tea, consisting of chamomile flower heads (Matricariae flos) available on the Croatian market, were included to this study. The plant material comprised 11 samples of whole chamomile flower heads (loose teas, labelled CFLT1–CFLT11) and 11 samples of processed, comminuted flowers (tea bags, labelled CTB12–CTB22). The identity of the plant material was confirmed by macroscopic and microscopic analyses, following the descriptions provided in the literature (17). The voucher specimens were deposited at the Department of Pharmacognosy, Faculty of Pharmacy and Biochemistry, University of Zagreb (No. FBF-FGN-MF 1–22). The tea samples were selected on the basis of their availability through different distribution channels (pharmacies, supermarkets, health food stores, drugstores, and local markets) and their regulatory status (galenic preparations, food supplements, and foods). Detailed information, with the exception of brand names, is provided in Table SI in the Supplementary material.
Chemicals
Acetonitrile (99.9 %), HPLC grade, was from Fisher Scientific (UK). Citric acid monohydrate, 5,7-dihydroxy-4-methylcoumarin, and n-alkanes (C9–C23) were purchased from MerckKGaA (Germany). Acetic acid, aluminium chloride hexahydrate, anhydrous sodium sulphate hexamethylenetetramine, and xylene were supplied by Kemika (Croatia). Apigenin-7-O-glucoside (≥ 98 %) was obtained from Fluka (Germany). Acetone, ethanol, and methanol were supplied by Gram-Mol (Croatia). Ethyl acetate was purchased from POCH (Poland), while hydrochloric acid was sourced from Lach-Ner (Czech Republic). Ortho-phosphoric acid was obtained from BDH ProLabo (UK). Sodium hydroxide and n-hexane were supplied by Merck (Germany). Analytical grade chemicals were used for the analysis.
Determination of essential oil content
The essential oil content of the studied plant material was determined according to the official method described in Ph. Eur. (17). Thirty grams of the plant material was placed in a 1000-mL distillation flask containing 500 mL of distilled water and subjected to hydrodistillation using a Clevenger-type apparatus for 4 hours at a distillation rate of 3–4 mL min–1. The yield of essential oil was calculated on the basis of dry mass (mL kg–1) and expressed as the average of three replicates. The collected oil was dried over anhydrous sodium sulphate and stored in amber-coloured vials at 4 °C until further analysis.
Analysis of the essential oils by GC-MS
The chemical composition of the essential oil was analysed by gas chromatography-mass spectrometry (GC-MS) using an Agilent 7890B gas chromatograph coupled with an Agilent 5977A mass spectrometer (Agilent, USA). An Agilent Technology HP-5 MS (5 % phenylmethylsiloxane) fused silica capillary column (30 m × 0.25 mm i.d., film thickness 0.1 μm) was used for the separation. The analytical conditions were based on a previously published procedure (22), with slight modifications. The essential oils were diluted in hexane (1:100), and 1 µL of each sample was injected. The operating conditions were as follows: carrier gas was helium at a flow rate of 1 mL min–1, split ratio was 1:50, injector temperature was 250 °C, the mass spectrometer transfer-line, ion source, and quadrupole temperatures were 280, 230, and 150 °C, resp., ionization energy was 70 eV, mass spectral range was 40–400 amu. The oven temperature was started at 60 °C, held for 1 min, then increased to 200 °C at a rate of 3 °C min–1, and held at 200 °C for 10 min. A standard mixture of n-alkanes (C9–C₂3) was analysed under identical conditions to calculate retention indices.
The constituents of essential oil were identified by comparing the mass spectra of the detected peaks with those of the Wiley 9, NIST14, and HPCH 2205 spectral libraries, and evaluating their fragmentation patterns against literature data (23). The identification was further confirmed by calculating the Kováts retention indices (RIs) using the equation of van den Dool and Kratz (24), and comparing the results with the literature (23). Quantitative analysis of the individual essential oil compound was performed by peak area normalisation without using correction factors, and the results were expressed as relative percentages.
Determination of total flavonoid content
The total flavonoid content (TFC) of each chamomile flower sample was determined using the colourimetric aluminium chloride assay according to the reference method (17). In brief, 1.000 g of powdered plant material was mixed with 20 mL of acetone, 2 mL of 25 % hydrochloric acid, and 1 mL of 0.5 % hexamethylenetetramine solution, and then refluxed in a water bath for 30 min. The extract was filtered and re-extracted twice with 20 mL of acetone for 10 min each time. All filtrates were combined and diluted to 100.0 mL with acetone. A 20.0 mL portion of this solution was transferred to a separatory funnel and extracted three times with 15.0 mL of ethyl acetate. The combined ethyl acetate layers were washed twice with water, filtered over 10 g of anhydrous sodium sulphate, and made up to 50.0 mL. For the colourimetric measurement, 10.0 mL of this solution was mixed with 1 mL of a 2 % aluminium chloride solution (in 5 % methanolic acetic acid) and diluted to 25.0 mL with the same solvent. After thorough mixing, the mixture was allowed to stand for 30 minutes, and the absorbance was measured at 425 nm. A sample solution prepared in the same manner but without the addition of aluminium chloride solution served as a blank. The flavonoid content was calculated as a percentage of isoquercitroside according to the following formula: % = A × 1.25/m, where A is the absorbance at 425 nm, m is the mass of the analysed herbal drug (g), and the factor 1.25 accounts for sample dilution and the specific absorbance of the isoquercitrin standard.
Determination of apigenin-7-glucoside
Sample and standard solution preparations. – A total of 40 g of herbal drug or tea bag samples was powdered. Subsequently, 2.00 g of the powdered plant material was mixed with 200 mL of ethanol and heated for 15 min under reflux in a water bath. After cooling and filtering, 10 mL of freshly prepared 8.5 % sodium hydroxide solution was added to the extract, which was then heated for 1 h on a water bath under reflux. The cooled mixture was diluted with ethanol to 250.0 mL. To 50.0 mL of this solution, 0.5 g of citric acid monohydrate was added, the content was shaken in a flask for 5 min, and then filtered. An aliquot of 5.0 mL of the filtrate was diluted to 10.0 mL with a solvent mixture of A and B (25:75, V/V). The reference solution was prepared by dissolving 5.0 mg of A7G in 100.0 mL of methanol. An aliquot of 25.0 mL was diluted to 200.0 mL with the solvent mixture (A, B 25:75, V/V). Before injection, all solutions were filtered through a PTFE membrane filter with a pore size of 0.45 µm (17).
RP-HPLC-DAD analysis. – The total A7G content was determined according to the official high-performance liquid chromatography-photodiode array method (RP-HPLC-DAD) (17). Analyses were performed using an Agilent 1260 Infinity II HPLC system (Agilent) equipped with a quaternary pump (G1311B), an autosampler (G1329B), a thermostatted column compartment (G1316A), and a photodiode array detector (G4212B). Instrument control and data processing were carried out using Agilent ChemStation software. Chromatographic separation was performed on an analytical reversed-phase C18 column (Agilent Zorbax Eclipse XDB-C18, 250 × 4.6 mm, 5 μm particle size) maintained at 20 °C. The mobile phase consisted of solvent A (0.5 % phosphoric acid in water) and solvent B (0.5 % phosphoric acid in acetonitrile), using the following gradient elution program: 0–9 min, 75 % A; 9–19 min, 75–25 % A; 19–24 min, 25 % A; and 24.50–30 min re-equilibration to 75 % A. The flow rate was set to 1.0 mL min–1, and the injection volume was 20 μL. Detection was carried out at 340 nm. The percentage content of total A7G was calculated using the following formula: (%) = A1 × m2 × p × 0.625 / A2 × m1, where A1 and A2 correspond to the area of the A7G peak in the chromatogram obtained with the test solution and the reference solution, resp., m1 corresponds to the mass of the plant material analysed, m2 corresponds to the mass of the A7G standard in grams, and p corresponds to the percentage content of A7G.
Chemometric analysis
Multivariate statistical analyses were performed to explore and visualise the phytochemical variation among chamomile tea samples. Principal component analysis (PCA) was applied as an unsupervised method to reduce data dimensionality and identify natural clustering patterns. Agglomerative hierarchical clustering (AHC), using the clustering with Ward’s method and Euclidean distance, was employed to further assess sample similarities and groupings. For supervised classification, partial least squares-discriminant analysis (PLS-DA) was conducted to model the relationship between the phytochemical profiles and the sample categories (loose teas vs. tea bags), which allowed the identification of discriminant variables. All analyses were performed using XLSTAT software (Addinsoft, USA).
Data were analysed using GraphPad Prism version 10.4.2 (GraphPad Software Inc., USA) and expressed as mean ± standard deviation. Comparisons between multiple groups were performed using one-way analysis of variance (ANOVA), followed by Tukey’s post hoc test. A p-value lower than 0.05 was considered statistically significant.
RESULTS AND DISCUSSION
Essential oil from chamomile flowers: Content and chemical composition
Twenty-two chamomile samples were subjected to hydrodistillation, which yielded a characteristic, blue-coloured essential oil. The essential oil yield of whole chamomile flowers ranged from 1.83 to 5.34 mL kg–1, while the yield from comminuted flowers in tea bags was significantly lower at 0.75 to 2.15 mL kg–1 (Fig. 1). Considering the Ph. Eur. requirement of a minimum essential oil content of 4 mL kg–1, only five samples of loose tea met this standard, suggesting that most chamomile teas on the market may not contain sufficient active constituents to be therapeutically effective. Of the samples with the highest essential oil content, two were from Croatia and two were of unspecified origin. Our analysis of 11 tea bag samples revealed that the quality of the processed chamomile flower heads was unsatisfactory in terms of the essential oil content. The samples with the lowest essential oil content (CTB12–CTB17, CTB21, and CTB22) were sourced from Germany, Croatia, and Poland, and showed no statistically significant differences among each other. Overall, 17 out of 22 samples did not meet the criteria set out in the pharmacopoeial standards. These results are consistent with previous reports indicating significant variations in essential oil content and the inadequate pharmaceutical quality of many commercially available chamomile teas. For example, an analysis of 13 chamomile samples from the Estonian market showed an essential oil content of between 0.10 and 0.61 %, with only two samples exceeding the minimum pharmacopoeial value (25). Similar results were reported by Orav et al. (26), who found that 13 chamomile teas from retail pharmacies across Europe contained 0.7–6.7 mL kg–1 of essential oil, with only three samples meeting Ph. Eur. quality standards. The only previous study addressing the quality of chamomile tea bags analysed 13 samples from pharmacies and grocery stores in nine countries, and reported that 10 failed to meet pharmacopoeial essential oil standards (27).

Fig. 1. Contents of essential oil in M. recutita samples: whole flowers (chamomile flower loose teas, CFLT1–CFLT11, shown as samples 1–11) and comminuted flowers (chamomile tea bags, CTB12–CTB22, shown as samples 12–22). Data are presented as mean ± standard deviation (bars) of three replicates. Columns labelled with different letters are statistically different at p ≤ 0.05 using Tukey's multiple range test.
Our investigation of commercially available chamomile teas revealed an up to seven-fold variation in the content of essential oils. This variability can be attributed to several factors, including plant genetics, agronomic practices, time of harvest, and, in particular, post-harvest processing and storage. Drying conditions have been shown to significantly affect the colour, aroma, and chemical composition of chamomile flowers (14). Crushing the aromatic plant material during processing damages the essential oil-storing glandular trichomes, resulting in their loss (28). In addition, both the duration and conditions of storage have been shown to impact essential oils in terms of both quantity and quality (15, 29). Finally, it should be considered that chamomile filter bags may contain not only fragmented flowers but also varying amounts of leaves and stems, which naturally have a low essential oil content (16).
The above factors influence not only the content but also the chemical composition of chamomile essential oil. Given its complex nature, a comprehensive chemical fingerprint is essential for quality control and authentication. GC-MS analysis of essential oils from 22 chamomile flower samples identified up to 48 compounds, accounting for 93.86–100 % of the oils (Tables I and II). Their composition was characterised by sesquiterpenes, with oxygenated sesquiterpenes (56.10–82.15 %) being the predominant compounds, followed by sesquiterpene hydrocarbons (3.00–10.48 %). Monoterpenes were present in small amounts, up to 1.16 %. Among the other compounds identified, polyynes (spiroethers) were most prevalent, ranging from 4.79 to 18.96 %. The major constituents of all the analysed chamoile essential oils were α-bisabolol oxide A (12.31–45.66 %) and α-bisabolol oxide B (6.85–29.28 %), accompanied by considerable amounts of cis-en-yn-dicycloether (4.20–17.91 %) and α-bisabolone oxide A (5.98–11.33 %). Significant quantitative differences were found in the essential oil profiles of loose chamomile teas and tea bags, while the qualitative differences were mainly due to minor constituents. The essential oils extracted from whole chamomile flowers exhibited more uniform profiles, typically dominated by α-bisabolol oxide A (26.29–41.31 %) and α-bisabolol oxide B (13.29–27.04 %) (Table I). In contrast, the oils from tea bags exhibited greater variability, with either comparable levels of the two oxides or, in some cases, α-bisabolol oxide B as the dominant component (Table II). These patterns are confirmed by the GC-MS chromatographic fingerprints shown in the supplementary material (Figs. S1 and S2), while representative total ion current (TIC) chromatograms for each chamomile tea form are shown in Fig. 2. The chemical fingerprints provide distinct profiles of the two sample types, clearly visualising the separation and relative abundance of their volatiles. The fingerprint is particularly important for chamomile as it is often confused with morphologically similar Asteraceae species (30), which either do not contain the required active compounds or have toxic ones, jeopardising both efficacy and safety. Furthermore, the comparison between loose tea and tea bag samples highlights the influence of processing on chemical composition, with GC-MS fingerprints providing valuable insights into the retention or loss of key bioactive constituents during manufacture.
Table I. Chemical composition of essential oils from 11 whole M. recutita flower samples (chamomile flower loose teas CFLT1-CFLT11)
a Compounds are listed according to their elution from a HP-5MS column; b Linear retention index (RI) experimentally calculated using the Van den Dool and Kratz formula using a mixture of n-alkanes (C9–C23); – not detectable
Table II. Chemical composition of essential oils from 11 comminuted M. recutita flower samples (chamomile tea bags CTB11-CTB22)
a Compounds are listed according to their elution from a HP-5MS column; b Linear retention index (RI) experimentally calculated using the Van den Dool and Kratz formula using a mixture of n-alkanes (C9–C23); – not detectable

Fig. 2. Representative GC-MS total ion current (TIC) chromatograms of essential oils from: a) chamomile flower loose tea (sample CFLT1); b) chamomile tea bag (sample CTB14). The major identified compounds are: 1 – trans-β-farnesene (tR = 26.2 min), 2 – spathulenol (tR = 30.8 min), 3 – α-bisabolol oxide B (tR = 33.8 min), 4 – α-bisabolone oxide A (tR = 34.8 min), 5 – chamazulene (tR = 36.4 min), 6 – α-bisabolol oxide A (tR = 37.1 min), 7 – cis-en-yn-dicycloether (tR = 41.7 min), and 8 – palmitic acid (tR = 44.4 min). The corresponding MS spectra of these compounds are provided in the Supplementary material (Fig. S3).
According to Ph. Eur., there are two chemotypes of chamomile essential oil: one rich in bisabolol oxides (29–81 %) and another rich in α-bisabolol (10–65 %) (17). Our results showed that all 22 analysed samples belonged to the bisabolol oxide-rich chemotype, with proportions ranging from 30.06 to 67.69 %. Chamazulene content, an important marker of essential oil quality, ranged from 0.63 to 5.73 %, with only one sample below the pharmacopoeial minimum of 1 % (17). Other constituents found at levels above 2 % were spathulenol (0.83–8.66 %), trans-β‑farnesene (0.05–6.07 %), decanoic acid (0–4.52 %), and tricosane (0.13–4.14 %). The chemical profiles of the essential oil of chamomile flowers available as loose tea in Croatia were largely consistent with previous reports. For example, in a study of whole chamomile flowers obtained from pharmacies across Europe, α-bisabolol oxide A was found to be the predominant compound in 8 out of 13 samples, with levels ranging from 31.4 to 56.0 % (26). Similar results were reported for chamomile teas available in Mexico (31). An investigation of chamomile teas packaged in different countries and purchased from supermarkets and pharmacies in Estonia showed that samples from the Netherlands and Lithuania were rich in α-bisabolol oxide A (49.1 % and 55.9 %, resp.), while samples from Poland and Latvia contained higher levels of α-bisabolol oxide B (21.5–25.1 %) compared to α-bisabolol oxide A (13.4–19.8 %) (25). Chamomile flowers cultivated in Croatia have also been previously reported to produce essential oils of the bisabolol oxide chemotype (14, 32). In contrast to our results, chamomile flowers with high α-bisabolol content (23.9–44.2 %) have been found on the European market, particularly in teas from Moldova, Russia, and the Czech Republic (26). Similar chemotypes, characterised by a dominance of α-bisabolol, were also detected in plant material originating from Hungary (33), Italy (34), Slovakia (35), and Turkey (36). The chamazulene concentrations determined in our study are consistent with the values reported by Raal et al. (25), which ranged from 0.2 to 6.7 %, and fall within the broader range previously reported for commercial European chamomile teas (0.7–15.3 %) (26). The content of spiroether cis-en-yn-dicycloether also varied considerably between the chamomile teas studied, but remained within the expected range (3.6–26.1 %) reported in the literature (25, 26, 32). It is important to emphasise that quantitative differences in the chemical composition of M. recutita flowers and their essential oils can significantly influence their biological activities (37). Namely, the bisabolol oxide-rich oils have been shown to reduce pain and oedema in experimental models of inflammation (38). In addition to their anti-inflammatory and analgesic properties, bisabolol and its oxides also have antibacterial, cytoprotective, and antipruritic effects (7, 39). Chamazulene is known for its anti-inflammatory and antioxidant properties (7, 40) while the en-yn-dicycloethers (spiroethers) also contribute to the overall bioactivity of chamomile flowers (41).
The radar plot in Fig. 3 provides a comparative overview of the essential oil composition across all 22 chamomile tea samples. The simultaneous representation of the amounts of the most important volatile compounds reveals clear compositional differences between loose teas (samples CFLT1–CFLT11) and tea bags (samples CTB12–CTB22). Loose teas show more pronounced and scattered profiles, indicating greater variation and higher levels of key compounds, whereas the tea bag samples show more uniform and compressed profiles with lower levels and less variability of pharmacologically relevant constituents. Given the importance of compounds such as chamazulene and bisabolol oxides, these differences may have an impact on the therapeutic efficacy and sensory properties of the teas. Our results suggest that loose chamomile teas are more likely to meet quality criteria based on essential oil composition, while tea bag products tend to be of lower quality, likely due to processing-related losses and the inclusion of non-floral plant material. Although pharmaceutical standards specify a minimum essential oil content for chamomile flowers, they do not require extensive chemical profiling (17). However, analysing the fingerprint of herbal drugs provides a comprehensive chemical profile of the plant material, and ensures its quality, authenticity and consistency. Chemometrics can be used to extract information from the fingerprints that is useful for grouping samples according to specific traits, and correlations can be made between chemical profiles and biological activities of interest (42, 43). In this study, the radar plot emphasised the value of essential oil composition profiling as a useful addition to existing quality standards for chamomile.
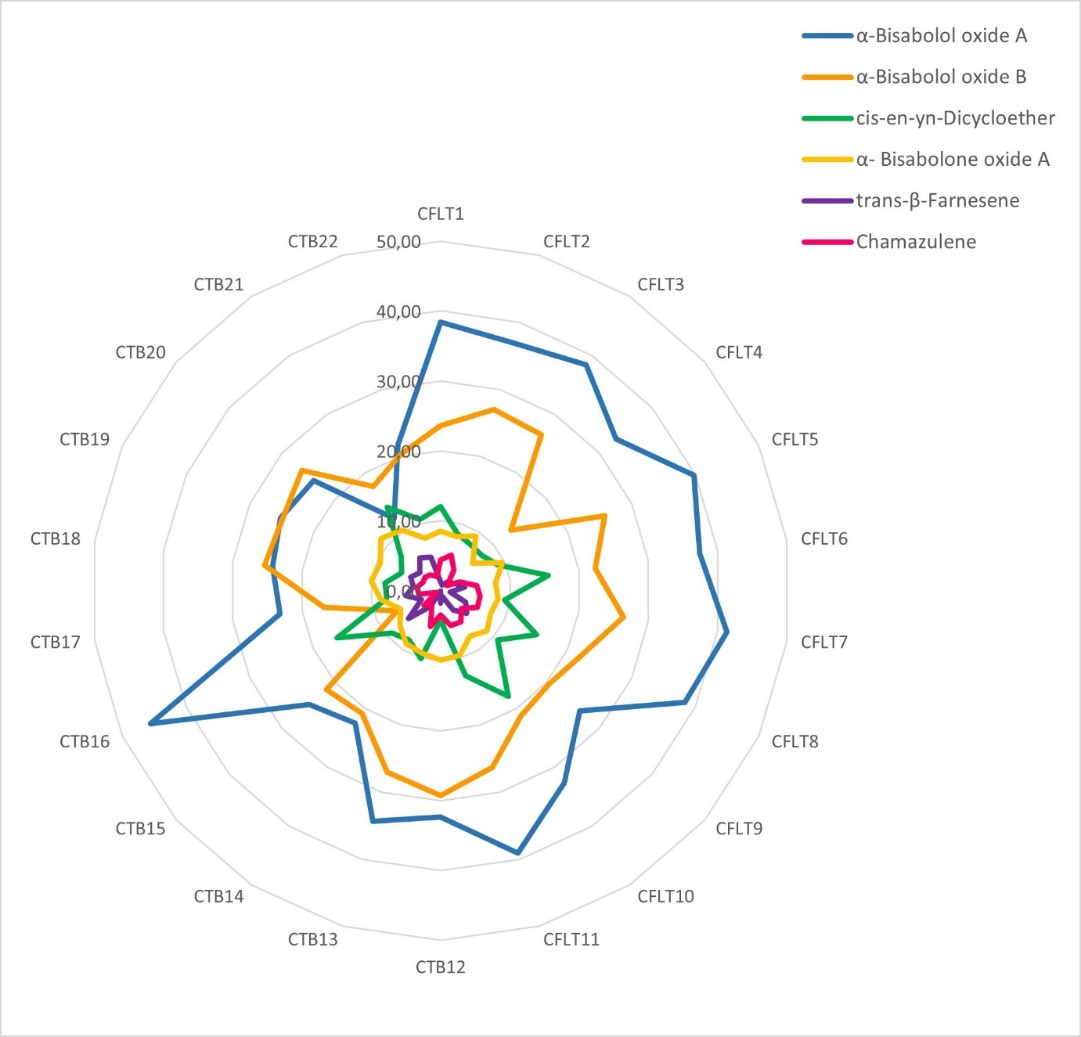
Fig. 3. Radar plots showing the differences in chamomile flower tea quality in terms of the six most abundant essential oil constituents. Sample codes CFLT1–CFLT11 correspond to chamomile loose tea samples, whereas CTB12–CTB22 denote chamomile tea bag samples.
Total flavonoid and apigenin-7-glucoside (A7G) contents in chamomile flowers
In addition to the essential oil, the flavonoids represent an important class of bioactive constituents in M. recutita. The total flavonoid content in the analysed chamomile teas, shown in Table III, was highly variable, ranging from 0.17 % (sample CTB16) to 0.55 % (sample CFLT4). The loose teas had relatively constant flavonoid levels (0.42–0.55 %), which is probably partly due to the common Croatian origin of most of the plant material. In contrast, the flavonoid content in the tea bag samples was more variable, ranging from 0.17 to 0.46 %. While four out of eleven tea bag samples had a flavonoid content comparable to that of loose tea, in most cases, the content was two to three times lower. A previous quality assessment of the five best-selling chamomile teas in Bosnia and Herzegovina reported flavonoid contents of 2.9 and 4.3 mg per g of packaged flowers (0.29–0.43 %) (44), consistent with our findings. However, higher flavonoid concentrations (up to 1.21 %) were also found in chamomile products from the market (25).
Table III. Contents of total flavonoids and apigenin-7-glucosides (A7G) in 22 samples of chamomile flower teasa
a Sample codes CFLT1–CFLT11 correspond to chamomile loose tea samples, whereas CTB12–CTB22 denote chamomile tea bag samples; b expressed as isoquercitroside equivalent. Data are presented as mean ± standard deviation of three replicates. Data labelled with different letters are statistically different at p ≤ 0.05 using Tukey's multiple range test.
Apigenin-7-glucoside (A7G) is the most abundant flavonoid in chamomile flowers and serves as an important marker for the evaluation of the quality and potency of the herbal drug (17, 30, 45). Numerous pharmacological studies have demonstrated its potent anti-inflammatory, antimicrobial, anticancer, and neuroprotective properties (7, 39, 40, 45), implying that it is primarily responsible for the therapeutic effects of chamomile. In this study, A7G was separated, identified, and quantified using the pharmacopoeial RP-HPLC-DAD method, which measures total A7G after alkaline hydrolysis of the acylated glycosides of apigenin by ammonia treatment. As shown in Table III, the analysed chamomile teas contained between 0.07 and 0.36 % of total A7G. The loose chamomile teas generally contained higher A7G amounts (0.19–0.36 %) than the tea bags, but only 4 out of 11 samples complied with the Ph. Eur. minimum requirement of ≥ 0.25 %. The majority of the chamomile tea bag samples, with the exception of one, had significantly lower A7G levels and did not meet pharmaceutical quality standards. These results are consistent with previous studies reporting significant variations in A7G levels in commercial chamomile flowers. For comparison, commercial chamomile varieties cultivated in Greece contained total apigenin derivatives between 0.26 and 0.40 % (46). Even higher A7G concentrations were found in five batches of chamomile flowers from the Brazilian market, ranging from 0.47 to 0.79 % (45). In contrast, an analysis of chamomile tea bags from Turkey using high-performance thin-layer chromatography (HPTLC) revealed A7G levels as low as 0.80 mg g–1 (0.08 %) (30). Viapiana et al. (47) developed an HPLC method for quality assessment of 19 chamomile samples based on a phenolic profile; however, apigenin derivatives were neither detected nor quantified, indicating variation in analytical targets across studies. The relatively low and variable A7G contents observed in our samples may be due to the lower occurrence of white ligulate florets, which are the main source of apigenin glucosides, in contrast to disc florets and receptacles (48). This is particularly evident in commercial teas where the flower heads are fragmented or mixed with non-floral material. Similar to the essential oil, flavonoid content and profile are also influenced by plant genetics, environmental conditions, time and method of harvest, and post-harvest processing (14, 49–51). Studies have shown that flower heads harvested at full bloom and dried under controlled conditions retain higher flavonoid content, including A7G (14, 52, 53). In addition, the storage conditions and duration (15, 29) as well as the analytical methods used for quantification may also contribute to the observed discrepancies in flavonoid content.
It is noteworthy that many of the chamomile flower samples analysed in this study did not meet pharmacopoeial standards for A7G and essential oil content, raising concerns about the consistency and overall quality of commercially available chamomile teas. Given the pharmacological importance of these constituents, such variability could compromise their therapeutic efficacy. Most herbal preparations are marketed as food or dietary supplements, for which manufacturers are generally not required to demonstrate quality, pharmacological efficacy, or safety prior to market entry. Their widespread use in self-medication practice has increased globally, largely due to the perception that such products are inherently safe and their easy accessibility outside of pharmacies, including health food stores, drugstores, and online platforms. Nevertheless, the potential presence of contaminants, adulterants, or other impurities poses a considerable safety risk. Moreover, many herbal products are advertised with misleading or exaggerated health claims, while the labelling often does not accurately reflect their true composition (54). Chamomile is generally considered safe at the usual dosage, with adverse effects typically mild and self-limiting. Rare allergic reactions, including severe manifestations such as dyspnoea and anaphylaxis, have been reported following mucosal exposure, particularly in individuals sensitised to ragweed pollen or other Asteraceae species (2, 5, 55). Cutaneous sensitisation is attributed to allergenic sesquiterpene lactones, which can induce contact dermatitis in susceptible individuals (2, 55). Although the incidence of clinically relevant hypersensitivity reactions to chamomile tea preparations is considered to be low, variations in the quality of the raw material, processing, and storage conditions may influence the level of allergenic compounds and thus the potential risk (53).
Chemometric analysis by PCA, AHC, and PLS-DA
The use of modern analytical techniques in combination with chemometric methods, such as PCA, AHC, and LPS-DA, demonstrates that chemometrics is a powerful and useful tool for evaluating the quality and authenticity of medicinal plants (20, 21, 40). In the present study, the contents of pharmacologically important essential oils and flavonoid constituents were utilised as phytochemical descriptors to assess chemical variability and discriminate between chamomile tea samples. The PCA results are shown in Fig. 4: the score plot (Fig. 4a) illustrates the distribution and clustering of the samples, while the loading plot (Fig. 4b) reveals the variables contributing most to their differentiation. According to the Kaiser criterion (eigenvalues > 1), two principal components (PC) were retained, together accounting for 64.06 % of the total variance. PC1 explained 38.46 %, and PC2 explained 25.60 %, effectively capturing the primary sources of variation and differentiation among the chamomile samples. The PCA score plot (Fig. 4a) showed a clear separation between loose tea samples (CFLT1–CFLT11) and tea bag samples (CTB12–CTB22) along PC1, indicating significant chemical differentiation between the two groups. The loose tea samples were located in the positive PC1 region, while the tea bags were distributed along the negative axis, suggesting that PC1 effectively discriminates the chamomile tea types based on their compositional data. The corresponding loading plot (Fig. 4b) indicated that PC1 was strongly influenced by variables with very high loadings, particularly total flavonoid content, essential oil content, and α-bisabolol oxide A (loading values: 0.757–0.870). Chamazulene and A7G also had a significant influence, with loading values of 0.663 and 0.613, resp. These variables contributed most to the sample differentiation, likely due to their higher concentrations in loose chamomile teas. In particular, compounds such as α-bisabolol oxides and chamazulene were more abundant in loose teas, while tea bag samples generally contained lower amounts of essential oils and flavonoids. The PCA-based chemometric evaluation of the complex phytochemical data confirmed that Ph. Eur. parameters such as essential oil content and A7G significantly influence the quality of chamomile, but also indicate that the other characteristics, such as the contents of the individual essential oil constituents and total flavonoids, also play an important role.

Fig. 4. Chemometric analysis using principal component analysis (PCA) and agglomerative hierarchical clustering (AHC) of commercial chamomile flower samples, including loose tea samples (CFLT1–CFLT11) and tea bag samples (CTB12–CTB22): a) PCA score plot (PC1 vs. PC2), showing distinct separation between loose and tea bag samples based on their phytochemical composition; b) PCA loading plot indicating major phytochemical variables (e.g., flavonoids, essential oil constituents) contributing to sample discrimination along the PCs; c) dendrogram generated by AHC using squared Euclidean distance and complete linkage, confirming the PCA-based grouping and revealing two main clusters corresponding to the chamomile tea forms: Cluster C1 (blue), predominantly comprising loose tea samples, and Cluster C2 (red), mainly consisting of tea bag samples.
Further classification was achieved by AHC analysis, which yielded a dendrogram (Fig. 4c) illustrating the hierarchical clustering of chamomile tea samples based on compositional dissimilarity. The dendrogram confirms the similarities and differences between the samples previously identified by PCA, and reveals two statistically distinct clusters: cluster C1, which consisted predominantly of loose tea samples, and cluster C2, primarily composed of tea bag samples. Cluster C1 exhibited lower intra-cluster dissimilarity, indicating a tighter grouping and a more homogeneous phytochemical profile. In contrast, cluster C2 showed greater heterogeneity and a wider dispersion, probably due to differences in raw material quality or manufacturing processes. Notably, the two clusters merged only at a relatively high dissimilarity level (~47), underscoring the clear differences in the composition of the two studied chamomile tea forms. The AHC not only revealed the major groupings but also indicated potential outliers. In particular, two samples of loose tea were clustered with tea bags (CFLT4 and CFLT9), while one sample of tea bags was grouped together with loose teas (CTB13). These discrepancies indicate an atypical phytochemical composition, possibly due to differences in raw material quality, processing methods, or incorrect labelling. The AHC proved to be a reliable complement to PCA, and confirmed the effectiveness of chemometric methods both for the classification of samples and for the detection of outliers in the quality control of herbal tea.
PLS-DA, a regression-based method suitable for high-dimensional data with limited samples, was used to model the classification and differentiation of chamomile teas. Using the pre-processed chemical data matrix (X) and a one-hot encoded Y matrix, the model showed strong explanatory and predictive power (Fig. 5a). For the first component, the cumulative explained variance of the Y-matrix (R²Y cum) was 0.823, and the predictive ability (Q² cum) was 0.712, exceeding the threshold value of 0.5 for a robust model. Additional components increased R²Y slightly (to 0.860 at Comp3) but were associated with a sharp decrease in Q², indicating overfitting. A permutation test (500 permutations of Y) confirmed that both the R²Y and Q² values for the one-component model were highly significant (p = 0.002), validating the statistical robustness of the observed class discrimination. The PLS-DA score plot (Fig. 5b) showed two well-separated, non-overlapping clusters, visually confirming that the chemical differences between these two pharmaceutical forms are systematic and not random. The PLS-DA correlation matrix (Fig. 5c) revealed that the first latent component (t1/u1) effectively separates loose and tea bag chamomile. This separation is primarily determined by the content of essential oil and total flavonoids, A7G, α-bisabolol oxide A, and chamazulene, which are the most important chemical variables for class discrimination. In contrast, compounds such as α-bisabolol oxide B and α-bisabolone oxide A were associated with the second latent component, reflecting residual variation within the groups rather than contributing to the primary separation. Positions of the group variables “loose” and “tea bag” along t1 also confirm that the first component is the main discriminator between the tea types.

Fig. 5. Chemometric analysis using partial least squares-discriminant analysis (PLS-DA) of commercial chamomile flower samples, including loose tea samples (CFLT1–CFLT11) and tea bag samples (CTB12–CTB22): a) PLS-DA model quality by number of components; b) PLS-DA X-scores plot of the first two latent variables (t1 and t2) showing separation between the sample groups; c) correlation loading plot of the first two latent variables (t1 and t2) of the PLS-DA model, showing the relationship between chamomile tea samples and their chemical variables. Compounds located further from the origin contribute more strongly to class separation; d) variable importance in projection (VIP) scores for the main phytochemical variables contributing to group separation in the PLS-DA model. Variables with VIP >1 are considered significant for discrimination.
To further confirm and quantify the contributions of these metabolites, a VIP plot was created (Fig. 5d), in which the variables that drive the class separation are ordered by importance. Essential oil content (VIP = 1.566), total flavonoids (1.355), α-bisabolol oxide A (1.126), and A7G (1.092) contributed most, while chamazulene and other compounds played a moderate or minor role. The class-specific regression coefficients confirmed the association of these metabolites with the respective tea types (Table SII). Higher levels of essential oils and flavonoids, A7G, α-bisabolol oxide A, and chamazulene were characteristic of loose tea, whereas α-bisabolol oxide B and trans-β‑farnesene were more typical of tea bag samples. Among these, A7G had the greatest impact on class discrimination, consistent with VIP and correlation analyses.
Taken together, this chemometric approach not only enables objective classification of chamomile teas but also provides a data-driven strategy to identify and monitor critical quality markers. This is particularly important for regulatory and pharmacopoeial quality control, where conventional parameters such as total essential oil and A7G content alone may not fully capture the phytochemical variability of commercial products. The observation that loose flower teas have a more consistent composition and higher levels of key active compounds emphasises their higher quality compared to tea bags. These results support the preference for whole-flower preparations and suggest that current pharmacopoeial standards, which are only met by a minority of samples, may need to be reconsidered in light of modern production practices and climate change.
Chemometric tools have previously been applied for the authentication and quality control of different chamomile types, including German chamomile (Matricaria recutita), Roman chamomile (Anthemis nobilis), and Chrysanthemum (C. morifolium) (56). UHPLC-based profiling of phenolic compounds combined with PCA and PLS-DA identified apigenin, quercetagetin, and methyl cinnamate glycosides as key markers distinguishing authentic M. recutita flowers from potential adulterants. In another study, quantification of A7G, together with HPTLC, chemical fingerprints were analysed by PCA and HCA, and were proposed as a tool for authentication of chamomile and detection of adulteration (30). In line with these findings, our results confirm the importance of flavonoids – both apigenin derivatives and total flavonoid content – while also highlighting that essential oil constituents are equally critical for chamomile standardisation and overall quality. Only one previous study reported GC-MS profiling of German chamomile together with two related species (A. nobilis and C. morifolium) and essential oils, where chemometric analysis revealed volatile markers such as spathulenol, α-bisabolol oxide A, α-bisabolol, and coumarin, which allowed clear discrimination and classification of commercial samples (57). In this study, chamomile teas were evaluated for the first time by phytochemical profiling of two main classes of active compounds, essential oil and flavonoids, in combination with chemometric tools.
Overall, all applied chemometric approaches consistently demonstrated that the pharmaceutical form – loose versus tea bag – has a significant impact on the phytochemical profile of chamomile flowers. In addition to the effect of comminution and the resulting loss of volatile compounds, the insufficient content of important bioactive compounds such as A7G and selected sesquiterpenes may also be due to unsuitable harvesting practices and post-harvest processing of the plant material. The tea bags may also contain non-flowering plant parts, which generally have a lower content of bioactive compounds. Finally, differences in the geographical origin, cultivation practices and plant genotype also contribute to the compositional heterogeneity observed between chamomile flowers on the Croatian market.
CONCLUSIONS
Importantly, our study represents the first integration of the flavonoid and essential oil marker classes into a single chemometric framework, providing a more comprehensive and robust approach for chamomile authentication, standardisation, and quality control.
Multivariate PCA and AHC analyses consistently showed that pharmaceutical form, especially processing, significantly influences the phytochemical profile of chamomile flowers, revealing clear patterns, similarities and differences between commercially available samples. Using an integrated pharmacognostic, chromatographic and spectrophotometric approach, significant differences in the bioactive contents and composition of bioactive constituents were found between loose and tea bags. It is noteworthy that only three samples fully complied with the applicable pharmacopoeia standards – all loose teas, two registered as galenic preparations and one marketed as a food, all originating from Croatia. Although only a few chamomile teas met the pharmaceutical standards, samples with whole flowers had significantly higher levels of bioactive compounds, emphasising their higher quality and the importance of giving preference to this form. A further PLS-DA analysis yielded a robust classification model that clearly distinguished the investigated chamomile tea forms based on their phytochemical profiles. Essential oil content, total flavonoids, A7G and α-bisabolol oxide A were identified as the key metabolites driving the class separation and representing potential core chemical markers for quality control. By establishing reliable phytochemical fingerprints and identifying active markers through chemometric evaluation, this study improves quality control standards and provides scientific tools to support regulatory monitoring, authentication, and prevention of fraudulent practices in the herbal products market. Overall, the phytochemical findings underline the need for stringent quality control of herbal drugs and preparations, especially those distributed through pharmacies, covering both essential oil and flavonoid profiles to promote standardisation and ensure consistent availability of pharmaceutical-grade chamomile products. This approach supports the principles of modern, evidence-based phytotherapy and strengthens patient confidence in the efficacy and reliability of herbal medicinal products.
Supplementary material is available upon request.
Acknowledgements. – This work was supported by the project FarmInova (KK.01.1.1.02.0021) funded by the European Regional Development Fund.
Conflict of interest. – The authors declare no conflict of interest.
Authors contributions. – Conceptualisation, B.B.; methodology, B.B.; investigation, I.J.Č.M., L.M., M.K., and B.B.; writing, original draft preparation, B.B. and M.K.; writing, review and editing, B.B., M.K., and S.V.K.; funding, B.B. and S.V.K. All authors have read and agreed to the published version of the manuscript.