
INTRODUCTION
Dendrochronology is a discipline that primarily deals with the dating of historical events allowing the release of records about natural environmental processes and human-induced changes including past temperatures, precipitation, wildfires, insect outbreaks, wind breaks, landslides, etc. According to its specific focus it can be divided into: dendroarchaeology, dendroclimatology, dendroecology, dendrochemistry and dendrogeomorphology (Speer 2010). Time-series obtained using dendrochronological methods are about 12,500 years old for some specific regions (Friedrich et al. 2004). The application of dendrochronological methods ranges from, for example, obtaining more precise information on the timber trade in the past (relating wood with climate conditions and specific area) (Haneca et al. 2009) and precise dating of musical instruments (examining whether the masterpiece “The Messiah” violin attributed to Stradivari was produced when it was suggested) (Topham and McCormack 2000) to the reconstruction of snow avalanches (Butler and Sawyer 2008) and observation of pollutant increase in urban environments such as a significant increase in the platinum group of elements in Mexico City after 1997 (Morton-Bermea et al. 2016).
Dendroecology (formulated as such by Fritts 1971) tackles specific processes within local environments. It includes forest ecology and as such it can be successfully used for better understanding of the complex questions within the phenomena of tree growth, such as the effects of forest mixing on growth (Pretzsch et al. 2015), variations in the accumulation of carbon in forests (Klesse et al. 2016), the impact of specific forest management measures on radial growth (Vitali et al. 2016), the impact of river water table on oak growth (Stojanovic et al. 2015a), the relation between weather events and growth (Stjepanović et al. 2018) or forest age and past forest disturbances through centuries (Nagel et al. 2016). Moreover, dendrochronological methods can be enriched with chemical analysis, such as stable carbon isotope measurements, which can provide important answers related to tree growth, decline and mortality (Kostić et al. 2019). As shortly presented, tree-ring time-series obtained by applying the principles of dendrochronology regarding sampling and chronology processing have great potential in the analysis of different research questions within various fields.
LANDSAT program with more than 40 years of its legacy, together with MODIS program and recently established SENTINEL, provides a large amount of freely available satellite imagery time-series data that with their spatial and temporal resolution have potential to completely reshape the fields of agriculture, forestry, water management or biodiversity conservation.
Numerous applications and new methods for the analysis of image time-series have arisen after the public release of LANDSAT data in 2008 (Woodcock et al. 2008): from forest monitoring (Banskota et al. 2014), mapping of deforestation and forest degradation (Olofsson et al. 2016, DeVries et al. 2016), to the assessment of forest disturbances (Masek et al. 2013, Moisen et al. 2016), forest productivity (Boisvenue et al. 2016) and quantifying forest growth declines (Morin-Bernard et al. 2024).
MODIS time-series (1999 to date) have had various applications, such as the mapping of abandoned farmland (Alcantara et al. 2013), cropland-use intensity (Estel et al. 2016), drought detection (Wu et al. 2016), water management (Autovino et al. 2016), biological conservation (Wessels et al. 2004), wind breaks assessment (Wang et al. 2010), burn severity assessment (Veraverbeke et al. 2011), as well as some very specific applications such as observing floral resource development important for beekeepers (Arundel et al. 2016).
After its appearance in 2014, SENTINEL satellite data (SENTINEL-1, 2014 to date; SENTINEL-2, 2015 to date) has become an excellent complement to the existing time-series data and a promising source of information for future science, practice and policy making. So far, it has been applied in the estimation of crop water requirements (El Hachimi et al. 2022), mapping of glaciers (Yin et al. 2024) and water bodies (Khan et al. 2024), water quality (Mamun et al. 2024), detection of fire burn severity (Suwanprasit and Shahnawaz 2024), and landslides detection (Fu et al. 2024).
To the best of our knowledge, this is a unique study which will evaluate the combining of continuous time-series (monthly and annual average values) derived from MODIS satellites with tree-ring measurements of different tree species in the region of southeast Europe.
The key objective of this paper is to combine time-series of tree growth data of different species (oaks, beech, pine) with MODIS satellite data (NDVI, EVI, LSTd, LSTn) to understand their temporal interdependence better in the context of tree growth and remote sensing interfaces.
MATERIALS AND METHODS
Site and dendrochronological data
We used four tree-ring width (TRW) chronologies from four species sampled at different sites in Serbia. We examined pedunculate oak (Quercus robur L., the Srem region), Turkey oak (Quercus cerris L., the Bačka region), European beech (Fagus sylvatica L., the Zlatibor mountain) and Scots pine (Pinus sylvestris L., the Zlatibor mountain) (Figure 1).
The examined oak forests are located in lowlands at an elevation of about 80 m, while pine and beech forests are located at about 1100 m. The temperature in the last 30 years was approximately 11 ºC in the lowlands and 8 ºC in the mountainous area, while precipitation amounted to about 600 mm and 1000 mm, respectively (Figures 2, 3, 4: Walter and Lieth climate diagrams created with R package “berryFunctions”). The oaks are located in the lowlands within the basins of large rivers (the Sava River and the Danube River), while beech and pine grow on mountain slopes.

Figure 1 The map of studied sites (created with R packages ”OpenStreetMap”, ”maps”, ”map.grid” and ”GISTools”).
All TRW chronologies had been published earlier; pedunculate oak (44.98° N, 19.08° E) (Stojanović et al. 2015a), Turkey oak (45.47° N, 19.17° E) (Stojanović et al. 2015b), European beech and Scots pine (43.70° N, 19.62° E) (Pretzsch et al. 2015). General processing procedure included taking cores or cross-sections from 10 to 20 dominant trees per species (tree cores were sampled using Pressler’s core borer from breast height at the Srem region and the Zlatibor mountain; tree discs were cut in the Bačka region), the drying of samples, gluing on wooden holder, sanding using sandpaper with different grits in order to get smooth surface, scanning in high-resolution with ATRICS system (Levanič 2007), measuring tree-rings up to 0.01 mm with WinDendro software (regent.qc.ca), visual cross-dating with PAST 5 software (www.sciem.com) and detrending and obtaining chronology residuals with ARSTAN software (Cook et al. 2006).
MODIS time-series
Time-series of NASA MODIS Terra Normalized Difference Vegetation Index (NDVI) and Enhanced Vegetation Index (EVI) with a resolution of 250 m 16-Daily values (MOD13Q1), as well as and the Land Surface Temperature Daytime (LSTd) and the Night-time (LSTn) with the resolution of 0.05 degrees (~5 km) 8-Daily values (MOD11C2) were acquired through web-sitewww.earth-observation-monitor.net (Eberle et al. 2014) (which utilize NASA’s data via Google Earth Engine) for the points of interest.
NDVI ranges from -1 to 1, assuming that the values near -1 represent water, while the range from 0 to 1 represents land (near 0 no vegetation and near 1 the highest density of green vegetation). EVI has a smaller dynamic range than NDVI and it is less prone to saturation (Heute et al. 2002). NDVI and EVI utilize red and near-infrared band, while EVI is additionally strengthened with the blue band and the three coefficients. The Land Surface Temperature values are expressed in kelvins.
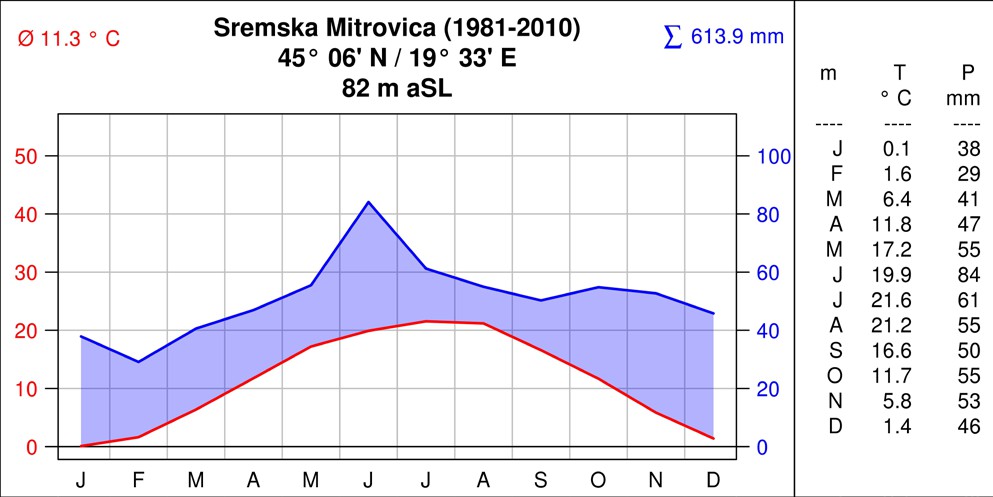
Figure 2 Climate diagram from the reference station near the pedunculate oak stand.
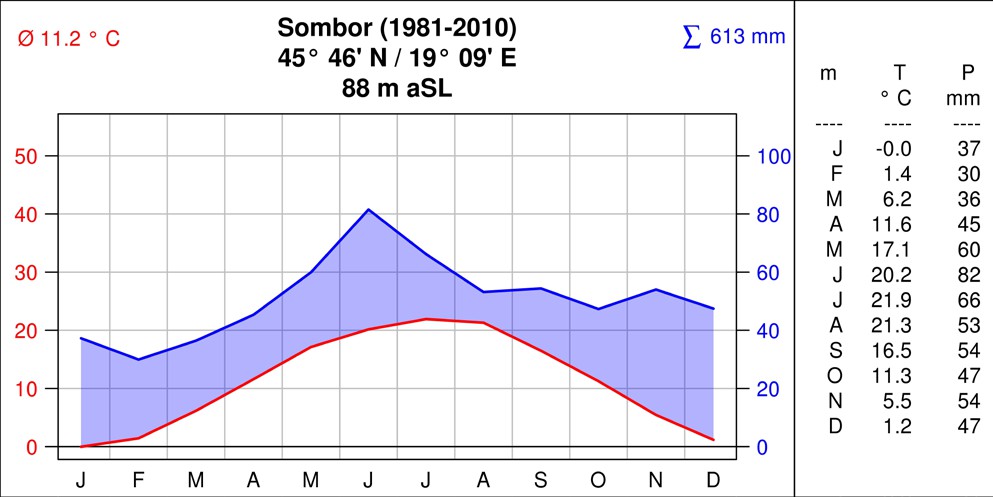
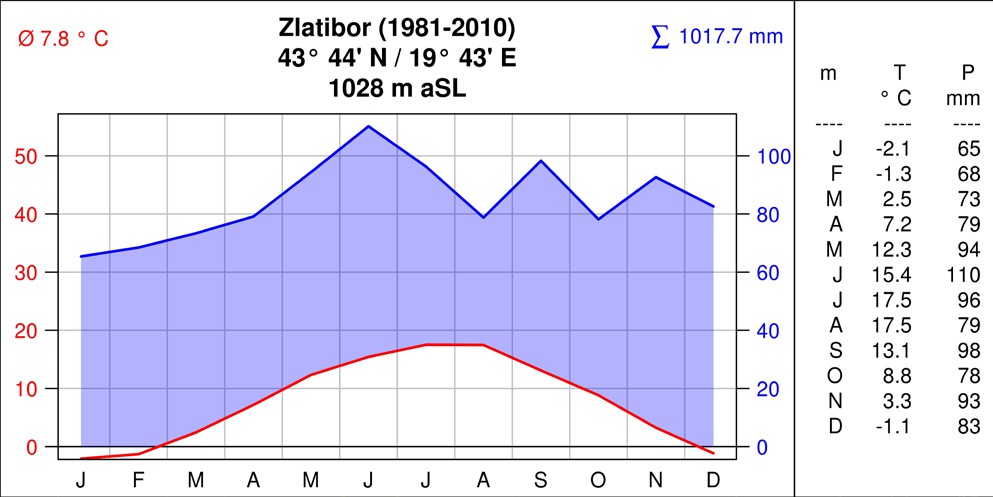
Figure 4 Climate diagram from the reference station near the Europe-an beech and Scots pine stand.
Data reshaping and the preparation for analysis were performed with R packages “data.table”, “lubridate”, “plyr” and “reshape” (R. Core Team 2014). Due to the small distance beteween European beech and Scots pine stands (approx. 50 m) one MODIS time-series was used for both species. The study period was 2000–2013, since 2013 was the last year of available tree-ring data.
Analysis
Simple Pearson’s correlations between annual and monthly time series of NDVI, EVI, LSTd and LSTn and tree-ring data (detrended statistical residuals of TRW) for peduncualate and Tureky oak, European beech and Scots pine were calculated. Correlation coefficients and significance levels for the calculations of annual values were obtained using built-in R function cor.test. For deeper undersanding of underlying phenomena, scatter plots with linear regression lines were plotted.
For the calculation of bootstrapped correlation for the monthly values, “bootRes” R Package was used (Zang and Biondi 2013). Mean monthly values from April of the previous year to September of the year of growth were taken.
RESULTS
Time-series of tree-ring with chronologies and MODIS data
Tree-ring chronologies of different species within different stands provide different growing patterns. The overall mild trend of decreasing growth can be noticed. Turkey oak, European beech and Scots pine showed a particular decrease in growth in the period 2011–2013, when there was an extreme drought in Serbia, while there was no decrease in the growth of pedunculate oak (Figure 5A). The highest values of NDVI were in the pedunculate oak stand, the highest EVI in the Turkey oak stand, together with the highest daily temperatures, while the lowest values of vegetation indices and daytime and night-time temperatures were found at the beech/pine site (Figure 5B, C, D).
Taking into account all four tree species and the monthly values of NDVI, EVI, LSTd and LSTn from April of the year prior to growth to the September of the year of growth, it appears that significant correlations for some months within the growing season are present in all of the cases (Figure 6).
The correlation between tree-ring chronologies and monthly NDVI values was positive for summer months. It was significant for Turkey oak in July and August, for pedunculate oak and beech in September and for pine in August. Statistically significant negative correlation was present in April of the current year and October of the previous year for beech. EVI was significantly correlated with pedunculate oak in May and June, with Turkey oak in August, beech in September and pine in June of the previous year.
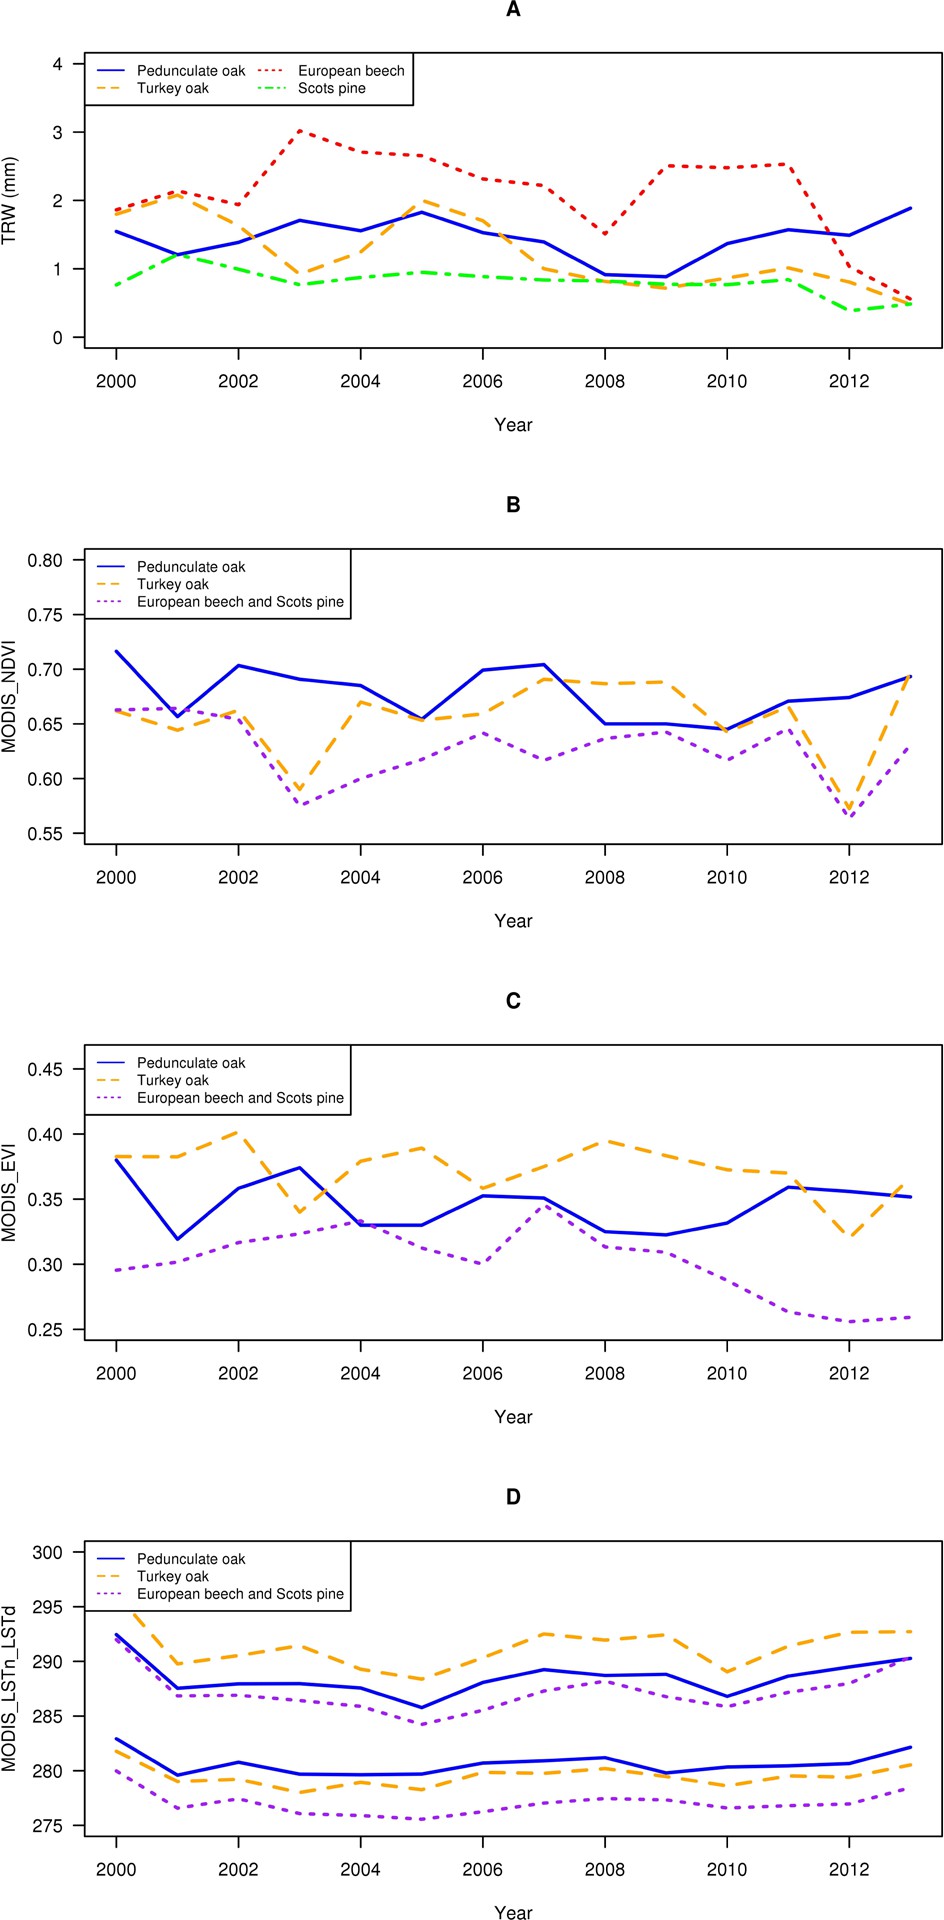
Figure 5 A – Time-series of TRW (peduncualate oak, Turkey oak, European beech and Scots pine); B – NDVI MODIS time-series values; C – EVI MODIS time-series values; D – LSTd and LSTn MODIS time-series values.
Generally, correlations between TRW residuals and NDVI and EVI show certain sinusoid response along seasons. The common pattern for all four species was: previous winter – mostly positive, spring – mostly negative and summer – positive correlations.

Figure 6 Simple Pearson’s correlation between residual (res) chronologies and NDVI, EVI, LSTd and LSTn for the four tree species for the period 2000–2013. Grey is correlation value; dark coloured grey are bootstrapped correlations significant at p < 0.05 (n = 14); lower and upper lines represent 95% confidence limit. At x-axis small letters represent year prior to growth and capital letters the year of growth. At y-axis correlation coefficients are marked. Correlations take values within interval [-1,1]
Statistically significant negative correlations between mean monthly daytime and night-time LST values and TRW residuals were found for all four tree species (Figure 6). Higher temperatures during spring and summer months imply lower growth rates. Surface temperature mostly affected the radial growth of Turkey oak and European beech. Besides the LST values in the year of growth, high August and September LSTn values and September LSTd values in the year prior to growth recorded a significant decrease in beech growth. Pine growth was influenced by July temperatures of the current and September temperatures of the previous year.
Correlations between tree-ring widths and mean monthly MODIS time-series
Annual values of NDVI did not statistically correlate (p<0.05) with any of the tree-ring width chronologies. The values of EVI were negatively correlated with Scots pine growth patterns with a coefficient of -0.546. LSTd was statistically correlated with the growth of Turkey oak, European beech and Scots pine, while LSTn had a high negative correlation with European beech (Table 1).
NDVI, EVI, LSTd and LSTn showed certain groupings around liner regression lines for TRWs of four species (Figure 7).
Scots pine showed the most noticeable grouping around the regression lines of all four MODIS indices. It was followed by pedunculate oak, while beech showed the most scattered grouping.
Table 1 Simple Pearson’s correlation between annual NDVI, EVI, LSTd and LSTn and four tree species tree-ring width residual chronologies for the period 2000–2013 (bold coefficients had p<0.05).
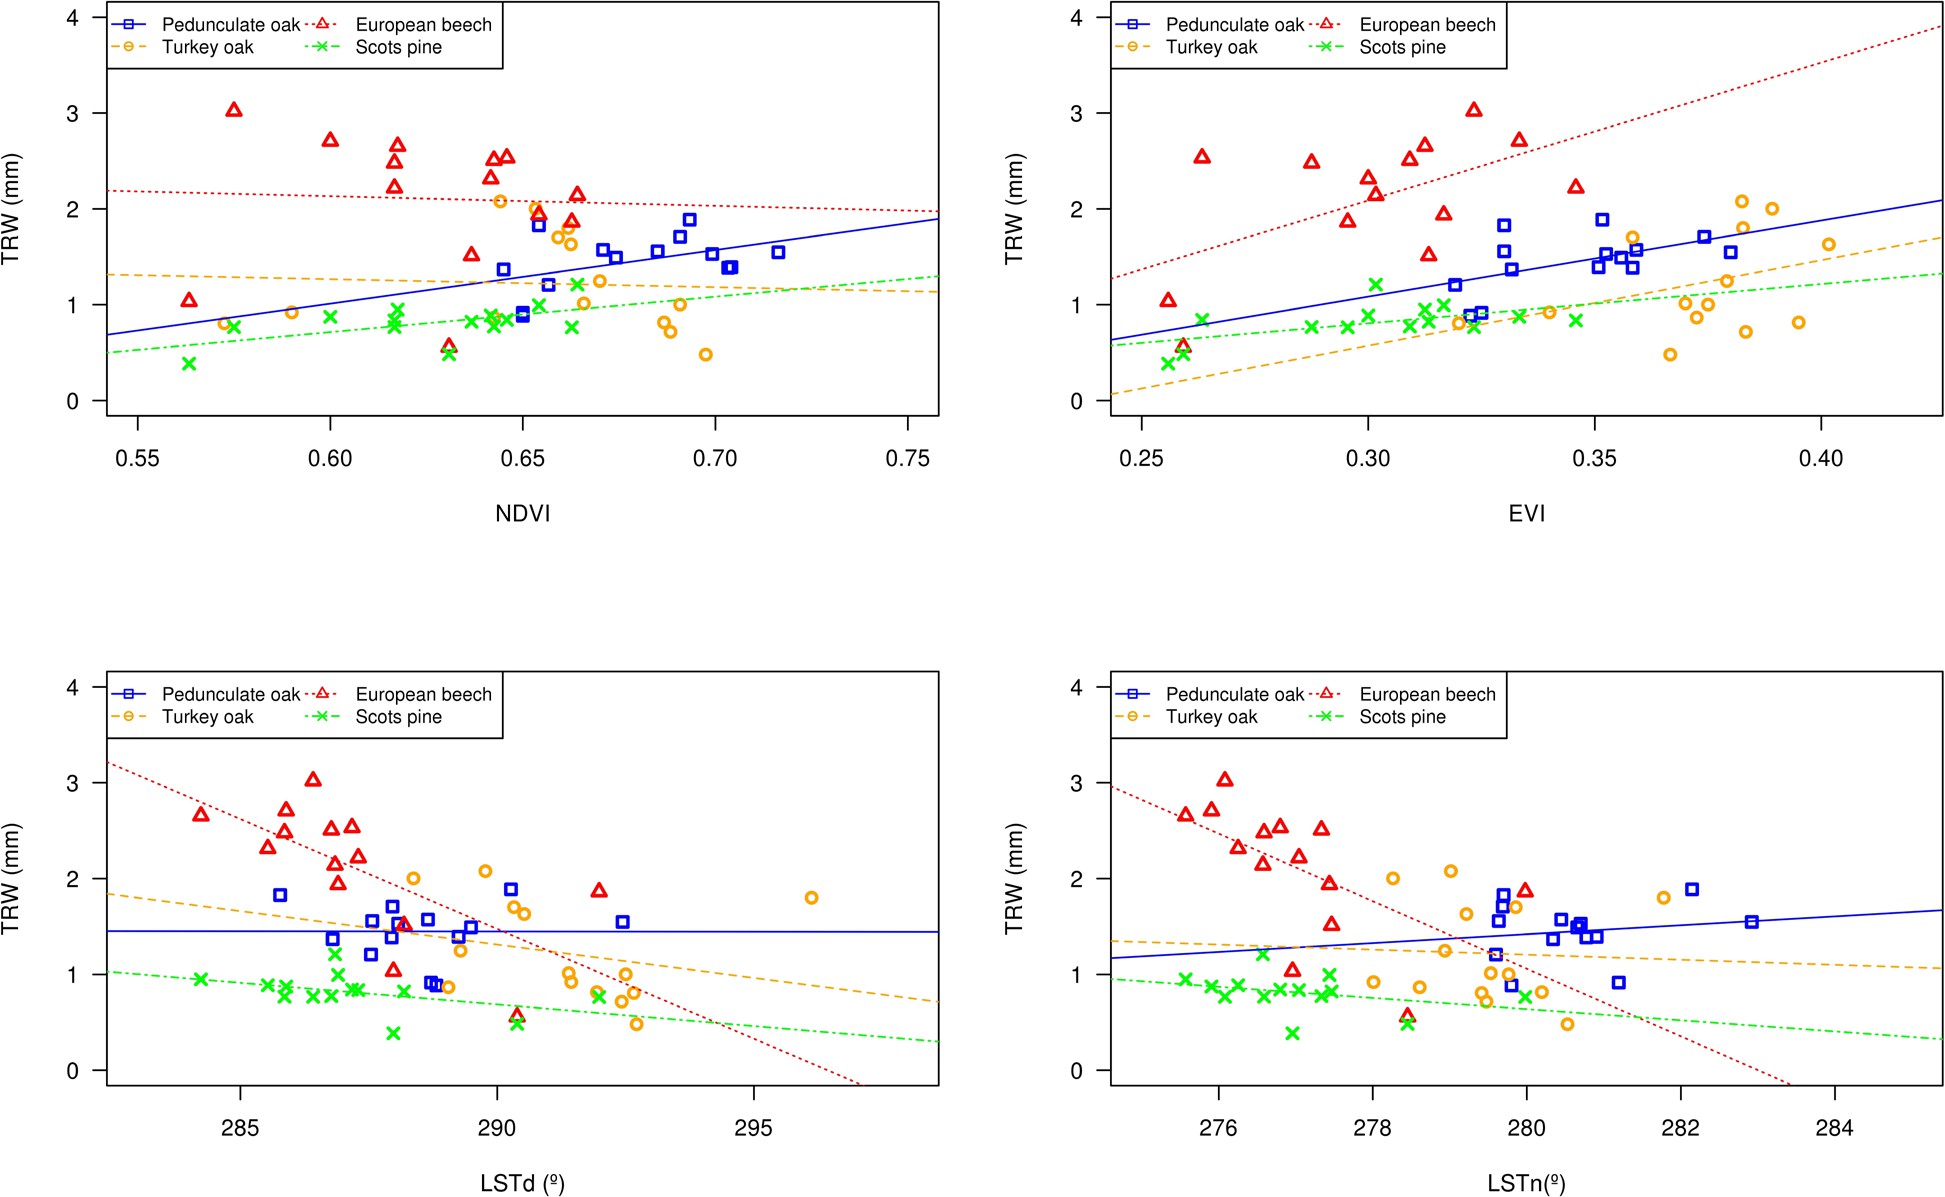
Figure 7 Linear regression between tree-ring widths (pedunculate oak, Turkey oak, European beech and Scots pine) and MODIS derived values (NDVI, EVI, LSTd and LSTn).
DISCUSION
Combining tree-ring time-series with high temporal and moderate spatial resolution satellite time-series may provide significant insights into phenomena of forest ecology and growth monitoring important for forestry practice. Up to now, MODIS satellites have provided uniform and continual time-series that are long enough to be compared and analysed with tree-ring chronologies. With long-term image sequences of high temporal resolution, the relation between tree growth and remotely observed tree responses can be seen much clearer than ever.
There have been successful examples of combining dendroecology with remote sensing in order to address different questions, such as the recognition of spruce mortality (DeRose et al. 2011), forest growth loss in the Mediterranean caused by insect attack (Sangüesa-Barreda et al. 2014), the definition of specific forest tree provenances in some regions (Alessandrini et al. 2010), as well as the examination of the tree line changes in the sub-arctic region (Mathisen et al. 2014) and the overall impact of droughts to forest ecosystems (Shi et al. 2024).
Statistically significant relations between June-August NDVI (NOAA AVHRR PAL time series from 1982 to 2001) and tree-ring widths of Siberian spruce and Scots pine were established for some parts of the observed region in the Russian Far East (Lopatin et al. 2006). Recently, AVHRR Normalized Difference Vegetation Index data were used under the modeling framework that included larch and Scots pine growth decline in China (Wang et al. 2024).
Some studies were focused on the question regarding the correlation between satellite-derived NDVI and the growth of Scots pine (particularly gross primary production – GPP and the fraction of absorbed photosynthetically active radiation – FAPAR), concluding that a significant correlation existed during the growth period (Julian days 90–270), although not when the mean annual values are considered (Wang et al. 2004).
Tree-ring width measurements were earlier proposed as a proxy for tree productivity within the study relating NDVI (derived from NOAA AVHRR) to site-level ring width index (RWI) (Berner et al. 2011). The study considered the period from 1982 to 2008 and found statistically significant correlations in nine out of 27 chronologies. A study based on similar methods (NDVI from AVHRR) and study area (Siberia) showed statistically significant correlation between Scots pine TRW and July NDVI (Bunn et al. 2013). Both studies used GIMMS NDVI data set that provided 24 composite NDVI images per year at a spatial resolution of 8 km.
Multi-sensor continuity regarding NDVI observations can be achieved to some extent (e.g., extension of the MODIS time-series used in this research with AVHRR data) using appropriate techniques. However, this may introduce a reasonable amount of uncertainty due to incompleteness of the knowledge on atmospheric conditions (Van Leeuwen et al. 2006).
A great advantage of the available MODIS NDVI dataset used in our study lies in the significantly higher spatial resolution of 250 m for NDVI and EVI in comparison to Advanced Very High-Resolution Radiometers (AVHRR). It now allows the monitoring of processes at the level of a forest stand, which assumes uniformity in the parameters such as forest species composition, structure, age, diameter distribution and site characteristics.
The calculations in this study were performed using MODIS LST variable resolution of ~5 km which allowed the establishment of significant correlations with radial growth. Considering the correlations between TRW residuals and mean annual values of MODIS time-series variables, the most straight-forward correlation was between the growth of pine and LSTn (-0.67, p=0.008) (Table 1). Plotting of the annual TRWs and the annual values of NDVI, EVI and LSTs pointed to certain groupings around linear regression lines. Linear fits proved best in explaining radial growth (TRWs in mm) of Scots pine, while European beech had the most scattered cases. The reason why beech had a high deviation from the linear function may be found in its plasticity to environmental conditions (due to the age and species specificities), as well as in the memory effect of the previous year’s drought (Yang et al. 2016), meaning that the growth response to drought may be expressed in the year(s) after the event. Moreover, remotely sensed data can be used to assess negative impacts of climate change to various forest types (Stojanović et al. 2021, Miletić et al. 2024). One of the key findings of this research are rather high correlations between LST monthly values and tree growth: LSTd (Turkey oak – April: -0.71 and August: -0.70; European beech – June: -0.65) and LSTn (Turkey oak – June: -0.68; European beech previous August: -0.83; Scots pine – June: -0.79) (Figure 6). When comparing simple Pearson’s correlation coefficient between Turkey oak TRW residuals and temperatures at “Sombor” reference meteorological station for the period 1961–2010 (significant, about -0.4 in April) (Stojanović et al. 2015b), it can be concluded with caution that LSTd and LSTn for the period 2000–2013 provided at least equally good (statistically significant) results. The advantage of temperature data derived from satellite measurements lies in their higher spatial accuracy, since in this case, for instance, the reference meteorological station was located at more than 20 km from the forest stand and the network of meteorological stations was not dense enough to provide precise interpolation results. If we focus only on temperatures, the spatio-temporal interpolation approach that considers ground measurements and MODIS time-series can be beneficial (Kilibarda et al. 2014).
Intercomparison between different NDVI data sets and Landsat as a reference showed that MODIS-NDVI outperformed four AVHRR-NDVI (GIMMS, PAL, LTDR and FASIR) data sets regarding the level of agreement and performance (Beck et al. 2011). The usage of MODIS LST 1 km resolution product will be a potential improvement of our study. Besides linear methods (simple Pearson’s correlation), more robust approaches, such as various machine learning techniques, can be used for evaluating relations and predicting growth from satellite time-series (e.g. artificial neural networks) (Jevšenak and Levanič 2016). Moreover, research by Balenović et al. (2021) in Croatia (Pokupski bazen) shows that forest growing stock can be successfully assessed in terms of cost-effectiveness in comparison to inventory data with diverse remotely sensed photogrammetric data that is usually available. Some more current research which took into account Sentinel 2 time series and calculated vegetation indices found that normalized difference moisture index (NDMI) can be a very important predictor variable of growth (Jevšenak et al. 2024).
CONCLUSIONS
By combining dendrochronological data (tree-ring widths of pedunculate and Turkey oak, European beech and Scots pine) with MODIS time-series, we have found significant correlations between indices (NDVI, EVI, LSTd and LSTn, averaged to monthly and annual values) and radial growth for the period from 2000 to 2013. Specifically:
All four tree species were significantly influenced by each of the four measured indices for some specific months during the growing season,
LSTd annual values were significantly related to the growth of three tree species (Turkey oak, beech and pine), and
EVI and LSTn annual values were significantly related to the growth of single species (pine and beech, respectively).