
1. INTRODUCTION / Uvod
Durrës is Albania’s most prominent coastal city, with an estimated population of 292,029 and during the tourist season, it attracts the highest number of both domestic and international visitors in the country [1]. It is located along the Adriatic Sea and features a coastline extending roughly 30 miles. In recent years, the economic development of Durrës has been increasingly oriented toward tourism. Numerous luxury hotels have been constructed and operate year-round, emphasizing the need to maintain a clean and tranquil environment for visitors. The coastal topography of Durrës is generally flat, and the prevailing wind direction is from the northeast [2]. Seawater pollution is a global environmental concern, and Durrës faces similar challenges. Not all wastewater in the city is treated before being discharged into the sea, posing a significant risk to marine and public health. Contributing factors include the use of chemical fertilizers, ongoing urbanization, and the discharge of untreated sewage and industrial effluents directly into water bodies [3,4,5]. Durrës is also home to the largest port in Albania, which handles approximately 850,000 passengers and 3 million tons of cargo annually, primarily directed toward western European ports [6]. The port operates throughout the year, and its continuous activity represents an additional potential source of seawater pollution. As such, effective management of environmental impacts from both tourism and port operations is essential to protect marine ecosystems and public health. The primary pollution of seawater in ports originates from the discharge of various wastes from ships and the diverse activities undertaken in these areas [7]. These activities result in changes in water quality, which consequently impacts the marine ecosystem. The southern part of the Adriatic Sea receives freshwater from the Buna/Bojana River, which discharges the largest volume of water compared to other rivers in Albania [8,9]. Additionally, the coastline of Durrës is impacted by two of the most polluted rivers in the country, namely the Erzen and Ishëm rivers. These rivers, along with drainage canals, carry urban waste, plastics, chemical fertilizers, and untreated sewage. Previous studies conducted in the region report that under typical condition, seawater quality is often classified as good, characterized by low levels of fecal contamination [10,11]. However, during peak tourist seasons, a decline in water quality has been documented, marked by elevated concentration of fecal indicators such as Escherichia coli and Enterococcus faecalis [11,12]. These seasonal increases in microbial contamination pose significant risks to public health and highlight the impact of intensified human activity on coastal water quality. Pollution is localized to specific beach areas identified as hotspots, where wastewater is directly discharged into the sea. The primary objective of this study is to measure key physicochemical parameters of seawater including electrical conductivity, turbidity, pH, temperature, dissolved oxygen (DO), total dissolved solids (TDS) and salinity through direct on-site sampling. While comparable monitoring has been conducted at various locations along the Adriatic Sea to evaluate coastal water quality, eutrophication dynamics, and oxygen variability [13,14,15,16], no comprehensive baseline has previously been established for the Durrës coastal area. This work therefore provides the first site-specific baseline dataset for Durrës, complementing regional evidence from the broader Adriatic. These measurements aim to provide an accurate and real-time assessment of water quality, reflecting the impact of both natural processes and anthropogenic activities. A secondary objective is to evaluate the levels of microbial contamination by fecal bacteria, focusing on Escherichia coli and Enterococcus faecalis, particularly during the high tourist season when the risk of pollution is elevated. The study seeks to generate data that can inform water quality management strategies and promote the sustainable use of coastal resources.
2. MATERIALS AND METHOD / Materijali i metoda
Physicochemical parameters were measured in situ once a month at depth of 1 meter using a HANA instrument multiparameter probe (model HI9829) at the Sfinksi station (41°18′36″ N, 19°26′33″ E) over a one-year period from January to December 2022 (Figure 1). Prior to each sampling session, the device was calibrated following the manufacture’s standard protocols. The pH probe was calibrated using standard solution at pH 4.01 and 7.00, while the dissolved oxygen was calibrated with distilled water to represent 100 % oxygen saturation. The conductivity probe was calibrated using a standard solution with a known conductivity of 1200 µS/cm. Surface water samples for fecal indicator analysis were collected monthly from June to September 2022, with one sample obtained during each month. Sampling procedure followed the standard methodology outline in [17], and was conducted between 12:00-14:00, as recommended in [18]. A volume of 500 mL was collected from the surface layer using sterilized glass bottles, leaving approximately 3 cm of headspace below the stopper to prevent contamination and ensure proper sample integrity [19]. Immediately after collection, samples were stored in thermally insulated containers (thermos-boxes) maintained at 10 °C and transported to the Central Laboratory of the Armed Forces. All samples were analyzed within two hours of collection to maintain reliability and prevent microbial degradation [20]. Microbiological analysis of fecal indicator was performed according to international standards. Escherichia coli (E. coli) were quantified using ISO 9308-1:2016 method, while Enterococcus faecalis (E. faecalis) was assessed following ISO 7899-2:2000. Results are expressed in colony-forming units per 100 milliliters (CFU/100 mL). Selective culture media were employed for microbial identification: Chromogenic Coliform Agar (C-EC) for E. coli, and Enterococcus Confirmation organic Agar (E.C.O.A) for E. faecalis. In additional, descriptive statistical analyses of the physicochemical parameters were performed, including the calculation of average values over the one-year monitoring period. To assess potential relationships among these parameters, Pearson correlation analysis was also conducted.

Figure 1 Study area (red circle)
Slika 1. Područje istraživanja (označeno crvenim krugom)
3. RESULTS AND DISCUSSION / Rezultati i rasprava
3.1. Physicochemical parameters / Fizikalno-kemijski parametri
The statistical relationships among the measured physicochemical parameters are presented in Table 1. Pearson correlation coefficients (r) were calculated to evaluate the linear associations between key variables, including temperature, turbidity, dissolved oxygen (DO), pH, electrical conductivity (EC), total dissolved solids (TDS), and salinity. The analysis provides insight into potential interdependencies among these parameters, with significance levels assessed at p < 0.05. These correlations are essential for understanding the dynamics of the marine environment and for identifying indicators that may respond similarly to environmental pressures [21]. Temperature exhibited a strong negative correlation with salinity (r = 0.839), indicating that higher temperatures were associated with lower salinity levels. This inverse relationship may reflect the influence of freshwater or wastewater inflows, which dilute the saline content of seawater [21,22]. The strength of this correlation suggests that dilution from such inputs is a dominant factor contributing to the observed salinity variations. Additionally, a weak but statistically significant positive correlation was identified between temperature and turbidity (r = 0.377). This suggests that slight increases in temperature are generally accompanied by modest increases in turbidity. However, the relatively low coefficient of determination implies that turbidity is likely influenced more substantially by other environmental or anthropogenic factors, such as sediment resuspension, runoff, or human activities along the coastline [23]. Turbidity exhibited a moderate negative correlation with dissolved oxygen, suggesting that elevated turbidity levels are associated with lower oxygen concentrations. This relationship may be explained by the reduction in light penetration in turbid waters, which limits photosynthetic activity by aquatic plants and algae, thereby reducing oxygen production. Furthermore, the decomposition of suspended organic matter often associated with high turbidity can increase microbial oxygen demand, further contributing to oxygen depletion [24]. In contrast, turbidity showed only weak correlations with other physicochemical parameters, including pH, electrical conductivity (EC), total dissolved solids (TDS), and salinity. These findings suggest that the processes influencing turbidity in this coastal system are relatively independent of those affecting the aforementioned variables [25]. A strong positive correlation was observed between salinity and dissolved oxygen. Although this may initially seem counterintuitive since higher salinity typically reduces oxygen solubility it is plausible that, in this case, elevated salinity reflects better-mixed, oxygen-rich marine waters, particularly in areas less affected by freshwater or wastewater inputs [26]. Electrical conductivity displayed a strong negative correlation with pH (r = - 0.800), likely due to the presence of alkaline salts, which contribute simultaneously to increased ionic strength and elevated pH values [5], [9]. Additionally, moderate positive correlations were found between salinity and both EC (r = 0.583) and TDS (r = 0.583), indicating that as salinity increases, so do the concentrations of total dissolved substances and the overall conductivity of the water. However, the fact that these correlations are not closer to unity (r ≠ 1) suggests that EC and TDS are influenced by a broader spectrum of dissolved ions beyond those directly contributing to salinity [27].
Table 1 Pearson Correlation (r) Among Measured Parameters
Tablica 1. Pearsonova korelacija (r) među izmjerenim parametrima
Temperature and salinity are critical environmental parameters that significantly influence aquatic life. Temperature, in particular, affects the solubility of dissolved oxygen as well as the rates of various chemical and biological processes in the water column. Generally, dissolved oxygen is more soluble in colder water than in warmer water [24]. During the monitoring period, the lowest temperatures were recorded in February (12, 58 °C) and March (12, 53 °C), while the highest temperature (24, 56 °C) was observed in August. These values reflect the seasonal variation typical of coastal marine environments in the Adriatic region. The recorded surface water temperatures are illustrated in Figure 2. Seasonal changes in seawater temperature are primarily driven by solar radiation intensity and the thermal properties of water, including its heat capacity and vertical mixing dynamics [29]. Overall, the temperature trends observed in this study are consistent with established seasonal patterns reported for the Adriatic Sea [30], further validating the reliability of the data collected. Turbidity exhibited considerable fluctuations throughout the monitoring period, as illustrated in Figure 2. Values ranged from 8, 51 NTU in January to a peak of 290 NTU in August, indicating significant seasonal variability. This variability may be attributed to both natural hydrodynamic processes and anthropogenic influences. The Adriatic Sea receives up to one-third of the total freshwater input into the Mediterranean Sea, making it highly sensitive to riverine and terrestrial inflows [31]. The circulation in this region is characterized by a cyclonic pattern, with a north-northwest flow along the Croatian coastline extending to the Istrian Peninsula, and a compensating southeast return current along the Italian coast [32]. Along the Albanian coastline, both river discharge and submarine groundwater outflows play a key role in influencing turbidity levels by transporting suspended and dissolved particles into the marine environment [33]. pH is a key parameter for assessing the chemical stability and buffering capacity of seawater. It is closely linked to carbon dioxide (CO₂) levels and alkalinity; generally, higher pH values correspond to higher alkalinity and lower concentrations of dissolved CO₂ [34]. The carbonate–bicarbonate buffering system plays a central role in maintaining pH stability in marine environments [35]. Moreover, pH can be influenced by several factors, including biological activity, temperature, oxygen content, and the concentration of dissolved ions (both anions and cations) [34]. The Adriatic Sea, like other semi-enclosed basins, is sensitive to climate change and the absorption of atmospheric gases such as CO₂. It functions as a CO₂ sink during the winter months and as a source during late summer and autumn, contributing to seasonal pH fluctuations [35]. Seawater pH ranged from 7.78 to 8.90 (Figure 2). With the exception of a single October value (7.78), measurements remained within 8.70–8.90, indicating minor variability (0.05–0.19 pH units) and a stable, well-buffered system. The temporary October decline likely reflects short-term inputs as freshwater inflow or organic matter decomposition, as reported in other coastal ecosystems [36]. Despite occasional declines, the measured pH values remained within the acceptable range for aquatic life, which typically tolerates pH levels between 6.0 and 9.0 [37,38]. The average pH during the monitoring period was 8.71, which is consistent with slightly alkaline marine conditions [36]. The concentration of dissolved oxygen (DO) in seawater has been declining globally due to increasing anthropogenic pressures, including climate change, eutrophication, and pollution [39]. DO is a critical indicator of water quality, directly affecting the survival and metabolic functions of marine organisms [40]. During the monitoring period, DO concentrations in the study area ranged from 7.49 mg/L to 9.04 mg/L, with an average value of 8.36 mg/L (Figure 2). All recorded values remained above the minimum ecological threshold of 6.5 mg/L, indicating generally favorable oxygen conditions for marine life [41]. Fluctuations in dissolved oxygen can have significant ecological consequences. A decline in oxygen availability can negatively impact the growth and productivity of marine plants and algae, which are primary producers in most marine food webs. These organisms not only sustain higher trophic levels but also play a key role in nutrient cycling and carbon storage, as they are highly efficient at capturing and retaining atmospheric CO₂. Wave activity is another critical factor influencing DO levels, as it enhances air–sea gas exchange, thereby contributing to oxygenation of the upper water column [42]. The relatively stable DO values observed in this study suggest that physical mixing processes, such as wave-induced aeration, may have contributed to maintaining adequate oxygen levels. Nonetheless, low DO levels can still result from both natural and anthropogenic sources. Potential causes include increased organic matter decomposition, polluted river discharges, particularly during springtime runoff, and other nutrient-loading events [43,44]. Although no critically low values were recorded during the study period, continuous monitoring remains essential for detecting future shifts in oxygen dynamics. Electrical conductivity (EC) is a key indicator used to estimate the concentration of dissolved ions and is closely associated with salinity levels in aquatic environments [17]. As reported in the literature, EC and total dissolved solids (TDS) are strongly interrelated and both depend on the ionic composition of the water [45,46,47]. The major ions contributing to TDS typically include chloride (Cl⁻), sodium (Na⁺), and magnesium (Mg²⁺), with sodium and chloride being dominant in saline waters [48,49,50]. In this study, EC values ranged from 36, 33 mS/cm to 48, 08 mS/cm, with the lowest values recorded in September and the highest in May (Figure 2).
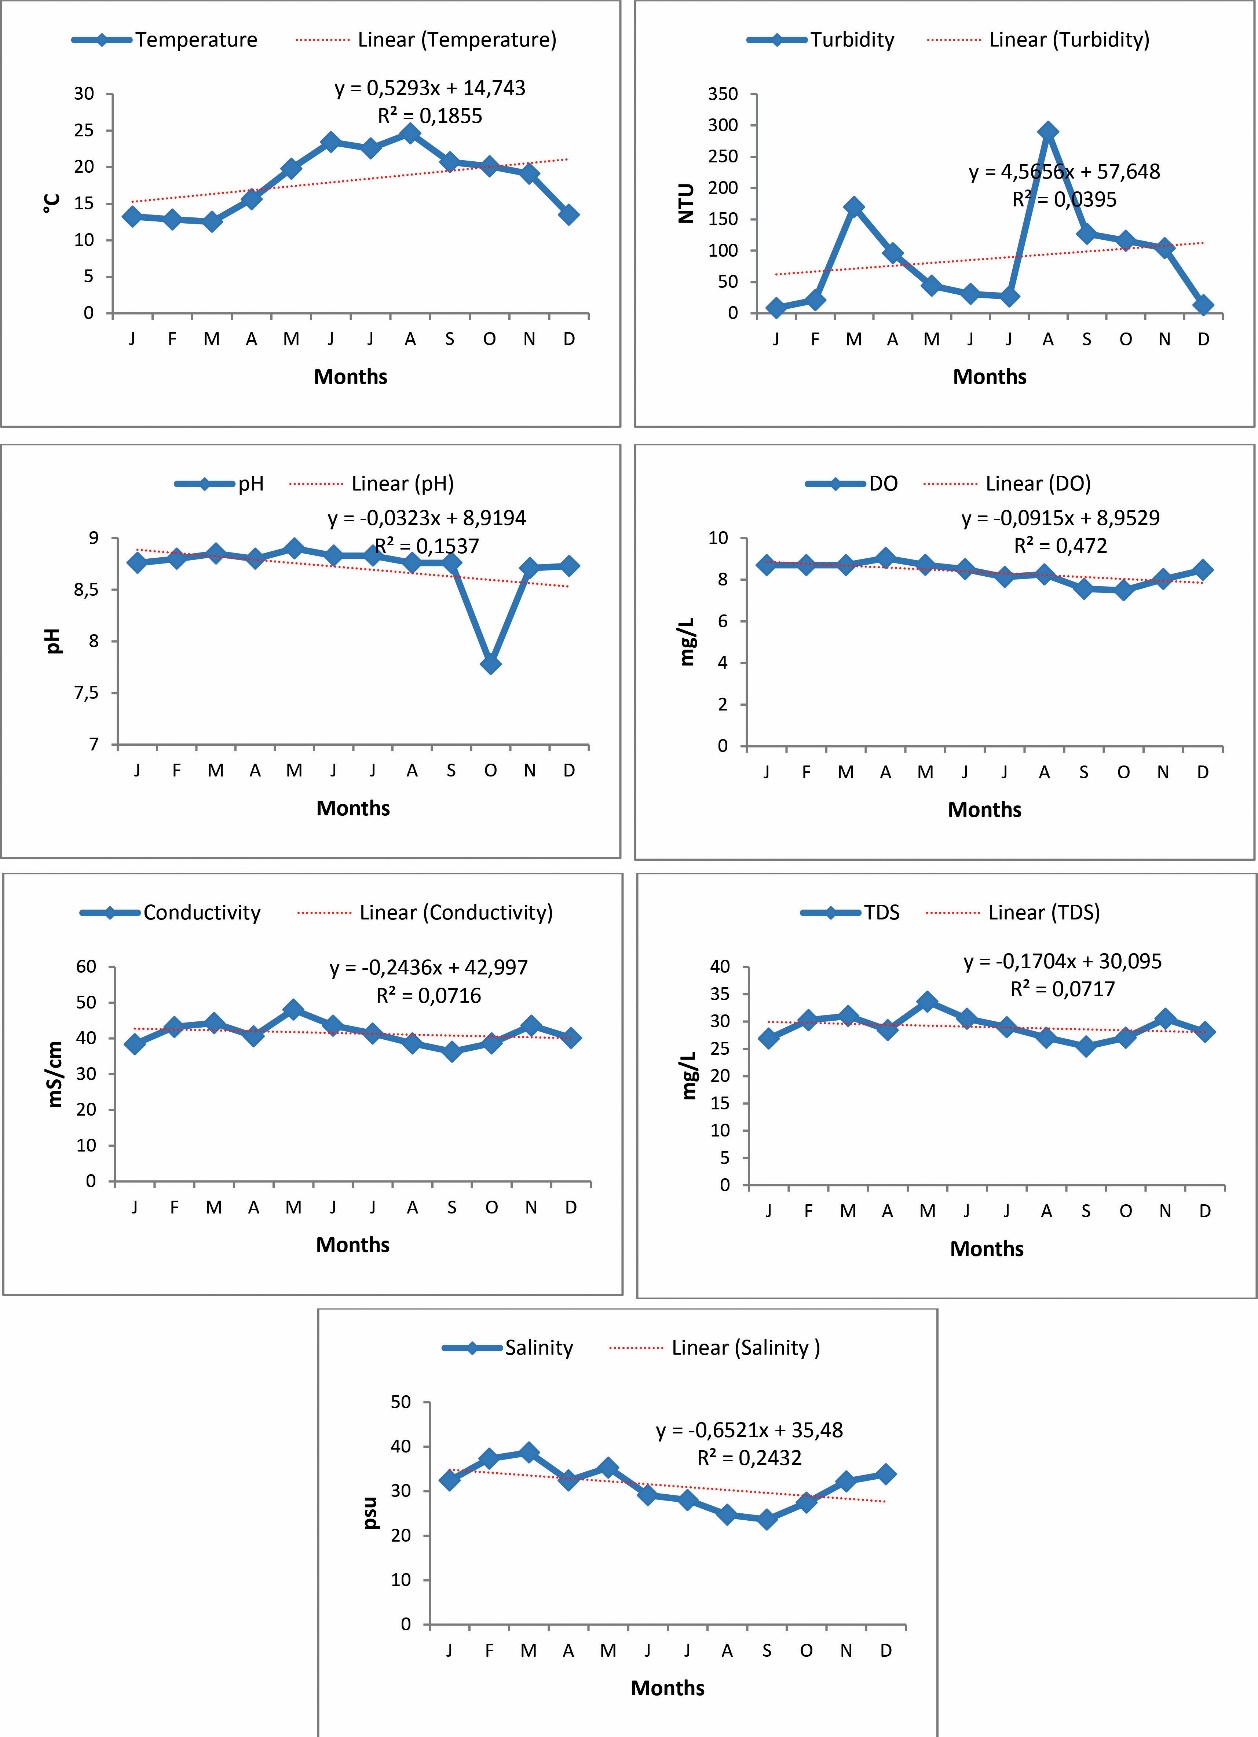
Figure 2 Average monthly physicochemical parameters variation over the year
Slika 2. Promjene prosječnih mjesečnih fizikalnokemijskih parametara tijekom godine
The average EC was 41, 41 mS/cm. These fluctuations reflect seasonal variations in the concentration of dissolved ions, influenced by both natural and anthropogenic activities [51]. Total dissolved solids (TDS) values in the study area ranged from 25.43 mg/L to 33.65 mg/L, as shown in Figure 7. These values reflect the concentration of both organic and inorganic substances dissolved in seawater. The temporal variability in TDS closely mirrored the patterns observed in electrical conductivity (EC), further confirming the strong positive correlation between these two parameters. Salinity in the study area showed considerable variability, ranging from 23.6 to 38.7 practical salinity units (psu), with an average value of 31.23 psu (Figure 2). The observed range indicates pronounced temporal fluctuations in water quality at the monitoring station over the study period. In contrast, previous studies have reported relatively low variability in both salinity and conductivity within the Adriatic Sea [52]. One potential factor contributing to the broader range observed in this study is the suspected discharge of untreated wastewater directly into the coastal waters, which may alter the ionic composition and reduce salinity through dilution effects. These findings highlight the influence of local anthropogenic inputs on the chemical properties of seawater and underscore the importance of continued monitoring to understand and mitigate the impacts of pollution on coastal water quality.
3.2. Microbiological parameters / Mikrobiološki parametri
Microbial pollution of coastal waters represents a critical environmental and public health concern [53]. The primary contributors to this pollution are riverine inputs, industrial activities, and densely populated urban areas located adjacent to the coastline [56]. These sources introduce microbial contaminants, including fecal indicator bacteria, which serve as proxies for potential pathogenic contamination. Fecal indicator bacteria such as Escherichia coli and Enterococcus faecalis have been widely investigated as markers of fecal pollution in marine environments [31,57,58]. In this study, bacterial concentrations were quantified following the protocols set forth by the Bathing Water Directive 2006/7/EC to assess coastal water quality. The concentration of E. coli detected at the monitoring station varied between 505 and 620 CFU/100 mL, with peak counts observed in August (Figure 3). According to the Bathing Water Directive, seawater quality was classified as "good" in June and September and "sufficient" in July and August, consistent with the E. faecalis concentrations, which ranged from 195 to 213 CFU/100 mL (Figure 4). These seasonal variations highlight the temporal dynamics of microbial contamination in the study area. The presence of fecal indicators, particularly E. faecalis, is a reliable indicator of fecal contamination in marine waters. This contamination is primarily linked to anthropogenic activities, especially the discharge of untreated sewage into coastal waters [59], and the accumulation of human-derived organic matter in beach sand and the surrounding environment [60,61]. Such contamination adversely affects marine ecosystems, compromises water quality, and poses risks to human health. Consequently, microbial pollution contributes to the degradation of fisheries and tourism industries, which are vital to the local economy. Moreover, exposure to contaminated water represents a significant health hazard to recreational users and coastal communities [62]. Previous studies have also documented fecal pollution within the region, corroborating these findings [11,12,63].
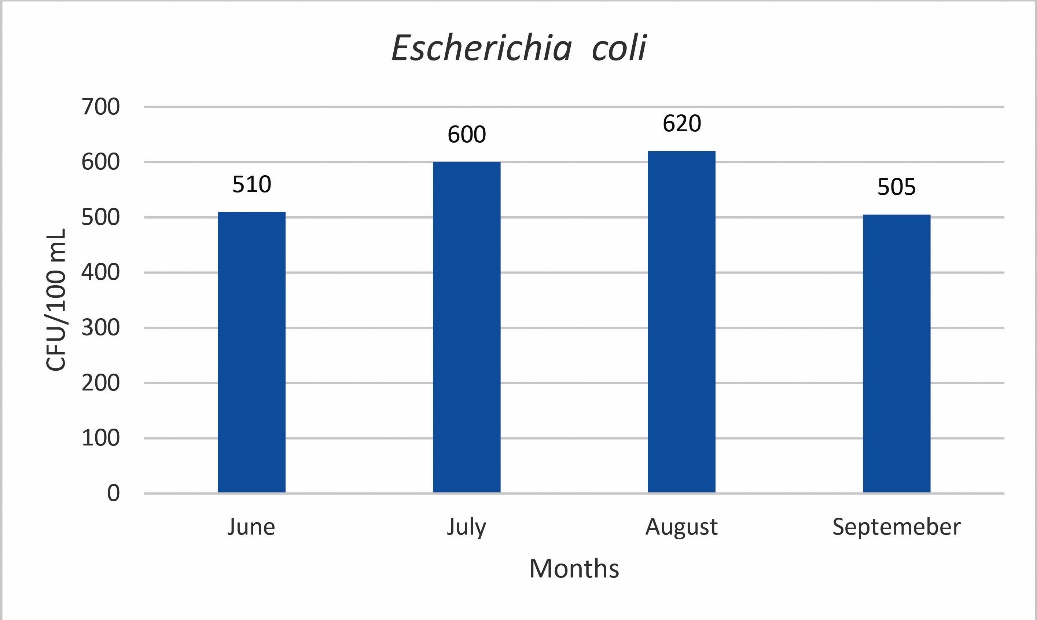
Figure 3 The concentration of Escherichia coli
Slika 3. Koncentracija Escherichiae coli
The observed microbial pollution is likely attributable to the direct discharge of untreated wastewater and sewage from hotels and restaurants located along the coastline, as the area currently lacks adequate industrial sewage treatment facilities. Furthermore, urban waste and plastic debris constitute additional sources of coastal pollution. The volume of such waste tends to increase significantly during peak tourist seasons, primarily due to the higher influx of visitors combined with potentially insufficient urban waste management practices implemented by the Durrës municipality.
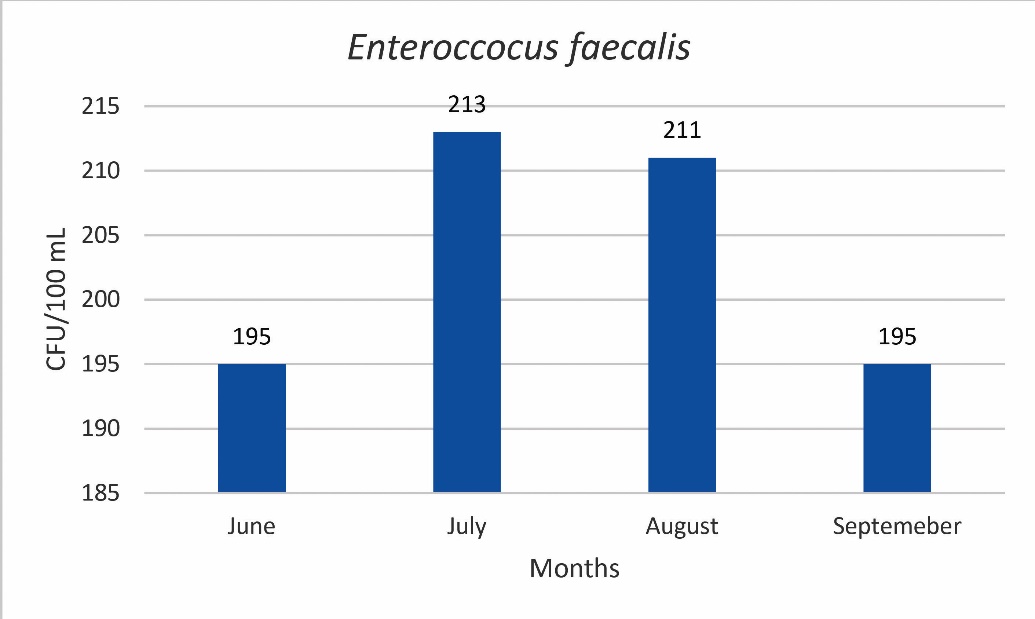
Figure 4 Concentration of Enterococcus faecalis
Slika 4. Koncentracija Enterococcus faecalis
4. CONCLUSIONS / Zaključak
This study demonstrates the seasonal variability of physicochemical and microbiological parameters in the coastal waters of Durrës, driven by both natural processes and anthropogenic pressures. Dissolved oxygen and pH remained within ecological thresholds, whereas fluctuations in turbidity, salinity, and microbial indicators reflected the influence of freshwater inputs and untreated wastewater discharges. Microbial pollution was largely linked to inadequate wastewater treatment and increased waste generation during peak tourism. While oxygen conditions were generally suitable for marine life, seasonal peaks in turbidity and fecal indicator bacteria highlight the vulnerability of coastal waters to anthropogenic impacts. These findings underscore the need for continuous monitoring, stricter wastewater management, and improved municipal waste practices to safeguard ecosystem health, public safety, and the sustainability of local economic activities, including fisheries and tourism, in the Adriatic region.
Author Contributions: Conceptualization, M. B., and J. S; Methodology, M. B; Writing-Original Draft Preparation, M. B., J. S; Writing –Rewiew and Editing M. B., and J. S; Supervision, M. B., and J. S.
Funding: The research presented in the manuscript did not receive any external funding.
Conflict of interest: None.
Acknowledgement of AI or AI-assisted tools use: During the preparation of this paper, authors used ChatGPT in order to refine the academic language. After using the ChatGPT, the authors reviewed and edited the content as needed and take full responsibility for the content to the published article. We are grateful to the Laboratory of Armed Forces for provided the multiparameter and buffer solution for calibration of equipment.