
1. INTRODUCTION / Uvod
The oil and gas industry have made significant advancements alongside the processes of industrialization and modernization, particularly in the use of modern technologies for drilling rigs involved in oil and gas exploration and extraction (expressed in Fig. 1). These technologies play a crucial role at nearly every phase of production, spanning from manufacturing to optimizing operational efficiency in offshore operations. Among these advancements, the JuRs stand out as significant innovations in offshore extraction [1]. Their adaptable architectures and operational modalities enhance resource recovery efficiency, resulting in improved extraction processes. However, these offshore rigs face continuous challenges posed by harsh working conditions [2] or failing the maritime regulatory framework [3]. Key environmental parameters impacting structural integrity include wave dynamics, aerodynamic forces, hydrodynamic currents, and vibrational characteristics [4]. These variables can markedly affect the stability of structures, leading to displacements or potential failure [5]. Such vulnerabilities pose serious risks during extraction operations if not adequately monitored and maintained promptly.
Structural instability arises from external influences and the degradation of connections within the structure. These factors can be classified into the following categories [6]: Serviceability limit - The limit states and limit parameters of a structure, according to design, ensure stability during use [7]; Fatigue limit - The material's limit state can result in the degradation of structural connections when exposed to particular environmental condition; Ultimate limit - Exceeding the maximum tolerance value for structural deformations can damage the structure; Accidental Limit - The integrity of the structural connections is compromised, leading to a failure in the structural system and posing a significant safety risk. Consequently, numerous research initiatives are dedicated to advancing structural health monitoring systems, primarily aimed at evaluating critical parameters that influence the structural integrity and performance of buildings and infrastructure.
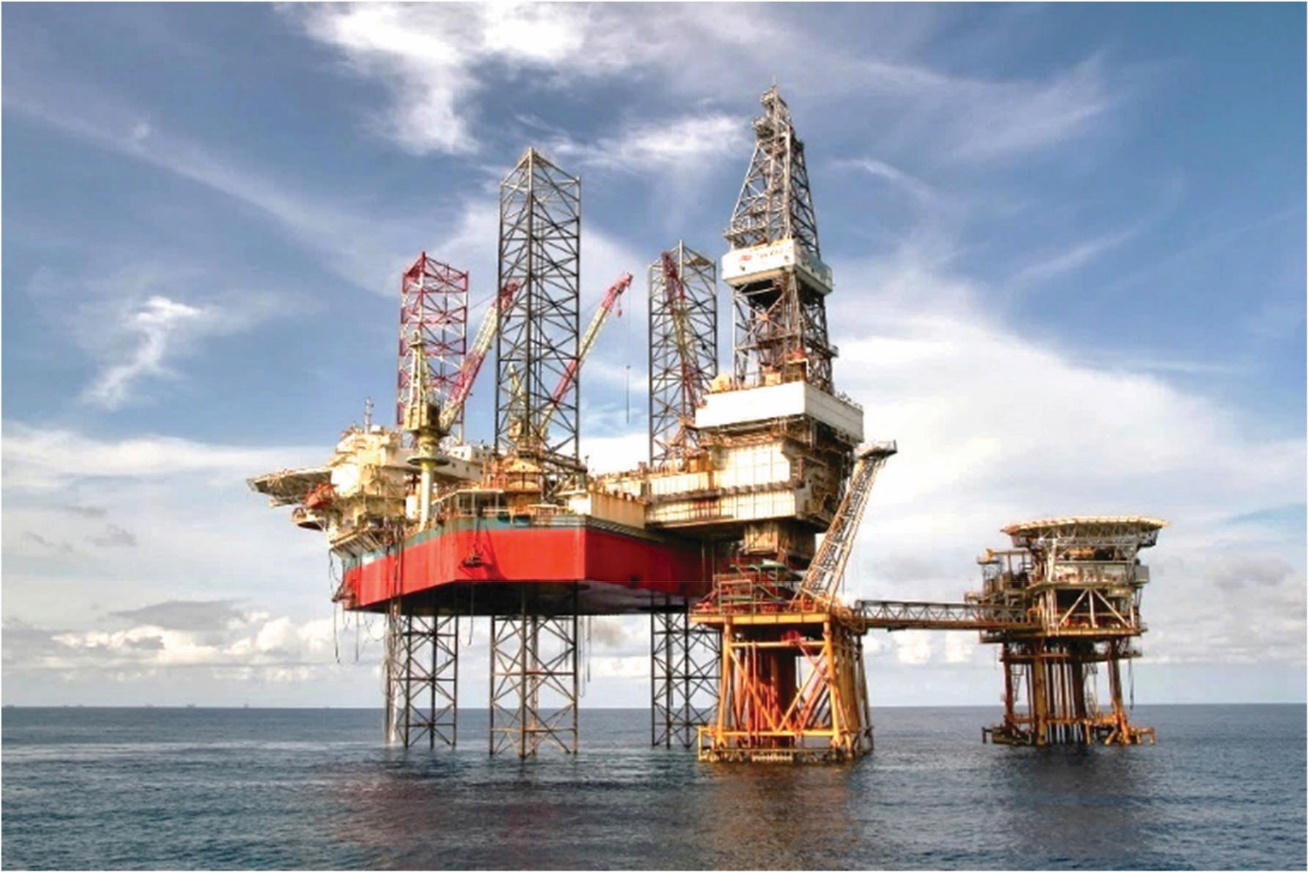
Figure 1 Tam Dao 05 Jack-up rig operating in Vietnam Sea
Slika 1. Tam Dao 05, naftna platforma – Vijetnamsko more
The stability of structural linkages in offshore structures is predominantly influenced by mechanical inaccuracies, which can be effectively managed through advanced precision machining techniques or intelligent algorithms [8]. Furthermore, operational challenges at uncertain connection points can provoke external forces that produce vibrations, causing structural displacements [9-10]. Should these displacement values surpass permissible thresholds, there is a risk of compromising the facility's geometric integrity, potentially culminating in structural failure. Last but not least, Mousavi et al. (2020) utilized Deep Learning (DL) methodologies to accurately assess vibration levels experienced during various operational conditions [11]. Besides, signal inaccuracies during the collection of sensors monitoring data contribute to decreased accuracy in structural health assessments [12]. Data acquisition in harsh environments, such as marine conditions, introduces significant deviations and reduces measurement accuracy [13]. In response, Zhang et al. (2021) [14] proposed a distributed recursive filter to reduce measurement errors caused by environmental disturbances. Most studies mainly focus on improving the quality assessment of operations without considering the overall integrity of the structure.
For offshore projects with complex structures like JuR, monitoring at a local area that has not accounted for the overall kinetic characteristics of the structure can be ineffective. Therefore, Corneliu et al. (2013) [15] examined Sensor Network (SN) configurations to optimize the quality of monitoring datasets. On the other hand, the stability of the construction depends on the uniformity and strong connection between the components, while local measurements can easily miss imbalances in these structural parts. Thus, deploying the MSN at key positions helps collect data over time [16], more accurately reflecting the overall condition of the structure, and providing a more reliable basis for assessing construction health [17-18]. Additionally, processing measurement data with intelligent solutions such as Fuzzy [19] enables the detection of how structural deviations change over time. For large datasets, Artificial Intelligence (AI) provides many advantages in analysis and developing evaluation models [20-21], due to its ability to identify abnormal features in construction data. In which Saadeldin et al. [22] developed a machine learning model to predict the vibrations during drilling operations based on surface data, thereby improving stability and reducing downtime. Altindal et al. [23] proposed an anomaly detection framework for multivariate drilling data, enhancing fault diagnosis capabilities under actual operating conditions. Meanwhile, Puruncajas et al. [24] applied the Convolutional Neural Networks (CNNs) to classify the structural states of jacket foundations using vibration signals, achieving high accuracy without the need for finite element models. In particular, the Siamese Neural Network (SNN) offers potential solutions for quickly detecting abnormal points between datasets [25], and deep learning methods excel in assessing the construction’s status in real time [26].
To enhance the speed and efficiency of processing big data, various popular dimensionality reduction techniques have emerged. Among these, the Principal Component Analysis (PCA) is recognized as a linear method [27]. Although the PCA is computationally efficient and straightforward, it often overlooks nonlinear characteristics and fails to adequately represent the uneven propagation of fluctuations in data from the MSNs. On the other hand, t-distributed Stochastic Neighbor Embedding (t-SNE) is an effective nonlinear technique utilized for data visualization and cluster detection. However, it is sensitive to perplexity parameters, incurs a high computational cost, and struggles to maintain spatial and temporal propagation information [28]. Kernel PCA (KPCA) [29] offers an extension of PCA into the nonlinear realm, enabling the capture of more intricate relationships within the data. The proposed approach also demands significant computational resources and proves challenging to apply to large-scale datasets. In contrast, the FMA excels by directly preserving the propagation process of vibrations in both the spatial and temporal domains [30]. This algorithm capability facilitates the construction of health ridges that reflect the overall structural changes within a building, demonstrating that the FMA algorithm is useful for reducing the dimensionality of measurement datasets derived from MSNs.
This study develops an assessment model for evaluating the overall state of JuR structures using the MCNN. Initially, MSN is strategically positioned at critical locations within the structure to monitor its vibration displacement. Subsequently, a JuR state is constructed using the FMA, enabling a comprehensive evaluation of JuR structures over time by analyzing variations in the ridge profile and the acceleration of ridge peak motion. Finally, this study develops an MCNN assessment model to examine the characteristics of monitoring ridge maps as they change over time. The analysis yields precise assessments of the structural condition, thereby ensuring the safety and integrity of the structure.
The structure of this paper is delineated as follows: Section 2 outlines the implementation phases and objectives of the study, introducing the FMA framework employed to scrutinize data gathered from MSNs. Section 3 elaborates on developing a state assessment model utilizing the MCNN methodology. Section 4 presents various experimental scenarios alongside a discussion of the resulting outcomes. Finally, Section 5 encapsulates the conclusions drawn from the study and digests potential issues for future study.
2. MATERIAL AND METHOD / Materijal i metoda
2.1. Stages and goals / Etape i ciljevi
The structural characteristics of the JuR in operating modes are closely related to the balance between the floor and the leg connections. An overview of the MSN layout and the signal processing process in the proposed model is illustrated in Fig. 2. The JuR structural assessment system consists of three main stages:
Stage 1: Establishing an MSN to measure the vibration at key points of the structure.
Stage 2: Analyzing the vibration data using the FMA to create ridge maps showing structural state.
Stage 3: Developing an assessment model using MCNN to analyze the time evolution of ridge data, thus providing a specific evaluation of the structure’s state.
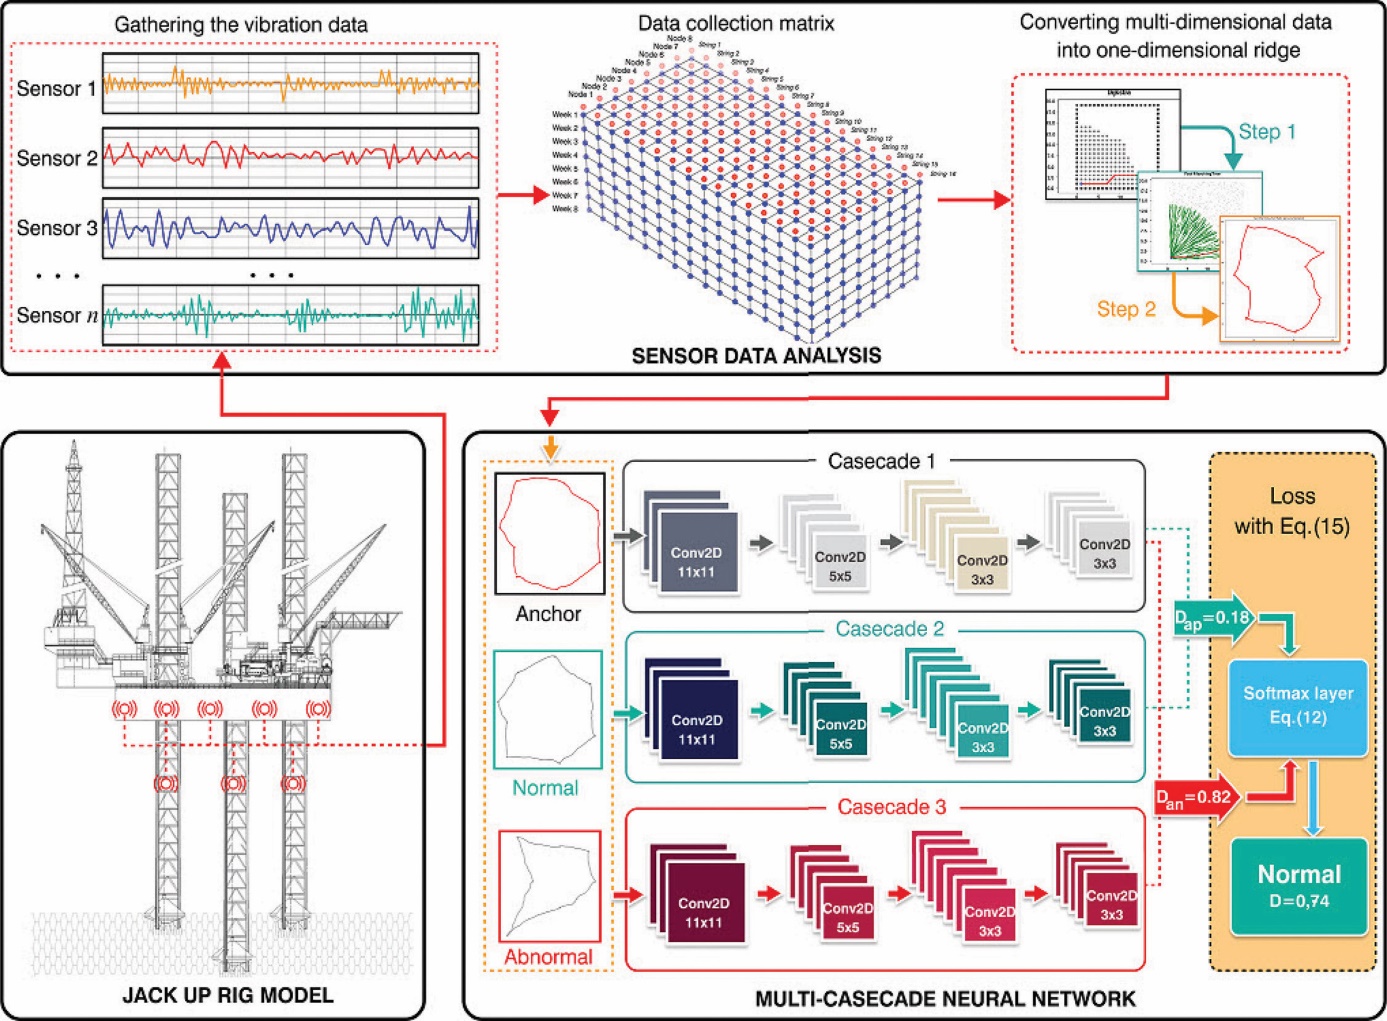
Figure 2 Overview of the MCNN assessment model
Slika 2. Pregled MCNN modela procjene
This study assesses the integrity of the JuR model using vibration data from a monitoring sensor network. We created an MCNN framework with an FMA algorithm that generates ridge maps illustrating the structure's dynamic state. By analyzing these ridge patterns, the framework effectively identifies changes in structural integrity, informs managers on maintenance strategies, and improves the structure's safety and reliability.
2.2. Analyzing the vibration data set / Analiza skupa podataka o vibracijama
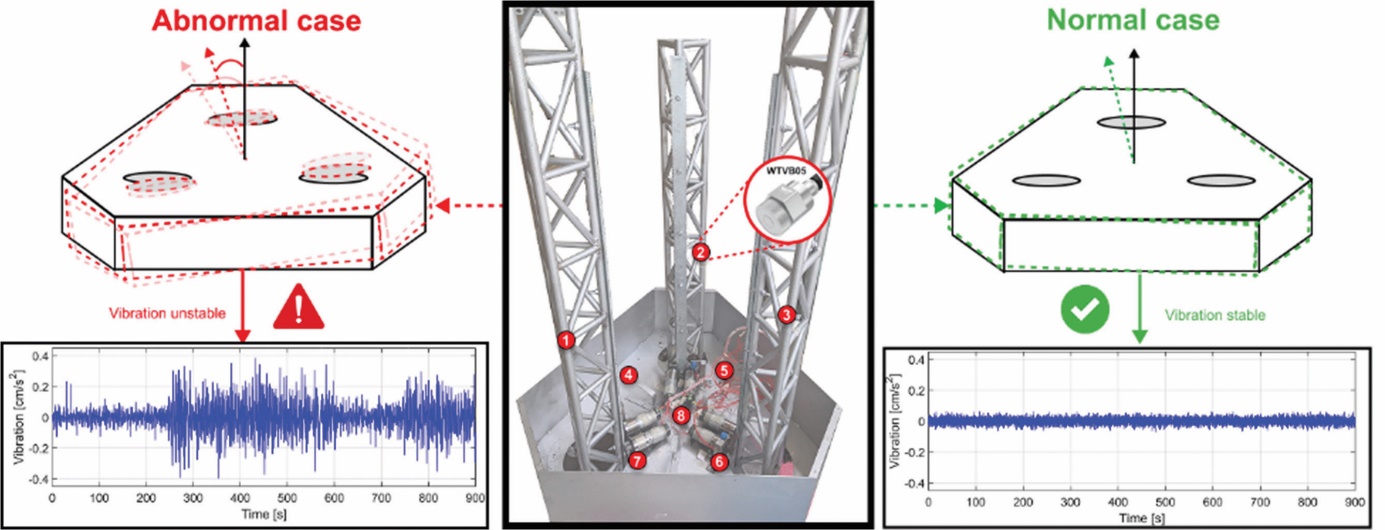
Figure 3 Vibration values measured on the experimental model UT-JuR 01
Slika 3. Vrijednosti vibracija izmjerene na testnom modelu UT-JuR 01
In assessing the stability of the JuR structure, it's essential to ensure uniformity across all locations on the main deck. Additionally, the lifting process must be stable and synchronized at all legs of the rig [31-32]. Conversely, during exploration drilling mode, prioritizing the structure's stability is critical [33]. Consequently, deploying sensors at local points has proven ineffective for evaluating the overall integrity of the structure. This study proposes an assessment solution that employs an MSN to monitor the structure's vibrations [34-35] (expressed in Fig. 3). The collected data will be analyzed and transformed into a ridge map, which illustrates the structural condition through the following two phases:
Phase 1-Gathering the vibration data: The input data undergo preprocessing to eliminate measurement noise and enhance the efficiency of the training process [36]. Data scaling improves the effectiveness of NN training, especially for developing reliable state assessment models. The data are scaled across J columns, ranging from 0 to 1024. Assuming that at k measurements, we take the ith sample for each sensor location j, we have
, with (1)
Let and denote the largest and smallest values in column , respectively. Consequently, the elements of matrix are scaled as
(2)
The authors employed experiments on the UT-JuR 01 model to collect displacement data sets from an SN. The sampling rate was set at 0.1 second, and each measurement lasted for 10 seconds, utilizing an STM32F4 microprocessor. Specifically, the experiments were conducted 16 times per day over a period of 8 weeks, resulting in a total of k = 896 measurements. Each measurement consisted of 100 readings (I) from 8 monitoring sensor points (J). The raw data set from the SN can be represented as [24]
, (3)
From this, the aggregate measurement data matrix is presented as follows:
(4)
Phase 2 - Transforming Multi-Dimensional Data to One-Dimensional Ridges: We utilize the FMA to evaluate construction state data acquired from our sensor network. The process commences with normalizing sensor readings to ensure consistency across the dataset. We then map these measurements onto a mesh grid, establishing connections to the sensor nodes using Dijkstra's algorithm for effective pathfinding. The progression ridges, representing the interrelation of the observed sensor values, are subsequently optimized by applying the Eikonal equation, which incorporates the influence of structural vibrations. This methodology facilitates a comprehensive assessment of the structural condition over time. The data analysis procedure adheres to the steps delineated in Algorithm 1 [37].
This study utilizes Algorithm 1 to analyze the structural state data, yielding a detailed ridge map that characterizes the JuR's structural condition. Algorithm 1 incorporates several quantities, including the sets A, C, and T, along with the threshold values ϵ and δ, as well as (5), all of which facilitate the selection of points on the grid G(x,y). The ridge diagram ℛ is constructed directly from the normalized vibration data, providing an accurate representation of changes in the structural state. In case of the structure is stable, the ridge maintains a regular shape; in contrast, any deformation of the ridge indicates that the structure is in an abnormal condition. The FMA synthesizes multi-dimensional data from measurement sensor points into a unified ridge representation. Consequently, this approach not only evaluates the overall structure effectively but also streamlines the data sampling process, enhancing the precision of the MCNN model.
3. DESIGNING THE MCNN MODEL / Projektiranje MCNN modela
The MCNN model is based on a Siamese neural network architecture using one-shot learning, allowing for a multi-cascade network for classification by comparing feature vectors. The ridge dataset is divided into three subsets: Anchor (reference for comparison), Normal (low-level non-dangerous vibrations), and Abnormal (states with intense vibrations that may lead to collapse).
Table 1 Structure of each cascade in the MCNN model
Tablica 1. Struktura pojedine kaskade unutar MCNN modela
| Block-layer | Name | Size/ Value |
|---|---|---|
| 1 | ReflectionPad-Convolutional-ReLU | Kernel-size: 11×11 |
| 2 | BatchNorm | |
| 3 | ReflectionPad-Convolutional-ReLU | Kernel-size: 05×05 |
| 4 | BatchNorm | |
| 5 | ReflectionPad-Convolutional-ReLU | Kernel-size: 03×03 |
| 6 | BatchNorm | |
| 7 | ReflectionPad-Convolutional-ReLU | Kernel-size: 03×03 |
| 8 | Fully Connected | |
| 9 | Sigmoid [38] | [0,1] |
The MCNN assessment model utilizes multiple network cascades to extract features from three datasets simultaneously. It compares combined feature dissimilarities, updates model weights, and refines predictions to enhance accuracy. Each network layer shares the same architecture for concurrent feature extraction, with components detailed in Table 1. The convolutional layers are described by kernel k(x,y) of a predefined size (m,n) as
(6)
Besides, the padding layer is employed to improve the extraction of critical features as
(7)
The ReLU activation layer is primarily used to eliminate negative values when processing image of ridges input into the MCNN network. The ReLU is computed as follows:
(8)
The Max-Pooling are expressed as [39]
(9)
To prevent overfitting in the layers [40], bias is reduced by normalizing the retention ratio of nodes. In other hand, dropout is applied with a dropout probability p as
10
The Softmax function [41] in the MCNN structure ensures that final layer outputs have the highest probability, simplifying use for end users and aiding further computations.
(11)
The comparison of the dissimilarity of features between input ridges is determined by
(12)
(13)
where , and represent the ridges in three datasets: Anchor, Normal, and Abnormal, respectively. The values and are feature vectors extracted through the convolutional layers. To evaluate the convergence of the assessment model through the training process, the loss function is used to optimize the dissimilarity as [42]
(14)
We get , the dominant class score can be represented as . The dissimilarity is defined as
(15)
where denotes the sigmoid function with being a positive parameter that controls the sharpness of the mapping.
4. RESULTS AND DISCUSSIONS / Rezultati i rasprava
4.1. Configuration parameters / Konfiguracijski parametri
The training process of the MCNN model employs a dataset derived from the UT-JuR 01 model structure condition analysis. The UT-JuR 01 model was designed based on the TAM DAO 05 rig with a scale of 1:100. Besides, the WitMotion WTVB05-485/CAN vibration sensors were installed at eight monitoring points on the hull and legs of the rig, combined with an STM32F4 microcontroller to collect data. The main parameters of the testing model are summarized in Table 2.
Table 2 The testing model parameters
Tablica 2. Parametri testnog modela
In this paper, the dataset for training and testing was formed from ridges obtained during an 8-week measurement campaign on the UT-JuR 01 experimental model, with 16 measurements per day at eight sensor locations, each lasting 10 seconds. After preprocessing (noise filtering and normalization), the entire dataset was transformed into ridge maps using the FMA. The ridge dataset was categorized into three sets: Anchor, Normal, and Abnormal. Notably, the ridges used for the testing dataset were selected from samples not included in the training process, thereby ensuring objectivity in the evaluation. The specific division is outlined in Algorithm 2, which classifies 215 ridges as Normal, 501 ridges as Abnormal, 90 ridges for validation, and 90 ridges reserved for testing. The authors configured the training parameters, including a batch size of 2, epochs of 200, a learning rate of 0.00055, and a contrastive loss [43]. These settings were optimized to achieve model convergence, as illustrated in Fig. 4.
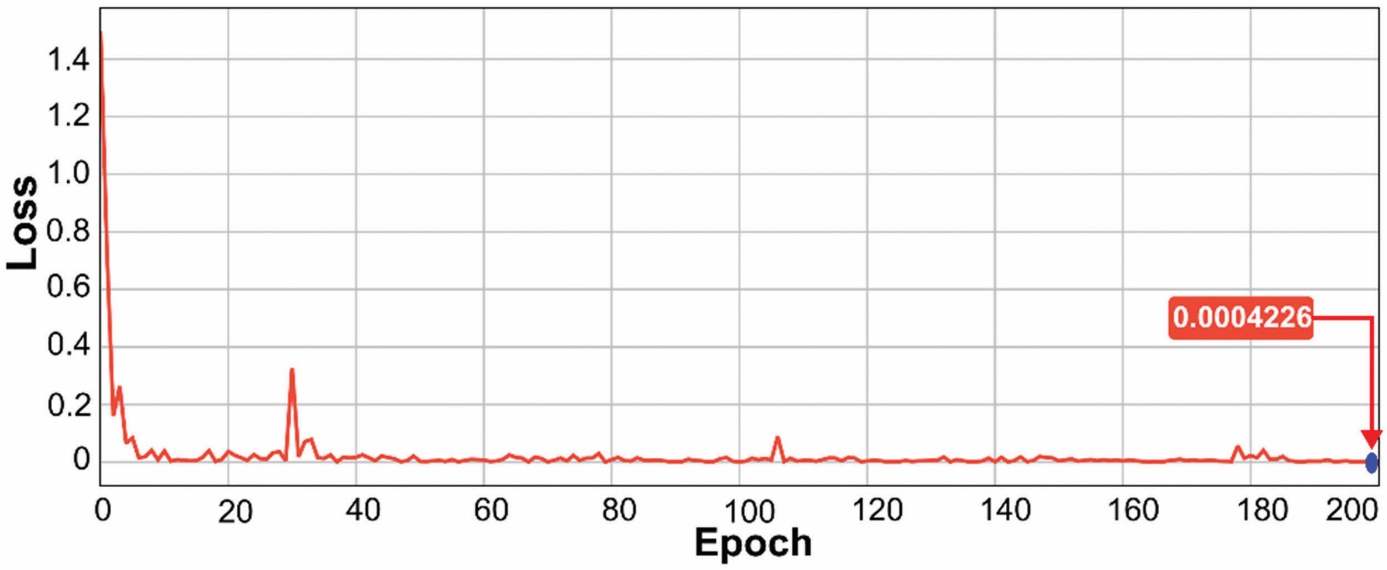
Figure 4 The regression of MCNN model training process
Slika 4. Regresija tijekom procesa treniranja MCNN modela
The results presented in Fig. 4 indicate that the value of the loss function gradually converges to a final result of 0.0004226. In this study, the SNN architecture with triple loss is chosen to enhance the separation between Normal and Abnormal states. The parameter α in (14) acts as a sensitivity control threshold. If the characteristic distance between Anchor and Normal is less than α, it indicates stability. Conversely, if the distance between Anchor and Abnormal exceeds α, it signifies an abnormal state. The α value and the learning rate are adjusted by testing multiple times on the experimental data set to ensure stable convergence, reduce the loss value, and optimize response quality. In addition, the dataset was divided into three subsets: 80% for training, 10% for validation, and 10% for testing. The hyper parameters of the MCNN were tuned based on validation performance, and an early stopping criterion was employed to prevent overfitting. This procedure enabled the model to achieve better performance on the training data while maintaining generalization capability on unknown data. Furthermore, after the MCNN model extraction process, we evaluated the reliability of the proposed model by using the accuracy function as
(16)
therein TP stands for True Positive, while FP denotes False Positive. Conversely, TN indicates True Negative, and FN represents False Negative.
Table 3 Comparison of the parameters of convolutional neural networks in training assessment models
Tablica 3. Usporedba parametara konvolucijskih neuronskih mreža u modelima za procjenu treniranja
The authors utilized ridge data detailing the structure states over time as training input for the proposed model and comparison algorithms like GoogleNet [44] and AlexNet [45]. Both evaluation models were built using the same parameters: 200 epochs and an input shape of 300×300×3. The initial models had 144 layers for GoogleNet and 24 for AlexNet, as presented in Table 3. The evaluation results show that the accuracy of the CNN comparison models is not as good as the proposed MCNN model. Specifically, the GoogleNet algorithm achieved less than 66.7% accuracy, while AlexNet achieved 79.41%. However, the training process for GoogleNet was time-consuming, up to 40 minutes. The training result outcomes indicate better training efficiency and accuracy performance compared to traditional single-cascade convolutional networks. This result demonstrates the efficiency of the multi-cascade architecture in handling limited datasets. To further clarify, AlexNet and GoogleNet are selected as baselines due to their popularity and their role as reference standards in conventional CNN studies. The proposed MCNN utilizes the SNN architecture with triplet loss to optimize feature distances between normal and abnormal states, which leads to improved classification performance.
4.2. Results / Rezultati
4.2.1. Establishing the ridges / Definiranje stanja
Offshore construction assessment scenarios were evaluated using the UT-JuR 01 model. A simulation environment was established to test vibration impacts at weak points, reflecting the effects of JuR during typical operations. The study focuses on two states of JuR structures: low-frequency vibrations, representing a regular operation, and high-frequency vibrations, indicating unusual stresses. Results detailing structural state contours are shown in Fig. 5, with Fig. 5a displaying vibration amplitude over time and its normalization, while Fig. 5b illustrates the data analysis leading to the structural state ridges.
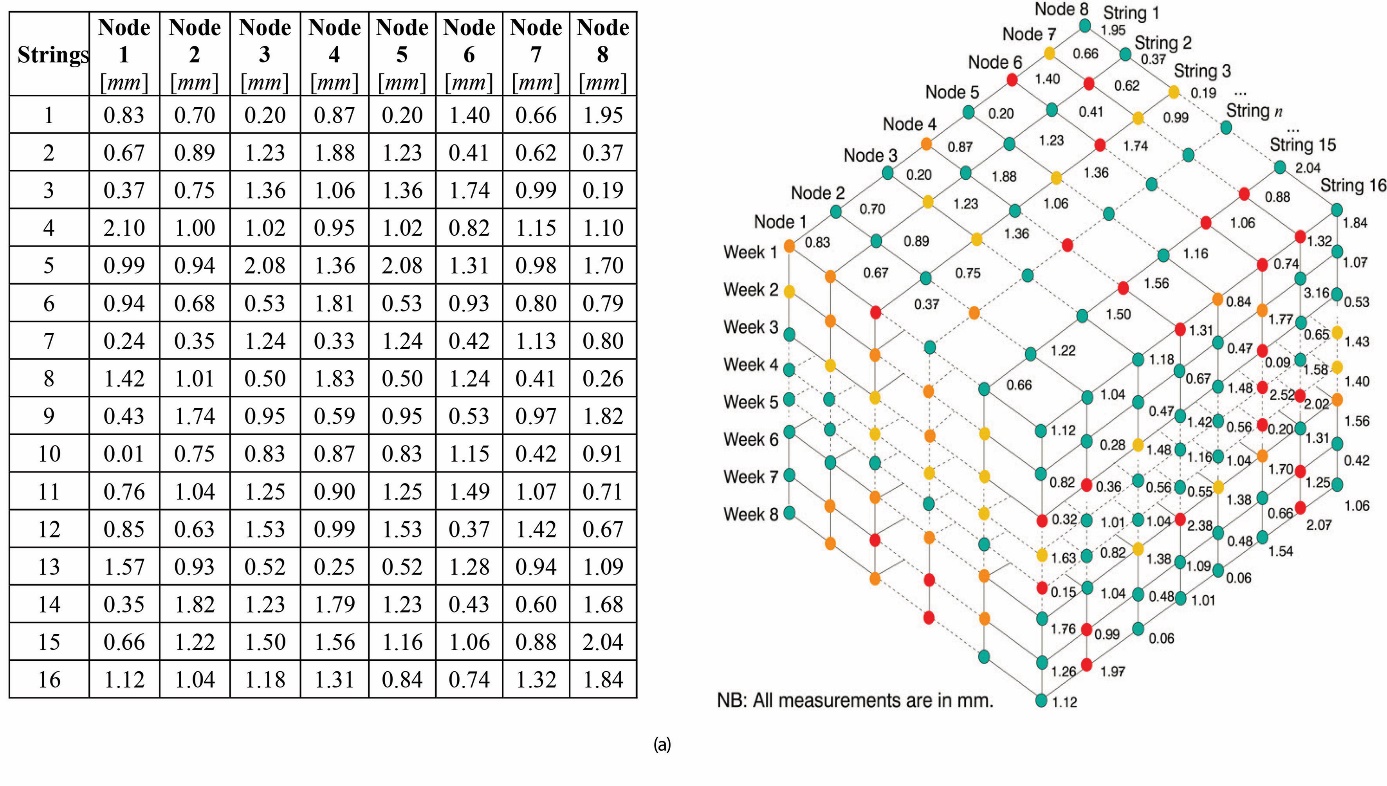
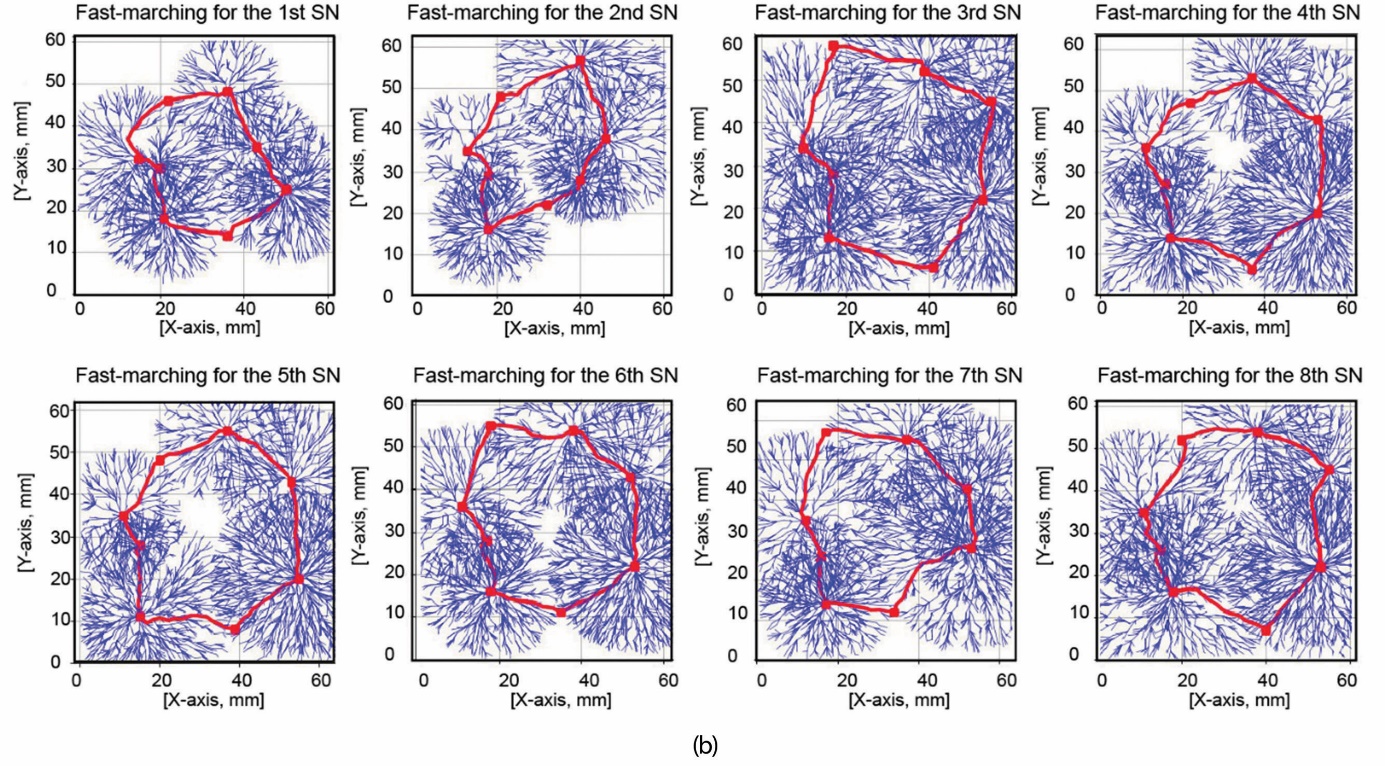
Figure 5 Results of collecting and analyzing structural states data
Slika 5. Rezultati prikupljanja i analize podataka o strukturnim stanjima
Remark 1: Vibration measurement and storage (Fig. 5a) - The vibration amplitude of the structure is measured using an MSN, then synthesized and temporarily stored as a data array over time. The raw data is pre-processed through ADC signal conversion and noise filtering, which is managed by the STM32F4 central processor. Each stored data array contains 16 data strings corresponding to 16 measurements taken each day, with each measurement spaced 90 minutes apart. This setup allows the vibration data arrays to capture information on changes in the overall structure over time while also optimizing data storage capacity on the server. Subsequently, the data arrays are organized into a confusion matrix, facilitating convenient storage and aiding in the development of effective data analysis solutions.
Remark 2: Analysis of data strings related to the structural stages of ridges (Fig. 5b) - Algorithm 1 is utilized to examine the JuR model states data arrays over time, using a confusion matrix. This process involves organizing the data nodes into a grid map measuring 60mm×60mm. The FMA algorithm connects these nodes to form a ridge that reflects the construction status. Changes in the shape of the ridges, combined with variations in the position of the peaks, indicate the overall state of the structure.
In this study, the JuR structural health ridges were constructed from structural vibration data measured from the MSN. Specifically, as illustrated in Fig. 5b, the 4th and 6th ridges have radial ridge peaks with uniform spacing; the ridge-to-ridge peak-to-ridge lines have evenly distributed areas without bends, reflecting the balance of the hull. In the case of the hull moving synchronously, there are no large oscillations that cause the hull to lose balance. On the contrary, as shown in the 2nd ridge, there are unevenly distributed local deformation areas, especially the ridge lines connecting the bend peaks, which show the imbalance in force transmission between structural components, which may originate from abnormal loads or resonant vibrations. Thus, the ridge characteristics not only have mathematical meaning in the data analysis process but also directly reflect the physical mechanism of the stable ridge (4th and 6th ridges), indicating the synchronization and safety of the structure, whereas the deformed ridge (2nd ridge) shows the appearance of anomalies that potentially lead to a decrease in the connection capacity. Based on these observations, the ridges representing the construction states over time are compiled into a dataset for the MCNN training process, with detailed results presented in the following section.
4.2.2. Assessing the state of the JuR structure / Procjena stanja strukture platforme
The MCNN model evaluates the state of the JuR structure by computing dissimilarity values between different states through two cascades. In the first cascade, the model compares the dissimilarity between the Anchor ridge and the Normal ridge to determine the Dap value (12). In the second cascade, the Anchor ridge is compared with the Abnormal ridge to obtain the Dan value (13). The final dissimilarity value D is determined based on the loss evaluation (14) and is characterized by the state identified as either Normal or Abnormal, as illustrated in Fig. 6a. In the experimental scenario, values collected from the SN are evaluated in real-time and presented through visual results using the D coefficient. Additionally, the data will be stored and analyzed over a period of eight consecutive weeks, creating a historical state of the structure, as illustrated in Fig. 6b. The results indicate that the proposed solution is effective for monitoring the overall health of offshore structures, providing timely warnings in instances of prolonged vibrations and sudden increases in the D coefficient value.
The MCNN assessment model uses two coefficients, Dan and Dap, which sum to 1. The state classification determined by these coefficients shows a smaller deviation value. As shown in Fig. 6a during the fourth measurement, Dap is equal to 0.13, which is less than Dan, indicating a normal state. Based on the classification and calculation results from the Softmax layer, the final assessment of the overall structure's condition includes both its current state and the reliability coefficient D. Fig. 6b displays the monitoring results over eight weeks, from December 2, 2024, to January 25, 2025. Although the coefficient D shows fluctuations, abnormal values occur infrequently and remain low (not exceeding 0.8). Therefore, it can be concluded that the JuR structure is in a normal state during the monitoring period. However, it is essential to enhance the test scenarios for the proposed algorithm to develop a sample data set that better supports the detection of additional levels of abnormality.
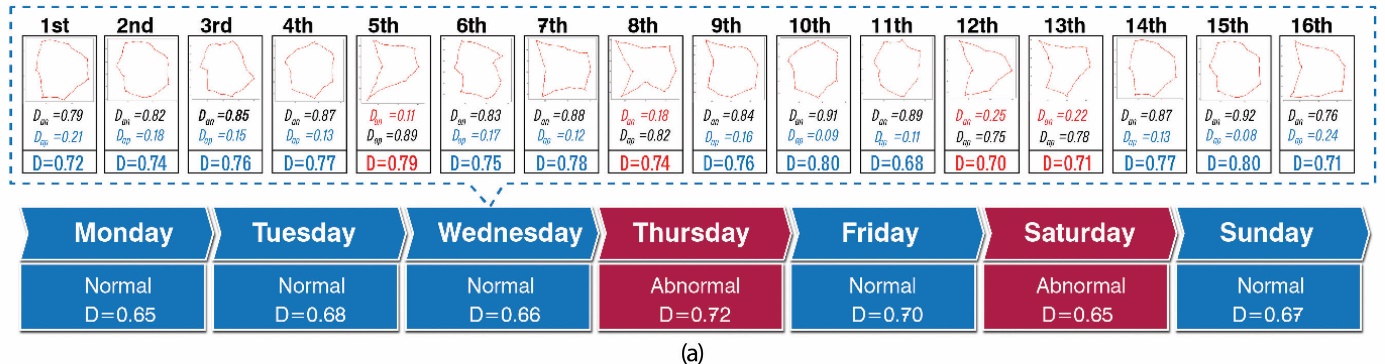

Figure 6 Results of the assessment of the JuR model state applying the MCNN model
Slika 6. Rezultati procjene stanja JuR modela primjenom MCNN modela
5. CONCLUSION / Zaključak
This study introduces a methodology utilizing the MCNN to analyze vibration data to assess the health of offshore structures. Then, MSNs are strategically deployed at critical points on the structure to capture vibration metrics. The collected data is compiled into a confusion matrix for subsequent analysis with Algorithm 1, facilitating the creation of a comprehensive dataset that characterizes the structural condition. Over time, this dataset serves as input for training the MCNN model (via Algorithm 2), enabling the model to extract pertinent features that effectively classify the operational state of the structure as Normal or Abnormal based on the derived D value. This classification aids management in formulating targeted maintenance strategies, thereby ensuring the safety of both personnel and infrastructure. In future directions, this study aims to expand the experimental scope by simulating data under various noise conditions and constructing hypothetical scenarios involving sensor failures, such as signal loss, measurement errors, or signal delays. Concurrently, the MCNN architecture will be refined to enhance computational efficiency and better meet the demands of real-time monitoring. Additionally, a promising avenue for future research is the exploration of processing data from sensor networks in a time series format. This approach has the potential to streamline data analysis and significantly reduce response times, thereby enhancing the overall efficiency and responsiveness of the system.
Authors Contributions: X.-K. D.: Conceptualization, Methodology, writing – review and editing; V.-D. D.: Formal analysis, numerical data calculation, writing - original draft preparation; Ž. K.: Review and editing; N.-T. N.: Data curation and computing.
Conflict of interest: The authors state that there is no conflict of interest.
Acknowledgement: The authors acknowledge the facilities, scientific and technical support from Artificial Intelligent Transportation LAB, Ho Chi Minh City University of Transport and Maritime Department, University of Dubrovnik, Croatia.
Acknowledgement of AI or AI-assisted tools use: During the preparation of this paper, the authors used Grammarly in order to clarify and summarize the text. After using Grammarly the authors reviewed and edited the content as needed and take full responsibility for the content of the published article.