
1. Introduction
Drought is a feature of climate of many European countries, not only in South Europe. The difference between drought and other disasters is that drought occurs slowly. Its effects accumulate and occur over a long period of time and may be observed years after the end of the dry period and affect a wider geographical area than the area which is directly affected by the disas- ter (European Communities, 2007). Common to all types of drought is a lack of precipitation (WMO, 1993). Despite that the precipitation is the main factor controlling the drought the air temperature also plays an important role affect- ing evapotranspiration. Often a number of meteorological elements as high tem- peratures, strong winds and low relative humidity occur in conjunction with the drought. One of the most intensive droughts was observed in 2003, when over 100 million people and one third of the EU territory were affected. Economic losses from drought in Europe in 2003 were approximately 13 billion US$ (DG JRC, 2005).
Recently the interest to study drought in Slovakia increases (Klementová and Litschmann, 2003, 2004;Pecho et al., 2008;Zuzulová et al, 2014;Climate Atlas of Slovakia, 2015).Pecho et al. (2008) point out that climate in the region of South-west Slovakia transformed from the warm and dry to warm and very dry in the 20th century.Zuzulová et al. (2014) studied evolution of drought in Slovakia for the period 1951–2010 and have found decreasing trend of PDSI for Slovakia for the period 1951–1980 and increasing for 1981–2010. The authors explained the positive tendency for the second period with the extremely wet year 2010. The drought in the main agricultural regions of Slovakia is investigated byŠiška and Takáč (2009),Labudová et al. (2015) andTakáč (2015) on the basis of climatic conditions during the growing season and evapotranspiration deficit. The results from the investigations show that on the background of climate change the agricultural regions of Slovakia will become more sensitive on drought occurrence in comparison to the period 1961–1990.
The aim of present paper is to analyse the occurrence of atmospheric drought in lowlands in Slovakia in terms of its dynamic, intensity, seasonal and territori- al differences. In order to determine the drought and to achieve the aim of the study Standardised Precipitation Index (SPI) and Standardised Precipitation Evapotranspiration Index (SPEI) were calculated. The topicality of the presented research work is determined by the fact that the analysis of drought on the basis of SPI and SPEI is a relatively new topic for Slovakia which is not well investi- gated for the country. From other point of view, the knowledge about the occur- rence and intensity of drought could be used in water resources management and for effectively coping with the environmental and economic problems related to water scarcity and drought.
2. Materials and methods
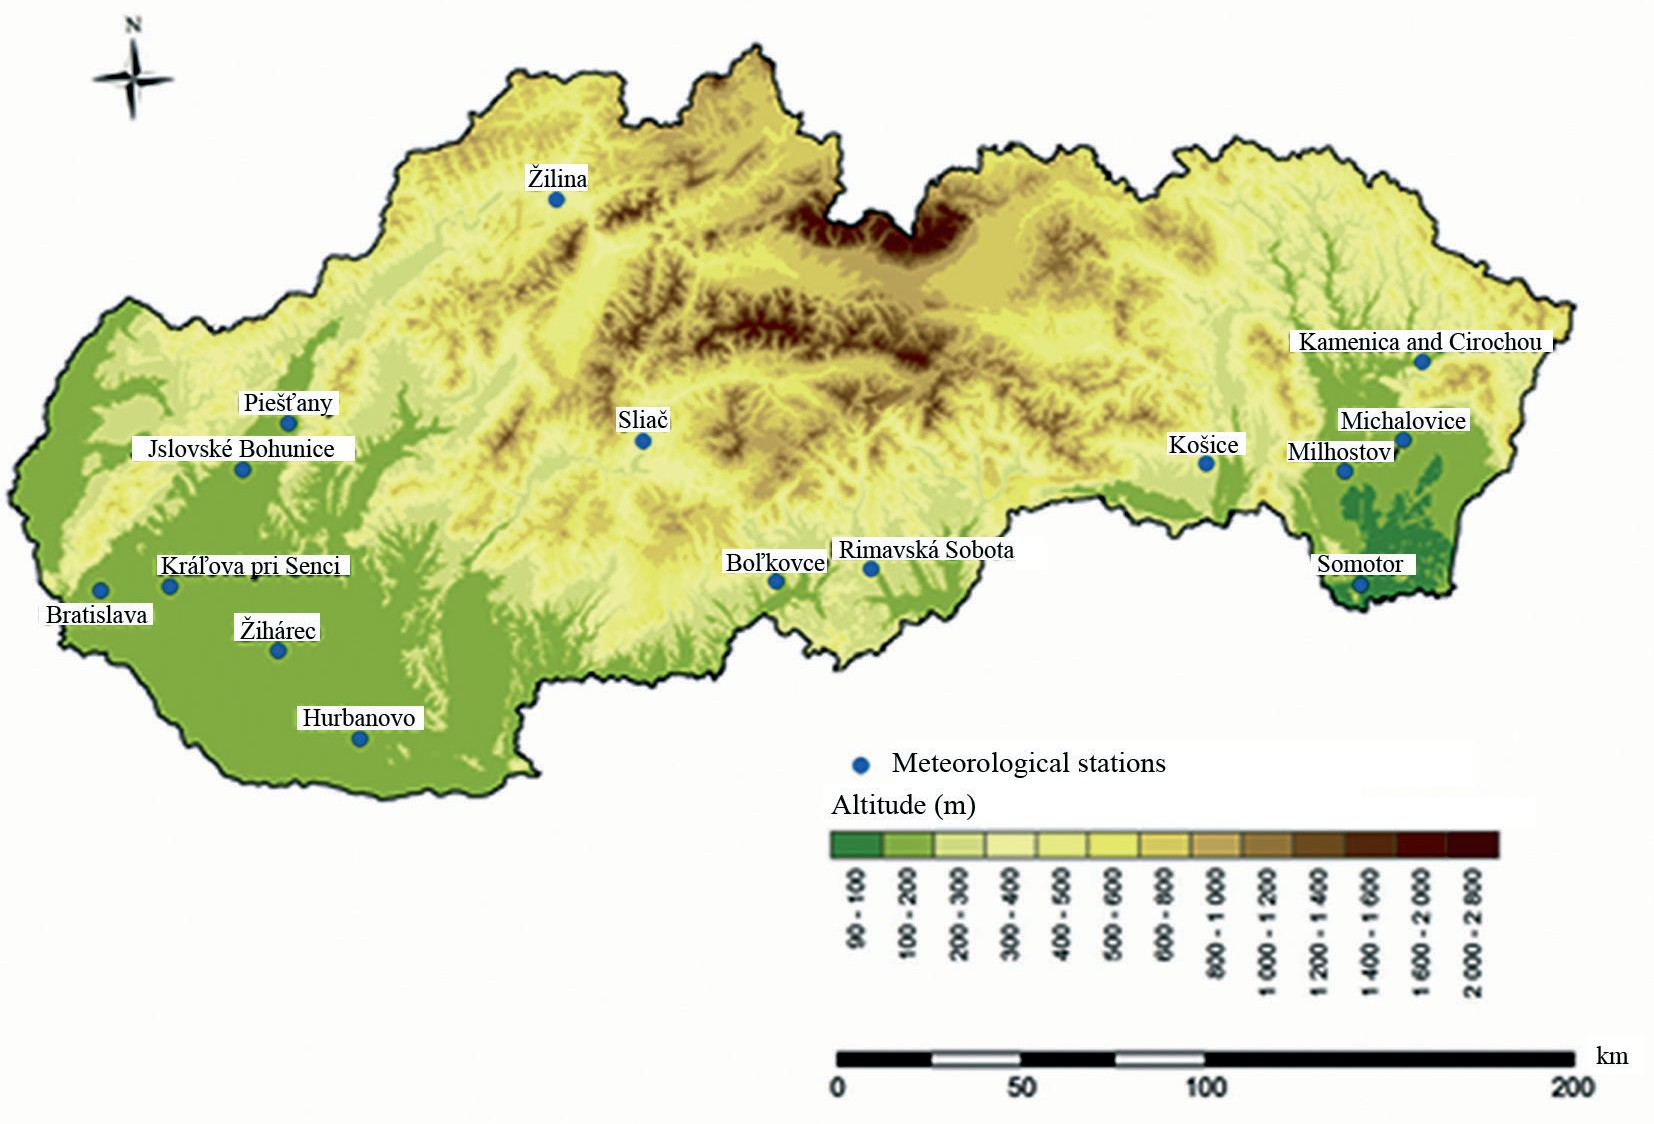
The drought in lowlands in Slovakia is characterized on the basis of monthly precipitation and air temperature for the period 1961–2011 from 15 meteorologi- cal stations situated at the regions with the different geographical features (re- lief, atmospheric circulation, regime of the main climatic elements). The data were provided by Slovak Hydrometeorological Institute (SHMI). The meteoro- logical stations used for the research are situated in the territories favorable for development of agriculture. According to their geographical location the stations are grouped into three groups: 1) lowlands and lower hollows in East Slovakia (Somotor, Milhostov, Michalovce, Kamenica and Cirochou and Košice); 2) low- lands in West Slovakia (Bratislava, Hurbanovo, Kráľová pri Senci, Jaslovské Bohunice, Žihárec and Piešťany) and 3) river valleys and lower hollows in Central Slovakia (Boľkovce, Rimavská Sobota, Sliač and Žilina),Fig. 1. The stations form the first two groups (except Košice, 229 m) are situated at the altitude lower than 200 m a.s.l. and the stations form third group have the altitude between 214 m a.s.l (Boľkovce) and 365 m a.s.l (Žilina).
Future changes in occurrence of drought in Slovakia are determined on the basis of model data (modified outputs of two Regional Circulation Models, shortly RCMs, KNMI – Dutch and MPI – German, selected from 15 RCMs) for tempera- ture and precipitation at three meteorological stations: Hurbanovo, Jaslovské Bohunice and Milhostov (Lapin et al., 2012). These models belong to the newest category of so-called coupled atmosphere-ocean models with detail network of grid points. The regional climate change models KNMI and MPI represent a de- tail integration of the atmospheric and oceanic dynamic equations with grid points resolution 25 km × 25 km. The KNMI and MPI RCMs have 19 × 10 grid points (190) in Slovakia and its neighbourhood with a detailed topography and appropriate expression of all topographic elements larger than 25 km. Downscaling of these RCMs outputs to needed sites in Slovakia was done by the method of statistical modification of daily data at use of measured climatic data from the period 1961–1990. This method enables to design daily climate change scenarios of basic climatic variables close to the measured means, variability and extreme values in the period 1961–1990 and with physical plausibility among basic variables (mean, minimum and maximum air temperature, mean relative air humidity, mean global radiation and mean precipitation totals) in the whole period 1951–2100. They showed further significant increase in mean air temperature and important changes in the precipitation and water balance variables (increase of precipitation in winter and northern Slovakia and decrease or no change of precipitation in summer and southern Slovakia).
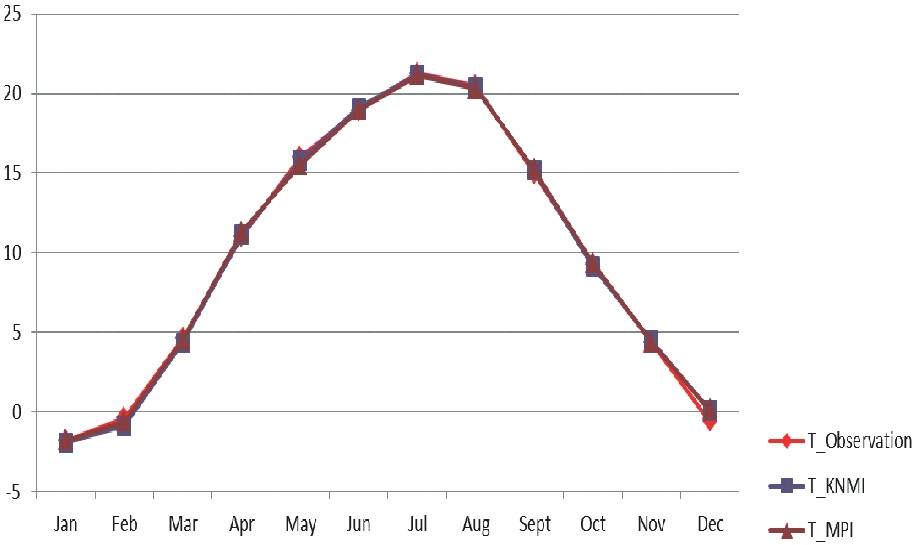
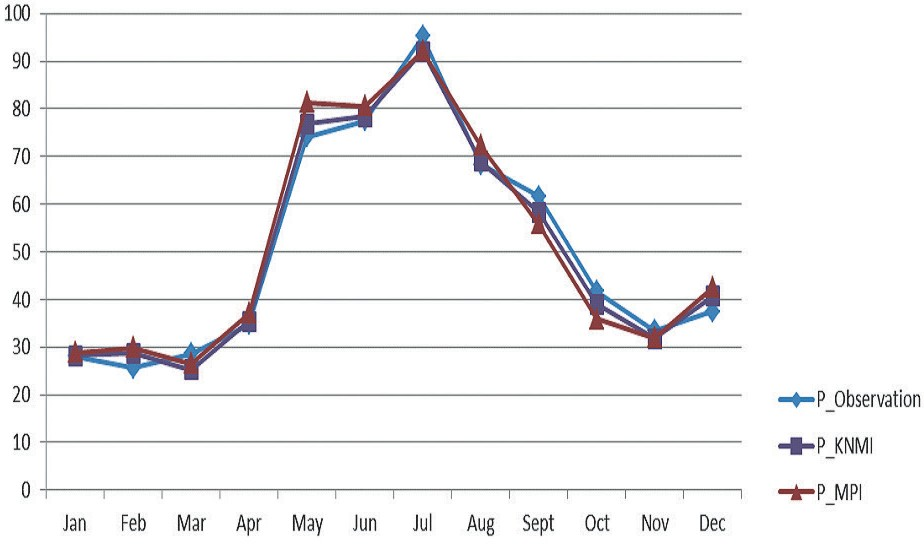
Comparison between observed data and scenarios data for air temperature and precipitation in the period 2001–2011 is shown inFig. 2 as an example. The results confirm good reliability of data sets and the results from the present work. More details on the statistical downscaling method of RCMs output and on model data reliability is discussed inLapin et al. (2012).
The occurrence of drought events with various duration and intensity is de- termined by Standardized Precipitation Index (SPI) and Standardized Precipitation Evapotranspiration Index (SPEI). In 2010 WMO selected the SPI as a key meteorological drought indicator to be produced operationally by the meteorological services (JRC, EC, 2011). The main advantage of the SPI in com- parison to other indices is the fact that the SPI enables determination of drought conditions at different time scale. Many studies have indicated the usefulness of the SPI to quantify different drought types (Szalai et al., 2000;Lloyd-Hughes and Saunders, 2002;Vicente-Serrano and López-Moreno, 2005). In the present research SPI and SPEI are calculated for 1 and 3 months scales. SPI-1 and SPEI- 1 allow determining drought events on monthly level. On the basis of SPI-1 we analyzed maximum continuous duration of drought with various intensity: mild (near to normal), moderate, severe and extreme drought. The frequency of occur- rence of moderate, severe and extreme drought is determined using SPI-1 and SPEI-1. The frequency of drought occurrence is determined on the bases of total number of moderate, severe or extreme dry events for the period 1961–2011 divided on the number of years (51). The SPI-3 is the best related with soil mois- ture, which respond to precipitation anomalies on a relatively short scale. Because of this SPI-3 can be successfully used for the estimation of occurrence of agricultural drought.
The minimum precipitation record for calculating the SPI is 30 years, but some authors (Wu et al., 2005) recommend using time series of 50 or more years. In the presented study SPI is calculated on the basis of 51-years period – 1961– 2011. Future dry events are determined on the basis of model data (RCMs - KNMI and MPI) for stations Hurbanovo, Jaslovské Bohunice and Milhostov for two periods: 2001–2050 and 2051–2100. The value of the SPI gives a measure of the severity of dry event as follow: mild drought – the events when SPI is be- tween 0 and –0.99, moderate drought with SPI between –1 and –1.49; severe drought – SPI vary from –1.5 to –1.99 and extreme drought with SPI –2 and bel- low (McKee et al., 1993;Ceglar et al., 2008).
The software provided by the National Drought Mitigation Center, University of Nebraska (http://drought.unl.edu/MonitoringTools/Climate DivisionSPI. aspx, accessed by 3 February 2016), is used for calculation of SPI.
The calculation of SPEI according to the method ofVicente-Serrano et al. (2010)(http://digital.csic.es/handle/10261/10002, accessed by 3 February 2016). The SPEI is calculated at the same levels as SPI: 1- and 3-months and the intensity of drought is determined using the same scale: moderate drought with SPEI be- tween –1 and –1.49; severe drought – SPEI vary from –1.5 to –1.99 and extreme drought with SPEI –2 and bellow. As SPI the SPEI are analysed also on the ba- sis of observation data for the period 1961–2011 and model data for the periods 2001–2050 and 2051–2100.
In order to estimate seasonal drought, we use SPI-3 and SPEI-3. For winter we extracted the values for February which is based on the total rainfall for December, January and February, for spring we took SPI-3 and SPEI-3 for May (March, April and May), for summer – the values of the indices for August (June, July and August) and for autumn – the indices for November (September, October, November).
The stations are grouped according to SPI-3 and SPEI-3 by cluster analysis using complete linkage, Euclidian distances.
3. Results and Discussion
3.1. Duration and frequency of dry events
The maximum continuous duration of drought is determined on the basis of SPI-1. For mild drought the maximum continuous duration is between four and nine months (Tab. 1). There are not any territorial differences in occurrence of mild drought. Moderate drought continues maximum two months (except sta- tion Bratislava, 1 month). Two consecutive months with moderate drought have been observed mainly in 80’s and in the beginning of 90’s. The difference is es- tablished for the eastern part of Slovakia where two consecutive months with moderate drought are observed at the beginning of the 21st century. In the cen- tral part of the studied area severe drought continues longer than in other re- gions. Here maximum duration of drought for the period 1961–2011 is two months in Boľkovce and Rimavská Sobota and three months in Žilina while in the rest part of investigated area, except Bratislava and Košice, the severe drought does not continue longer than one month. The maximum continuous duration of extreme drought is longer in eastern part of Slovakia where in all of stations except Somotor, maximum number of consecutive dry months is two. The same is observed in separate stations from other part of the country as Bratislava, Piešťany and Žilina. The difference is that 2-months maximum du- ration of extreme drought in western part of Slovakia occured in 2003 while in other parts of investigated area it happened mainly in the first half of studied period.
the frequency of occurrence of moderate, severe and extreme drought is deter- mined. The frequency of moderate and severe drought established by SPEI-1 is higher than one determined by SPI-1 which shows that the temperature has an important role for establishing of moderate and severe drought at monthly level. On the other side the SPEI-1 shows decreasing of frequency of extreme drought determined by SPI-1, (Tab. 2.). This allows us to conclude that in the most of cases precipitation is the main factor for occurrence of extreme drought.
The SPI-1 and SPEI-1 calculated on the basis of model data (KNMI and MPI) for two periods (2001–2050 and 2051–2100) show generally future increasing of frequency of occurrence of dry events comparing to these one determined by the measurements for the period 1961–2011. The increasing of number of dry months is due to the increasing of cases with severe drought for the periods 2001–2050 and 2051–2100 (Tab. 3).
The occurrence of moderate drought in the future will be quite similar as one in 1961–2011, and there will be a little decreasing of extreme dry months.
The comparison between SPI and SPEI calculated on the basis of model data for both periods (2001–2050 and 2051–2100) shows similar results as the observation data – the frequency of moderate and severe drought determined by SPEI is higher than one established by SPI. This fact could be explained by the increasing of air temperature in the 21st century. On the other side the SPI and SPEI show that the extreme drought is mostly related to lack of precipitation.
3.2. Seasonal peculiarities of drought occurrence
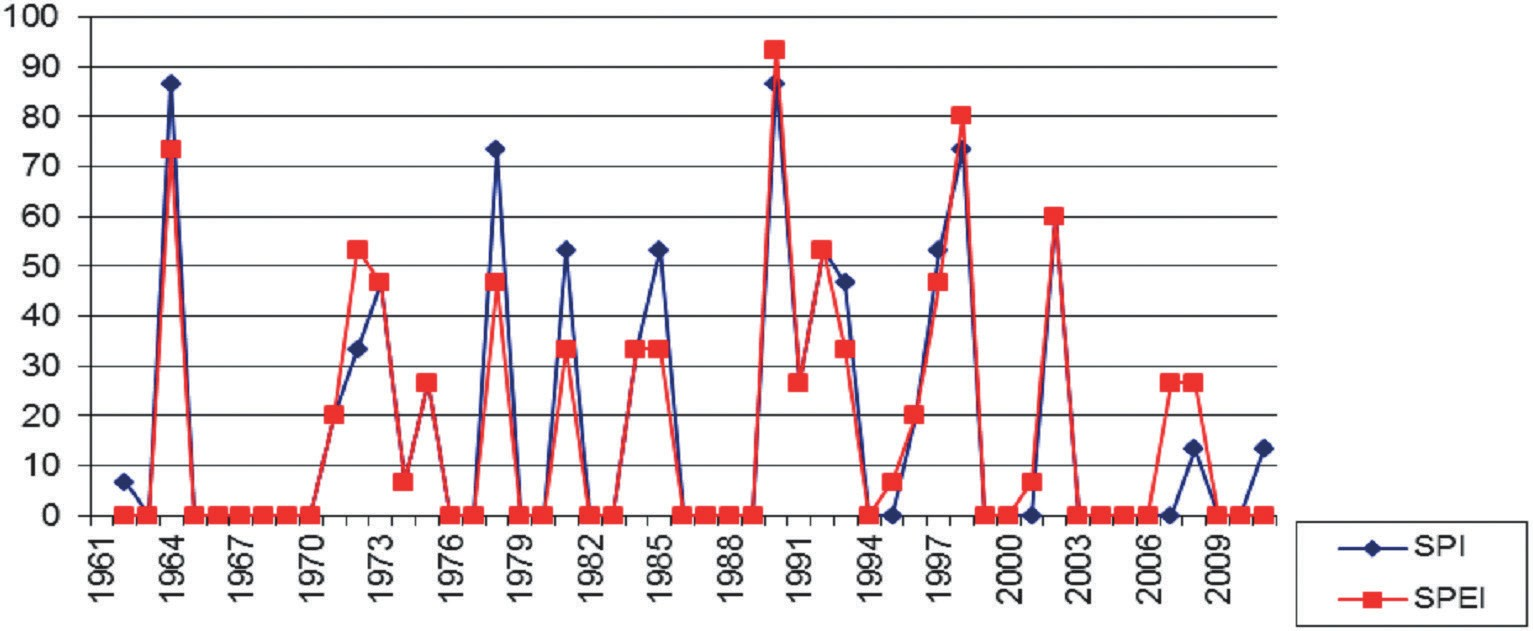
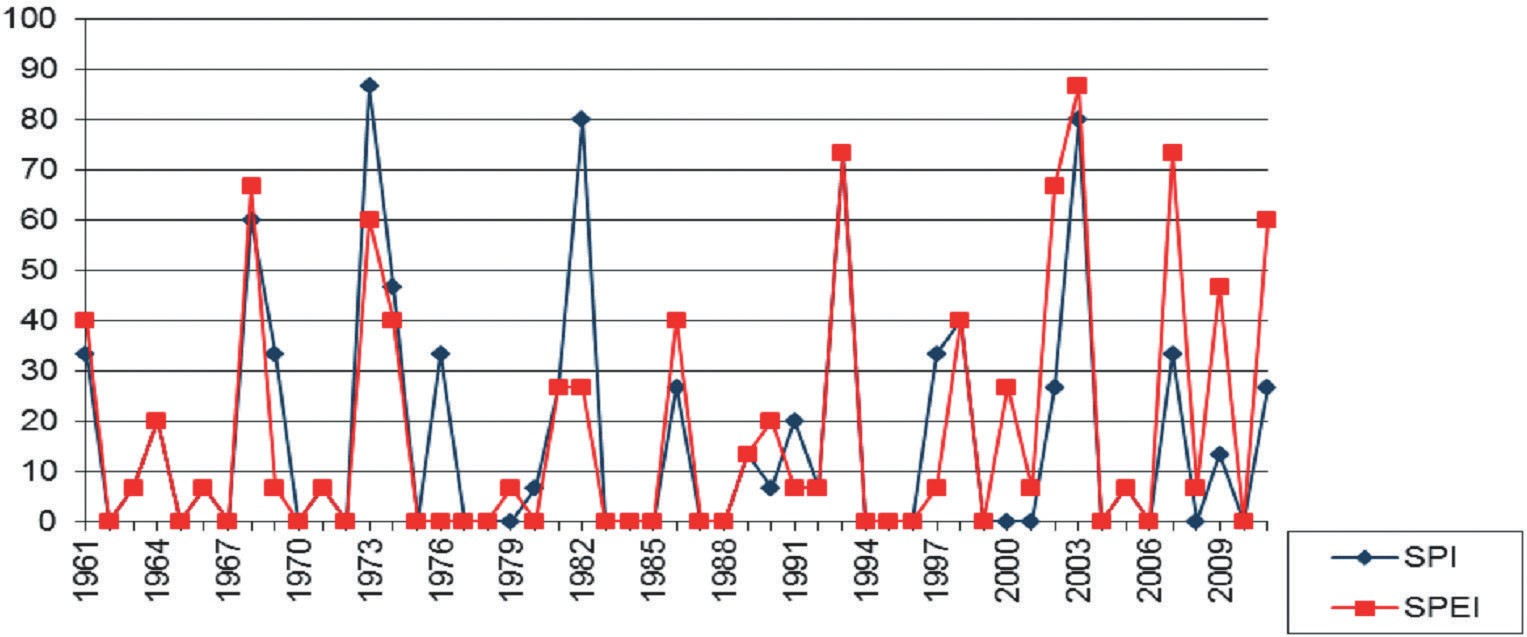
The values of 3-months SPI and SPEI show 7 to 10 dry winters for the period 1961–2011. In most of cases the drought is moderate. The frequency of occur- rence of dry winters for the period 1961–2011 is higher in the 90’s. The driest winter has been observed in 1990. According to the SPI the winter of 1990 was dry in 87% of investigated stations and SPEI shows dry winter in 93% of the sta- tions (Fig. 3). In more than 50% of the investigated stations dry winters are es- tablished for 1964, 1978, 1998 and 2002.
During the first part of investigated period up to 1985, drought in winter is established mainly by SPI. On the other side since the 90-s the frequency of dry win- ters determined by SPEI is higher than one confirmed by SPI. This is due to the increasing of temperature in the last decades of 20th and in the beginning of 21th century. For example, in 2007 the SPI show that there is not dry winter in any of the investigated stations but if we take into consideration temperature conditions SPEI confirm dry winter in one third part of the investigated stations (Fig. 3).
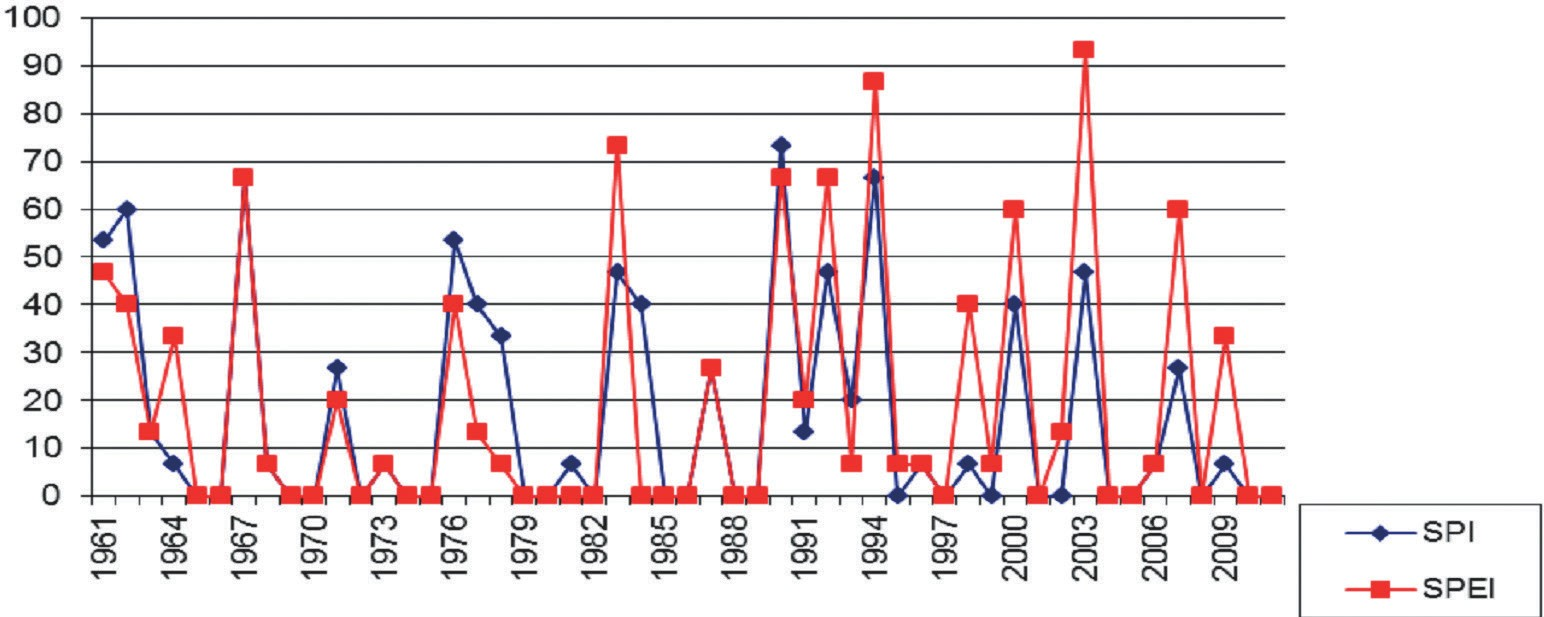
In comparison to the winter in spring the occurrence of drought is more often and the severity is higher. The spring drought was widespread in 1973, 1982 and 2003 (in more than 80% of investigated stations). The year 1993 makes impres- sion with dry spring observed in 73% of investigated stations and registered by both indices – SPI and SPEI. The drought in spring 1993 was extreme in central part of studied area as well as in some stations in western part. In eastern part the drought is mild. The number of dry springs increases since 2000. In the most of cases the values of SPI and SPEI show moderate or severe drought in spring 2003. According to SPEI extreme spring drought is observed in stations Hurbanovo and Jaslovské as SPI shows moderate drought. The spring drought in 2003 is not established at the stations Sliač, Žilina and Žihárec.
SPI and SPEI show great difference for the years 1973 and 1982 when the spring drought is determined by SPI in 87 and 80% of investigated stations re- spectively. On the other hand, the SPEI shows dry spring in 60 and 27% of the stations, (Fig. 4). This can be explained by comparatively low values of air tem- peratures in spring 1982.
Due to the increasing of air temperature since 2000 the occurrence of spring drought detected by SPEI is more often than drought determined by SPI. The dry spring in 2007 is observed in 73% of investigated stations and it is well ex- pressed by SPEI with values close to –2 (severe or extreme drought) but on the other side the SPI shows dry season only in 33% of the investigated stations,Fig. 4.
The analysis of SPI and SPEI shows increasing of cases with severe or ex- treme drought in summer for most of the investigated stations. According to the values of SPI the dry summers are observed in 1962, 1967, 1983, 1990, 1994 and 2003 in most of the investigated stations. The eastern part of studied area differs from the other parts with occurrence of summer drought in 1976 and 1994 while the droughts in 1983 and 1990 are not characteristic for this area. The SPI shows that summer drought is widespread during 1990 in 73% of the investigated sta- tions, situated mainly in western and central part of Slovakia (Fig. 5). According to the SPEI the driest summers are observed in 2003 (in 93% of investigated sta- tions), 1994 (in 87% of the stations) and in 1983 (in 73% of investigated stations),Fig. 5. Klementová and Litschmann (2004) point out that 2003’s drought is the worst during the recent 33 years.
The comparison between SPI and SPEI shows the biggest difference in the values for summer in comparison to other seasons.
The number of summer drought events recorded by the 3 months SPEI is relatively higher than those one shown by SPI. This underlines the importance of air temperature for drought occurrence: for many of stations during the hot sum- mers of 1998, 2003, 2007, 2009, etc. The SPEI shows dry season despite that SPI do not prove the occurrence of drought. The difference between both indices is higher at the station Hurbanovo where the SPI shows close to normal conditions in 2003, but according to SPEI extreme drought is observed.
In autumn the number of dry events decreases. The SPI and SPEI show widespread dry autumns in 2006 and 2011 where moderate or extreme drought is observed (Fig. 6).
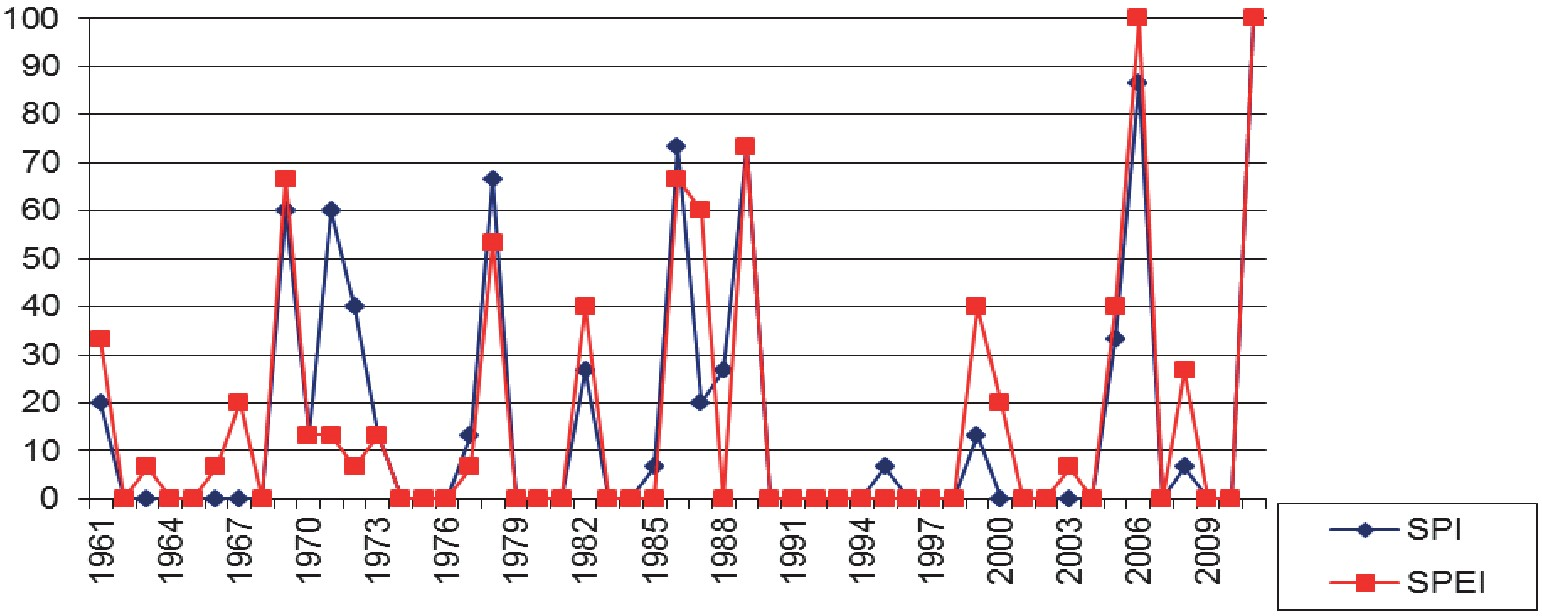
Extreme autumn drought in 2006 and 2011 is more characteristic for the sta- tions situated along the river valleys in central part of Slovakia however the dry events with lower severity are observed in all investigated stations.
Dry autumn during 1986 and 1989 has been observed in about 70% of the investigated of stations. For most of cases the values of SPI prove extreme drought in autumn 1986 while the values of SPEI show less pronounced drought. In some stations situated mainly in the west part of the country drought in au- tumn during 70’s is established according to SPI but SPEI shows normal condi- tions. The results from the analysis show that the leading factor for occurrence of drought in autumn is precipitation.
3.3. Cluster analysis of drought occurrence
In order to determine the role of geographical position and relief for the oc- currence of seasonal drought the stations are grouped by cluster analysis accord- ing to the seasonal values of SPI and SPEI calculated with 3 months step. For the winter season we can distinguish two main groups (clusters) of stations: the first group is from the stations from eastern and central part of studied area and the second group is from stations situated in western part of Slovakia (Fig. 7). The stations of each of these clusters are grouped into the subgroups as follow: the first cluster includes the three subgroups: 1) Kamenica and Michalovce; 2) Košice, Milhostov and Somotor, and 3) Rimavská Sobota and Boľkovce (situated in the central part of studied area); the second cluster is also formed by three subgroups: 1) Sliač, Piešťany, Jaslovské Bohunice (situated in the river valley near to the mountain foothills), 2) Kráľová, Hurbanovo and Žihárec (with the low altitude) and 3) Bratislava and Žilina.
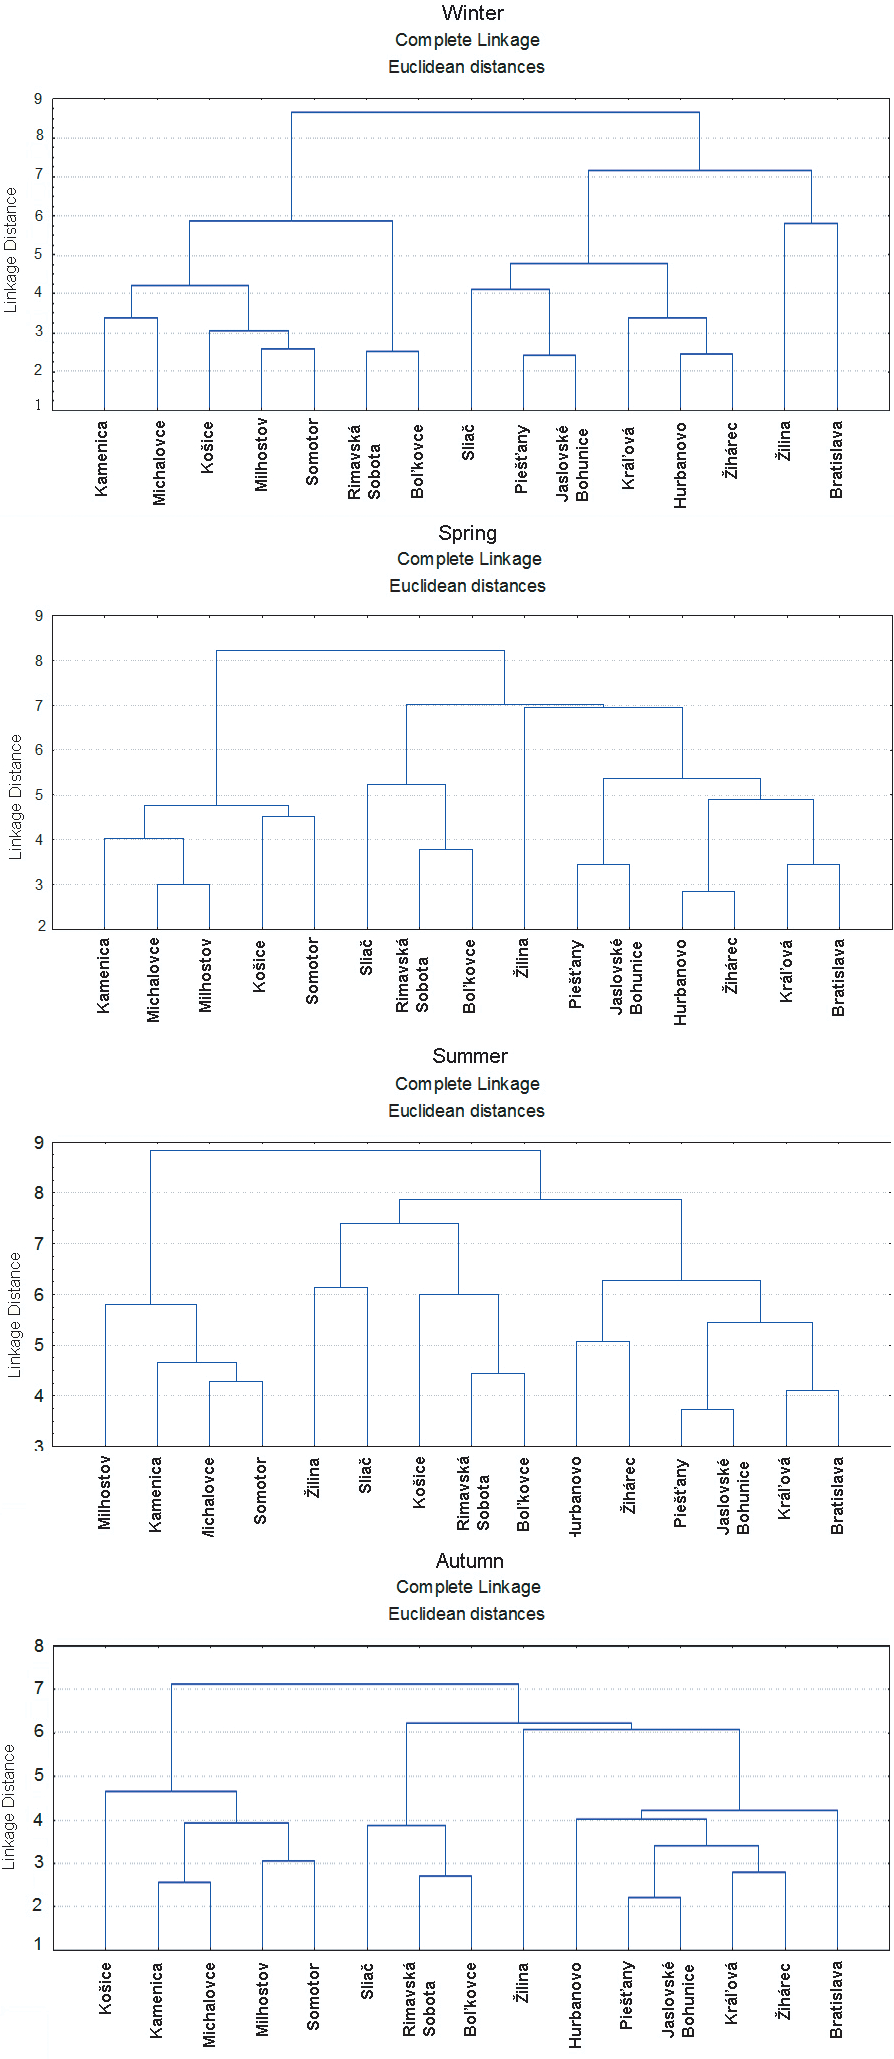
The results from cluster analyses performed for both indices (SPI-3 and SPEI-3) for winter show the same groups. Exception is station Žilina which changed its position. This could be explained with the geographical position and altitude higher than the altitude of other stations.
According to the cluster analysis two main clusters are determined for spring also. The difference from winter is that the stations from central part of Slovakia (Rimavská Sobota and Boľkovce) change their position and are as a subgroup from the second group (western part). The same results are observed for summer and autumn. The peculiarity for summer is that the station Košice is moved to the second (western) group of stations. This fact also could be explained by the geographical location of the station Košice that is relatively separated from other stations situated in the two adjacent groups and it has a little higher altitude than other stations.
The cluster analysis shows that the main factor for grouping the stations into the clusters is the geographical situation, altitude and peculiarities of the relief.
4. Conclusion
The analysis of observed droughts and their future projection made in the presented research work allow us to conclude the following:
The maximum continuous duration of mild drought is between four and nine months. Moderate drought continues without break maximum two months and severe and extreme droughts continue in most of the cases no longer than one month. The maximum continuous duration of extreme drought is longer in east- ern part of Slovakia where in all of stations except Somotor, maximum number of consecutive extreme dry months is two.
The comparison between the values of SPI-3 and SPEI-3 shows that the temperature has an important role for occurring of moderate and severe drought at monthly level. On the other side in the most of cases precipitation is the main factor for occurrence of extreme drought.
The driest winter has been observed in 1990: The SPI shows dry winters in 87% of investigated stations and SPEI – in 93% of the stations. In more than 50% of the investigated stations dry winters are established for 1964, 1978, 1998 and 2002. The spring drought is widespread in 1973, 1982 and 2003 (in more than 80% of investigated stations). The year 1993 makes impression with dry spring observed in 73% of investigated stations and registered by both indices – SPI and SPEI. There is increasing of cases with severe or extreme drought in summer for most of the investigated stations. According to the values of SPI the dry summers are observed in 1962, 1967, 1983, 1990 and 2003 in most of the investigated stations. In autumn the number of dry events decreases. The SPI and SPEI show widespread dry autumns in 2006 and 2011 when moderate or extreme drought is observed in all of investigated stations.
The main factor for grouping the stations into the clusters according to drought occurrence is the geographical location, altitude and peculiarities of the relief.
The analysis of future projection of drought made on the basis of model data (KNMI and MPI RCMs) for two periods (2001–2050 and 2051–2100) shows in- creasing of number of severe droughts. We could expect no changes in occurrence of moderate drought and the cases with extreme droughts will decrease in com- parison to these one for the period 1961–2011.
The analyses from presented research work as well as from existing publica- tions point out that in order to make more detailed estimation of drought occur- rence and severity it is necessary to take into account not only precipitation (SPI) but it is recommended to study Standardized Precipitation Evapotranspiration Index (SPEI) which combines precipitation and temperature data.