
Introduction
Soft cheeses amount a significant share in the global cheese market. Soft cheeses are characterized by a high moisture content of at least 60 %. A typical representative of this group is pasta filata type of cheese, unripened or uncured, and lacking skin. Such cheese is referred to as mozzarella and is traditionally produced from buffalo or cow milk using rennet and lactic acid bacteria (LAB). This cheese is intended for sale in airtight containers in a whey-based brine with addition of salt. In some regions, the prepared cheese is dried and vacuum sealed without brine in a thermoforming barrier shrink film. Such vacuum-packed mozzarella is harder and firmer than traditional mozzarella packed in brine. These parameters are important, as the cheese is cut into cubes and usually served in addition to salads and snacks or sliced and added to pizza, pasta, and other hot dishes. Vacuum packaged pasta filata soft cheese may also be smoked, which is often done in the Central and Eastern Europe. Soft smoked cheeses are most often eaten in sandwiches, on toast, as a snack with wine or beer, and in catering service. Thus, an important technological aspect is the possibility of cutting, dicing, and slicing smoked pasta filata cheese.
Smoking leads to changes in the cheese’s sensory properties and changes durability. Cheese is smoked at relatively low temperatures (about 15-25 °C, with a maximum of 32 °C) (Wendorff, 2010). The permeability of the smoke-which consists of a mixture of phenols, ketones, aldehydes, and acids-depends on the composition of the product being smoked. The depth of smoke penetration in turn determines the durability of the smoked product. In addition, the smoking process occurs mainly on the surface of the cheese. Smoking causes drying of the surface and a partial separation of fat. Intrusion of smoke causes changes in the functional characteristics of the cheese, particularly in the cohesiveness, meltability, hardness, springiness, chewiness, and other parameters of cheese texture (Cais-Sokolińska and Pikul, 2010;Cais-Sokolińska et al., 2014).
Milk fat, which determines various rheological properties of dairy products, may be dispersed as an oil-in-water emulsion (O/W) - as in milk and cheese - or as a water-in-oil emulsion (W/O), as in the case of butter. Differential scanning calorimetry (DSC) is convenient technique for studying the phenomenon of freezing and melting in dispersed systems like cheese (Clausse, 2010). This technique easily enables study of the specific interactions of water with the matrix of dairy product by monitoring the thermal events associated with the phase transitions of water and milk fat, or those of water molecules unable to crystallize, in the case of inhibited or difficult water crystallization (Gliguem et al., 2009;Tomaszewska-Gras, 2012). Few studies exist on the thermal properties of fat in complex dairy products (Tunick, 1994;Michalski et al, 2004;Lopez et al., 2006).
The main goal of the present study was to characterize the functional parameters of smoked soft cheese with an emphasis on the behavior of water and milk fat, as analyzed by DSC, which was used to directly measure the melting/freezing phase transitions in the cheese. This study was complemented by NMR measurements of organization and distribution of the aqueous phase within the emulsions that constitute the cheese.
Materials and methods
Collection, packaging, storage, and sampling of the cheeses
The materials for the study were commercially smoked and unsmoked mozzarella cheeses (n = 9). The smoked cheese was produced using a cold smoking process at 20 °C. The selected cheeses had a similar protein (19 %) and fat (19 %) content and were vacuum packed without brine. They were tested within 2 and 3 weeks after their manufacturing date. The cheeses had a spherical form of 7-8 cm diameter, each weighing 220-250 g. The samples were collected from an inner layer of cheese, closer to the geometric center of the sphere, about 2.5 cm from the edge.
Compositional analysis
The total nitrogen content was determined by the Kjeldahl method with the assistance of the Kjeltec System 1026 Distilling Unit (Tecator Company, Örebro, Sweden). The casein nitrogen content was expressed as a percentage of total nitrogen (N × 6.38). The water and fat content of the cheese was determined by standard methods (AOAC, 1995). The pH of the cheese was measured using a CP-315 digital pH meter (Elmetron, Zabrze, Poland). Titratable acidity was determined using the AOAC method (1995).
Differential scanning calorimetry (DSC)
A Perkin Elmer DSC 7 differential scanning calorimeter (Perkin Elmer, Norwalk, CT, USA), equipped with an Intracooler II and running under Pyris software, was used to examine the melting properties of butterfat. Nitrogen (99.999 % purity) was the purging gas. The DSC calorimeter was calibrated using indium (m.p. 156.6 °C, ∆Hf = 28.45 J∙g-1) and n-dodecane (m.p. -9.65 °C, ∆Hf = 216.73 J∙g-1). Samples of cheese (9-10 mg) were weighed into aluminum pans of 20 μL (Perkin Elmer, No. 0219-0062) and hermetically sealed. The reference was an empty, hermetically sealed aluminum pan. The calorimeter was calibrated to the melting point of capric acid (31.6 °C). The sample pan was placed in the calorimeter at 5 °C and subjected to the following time-temperature program: (1) heating and isotherm for 5 min at 70 °C to melt all crystals and nuclei; (2) cooling at 5 °C∙min-1 to -40 °C; and (3) heating at 5 °C∙min-1 to 70 °C. Three replicates were analyzed for each sample. The following parameters were analyzed from the first melting curve: T1onset, T1peak (melting point of the highest peak), T1end (final melting temperature), and enthalpy of milk fat melting ∆Hm1 (J∙g-1), determined as the area limited by the melting curve and the base line. From the second melting scan, the same temperatures (T2onset, T2peak, T2end) and the enthalpy (∆Hm2) of milk fat melting were taken for analysis. The onset temperatures (Tonset) were taken at the intersection of the baseline with the tangent to the left side of the melting peak. The data concerning ice melting correspond to those obtained during the second heating scan from -40 °C to 70 °C. The parameters of ice melting were measured: Tionset, Tipeak, and the enthalpy∆Hice of ice melting. The enthalpies were calculated per gram of water.
The percentage of unfrozen water in the water fraction (UFW) was calculated as:
where ΔHice is the enthalpy of ice melting per unit mass of water contained in the cheese (J∙g-1), and ΔHref is the enthalpy of ice melting for samples of pure water, equal to 333.7 J∙g-1.
NMR
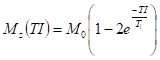
Samples 1.5 cm in diameter and 1.2 cm in height were placed in the measuring test tubes and sealed using Parafilm. Measurement of the spin-lattice (T1) and spin-spin (T2) relaxation times were performed using a pulse NMR spectrometer operating at 30 MHz (WL Electronics, Poland). The inversion-recovery (π-TI-π/2) impulse sequence (Farrar and Becker, 1971;Fukushima and Roader, 1981;Brosio and Gianferri, 2009) was applied for the measurements of the T1 relaxation times. Intervals between impulses (TI) were varied from 4 to 800 ms and the repetition time was 15 s. Each time, 32 free induction decay (FID) signals and 119 points from each FID signal were collected. The spin-lattice relaxation time values were determined with the assistance of the CracSpin program (Węglarz and Harańczyk, 2000), which calculates relaxation parameters from experimental data using the spin grouping approach. Marquardt’s method of minimization was applied for fitting multiexponential decays. The accuracy of the relaxation parameters was estimated with the standard deviation. The following formula describes the time behavior of the FID signal as a function of the interval between impulses:
where Mz(TI) is the magnetization value, M0 the equilibrium magnetization value, TI the interval between impulses, and T1 the relaxation time.
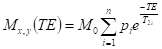
A mono-exponential magnetization recovery was found, meaning that the system relaxes in one T1 spin-lattice relaxation time. Measurements of the T2 spin-spin relaxation times were made using the pulse train of the Carr-Purcell-Meiboom-Gill spin echoes (π/2-TE/2-(π)v) (Carr and Purcell, 1954;Meiboom and Gill, 1958;Brosio and Gianferri, 2009). The interval between π (TE) impulses amounted to 1 ms. The repetition time was 15 s. The number of spin echoes (n) amounted to 50. Ten accumulation signals were employed. To calculate the spin–spin relaxation time values, we applied adjustments to the values of the echo amplitudes in the formula (Baranowska, 2011):
where Mx,y (TE) is the echo amplitude, Mo the equilibrium amplitude, TE the interval between π impulses, and pi the fraction of protons relaxing with the T2i spin-spin time.
The calculations were performed using dedicated software by applying a nonlinear least-square algorithm. The accuracy of the relaxation parameters has been estimated with the standard deviation. The presence of two proton fractions was determined for all analyzed systems.
Water activity
The water activity was measured using an AquaLab Series 4TE instrument (Decagon Devices Inc., Pullman, USA). The water activity was measured on the basis of pf(T), the value of water vapor in equilibrium in the sample maintained at a constant level during the measurement of the temperature T, and ps(T), the vapor pressure of saturated pure water at the same temperature T, as aw = pf (T)∙ps (T)-1. Samples of v = 15 cm3 were placed in DE 501 measurement vessels (Decagon Devices Inc., Pullman, USA) and tested at 15 °C.
Cheese melt
Meltability of cheese samples was determined by two methods - the Schreiber Test and a method using a test tube (Koca and Metin, 2004;Cais-Sokolińska et al., 2014).
For the Schreiber test, a circular cookie cutter of diameter 39.5 mm was used to cut 5-mm high discs of cheese. Each disc was placed in a covered 15 mm × 100 mm thin-walled Pyrex Petri dish and heated for 5 min in a forced draft oven preheated to 232 °C. Specimen expansion was measured using a scale with six lines marked on a concentric set of circles. The Schreiber test meltability was given as the mean of six readings on an arbitrary 0-10 scale.
For the other method, 10 g of grated cheese was placed in a tube (32 mm × 250 mm) and packed to form a plug at the bottom. The height of the cheese was marked. The test tube was kept vertically in a refrigerator at 4 °C for 30 min, and then horizontally for 60 min in an oven at 104 °C. Meltability was measured as the flow distance in mm of the melted cheese.
Texture measurement
The texture parameters were measured using a TA.XT Plus texture meter (Stable Micro Systems, Surrey, UK). The following attachments were used: A/CE with a PT 100 temperature sensor (test speed 20.0 mm∙ s-1, post-test speed 20.0 mm∙s-1, distance 270 mm, temperature 55 °C, samples of 60 g), the A/WEG attachment (test speed 2.0 mm∙s-1, post-test speed 10.0 mm∙s-1, distance 10 mm) and the A/BC attachment (test speed 0.5 mm∙s-1, post-test speed 10.0 mm∙s-1, distance 25.0 mm). Results were recorded in Texture Expert TE32 software version 6.0.
Statistical evaluation
To verify the statistical hypotheses, a level of significance at α = 0.05 was adopted. Statistical calculations were carried out using the Statistica data analysis software system, version 10 (StatSoft, Inc., 2011).
Results and discussions
This research has shown that the acidity of the smoked cheese (pH 5.01) was significantly higher (∆pH = 0.11) than that of the unsmoked cheese (Table 1). There were no significant differences in the content of the basic components of dry matter, such as protein and fat, which was in line with the objectives of the experiment. The lactose content of the soft smoked cheese was 2.17 g per 100 g; for the unsmoked cheese, this was 2.25 g per 100 g (P>0.05). The salt content of the cheese was also similar, and did not exceed 0.54 g∙100 g-1 (P>0.05). The water activity of the soft smoked cheese (aw = 0.9615) was lower than that of the unsmoked cheese (aw = 0.9736). Despite the lack of difference in water content between the two cheeses (mean moisture 60.06 %; P>0.05), the difference in their water activity (∆aw = 0.0121) was statistically significant (P<0.05).
a-b: different small letters with mean values in columns indicate statistically significant differences at the level α=0.05
Meltability. Melting ability of Mozzarella smoked cheese was 1.5 times less than unsmoked cheese, regardless of the used analytical method (Table 2), on the Schreiber test score no more than 2 out of 10. The stretching of the smoked mozzarella cheese was 30% less. The extensibility force used for stretching smoked mozzarella cheese and the cutting force did not differ significantly (P>0.05). The difference demonstrated by measuring the force using the fracture set wedge (A/WEG), consisting of upper and lower wedges each with a cutting angle of 30° and 30 mm width, was higher by 20 % of the measured force for fracturing the smoked mozzarella cheese, which indicates that the cheese was harder than the unsmoked cheese.
a-b: different small letters with mean values in columns indicate statistically significant differences at the level α = 0.05
The milk fat and ice melting phase transitions were analyzed in samples of smoked and unsmoked cheese using the DSC method.Figure 1a shows the representative first and second scans from the melting curves of both cheeses. The first heating curve was obtained during heating of the cheese samples from 5 °C to 70 °C, and the second scan during heating from -40 °C to 70 °C of samples previously cooled to -40 °C. On the first heating curve of the smoked and the unsmoked cheese, two well-separated endothermic peaks can be observed, although the shapes of the curves differ. The presence of endothermic peaks demonstrates that part of the milk fat was present at room temperature in form of crystals in fat globules.
The DSC parameters of temperatures and enthalpies calculated from these curves are presented inTable 3. When comparing the smoked and unsmoked cheese smaples, no significant differences were obtained between temperatures TIonset, TIpeak, and TIend and the melting enthalpy ΔHm1 (P>0.05).Figure 1a shows melting curves of milk fat which were obtained during the second heating of samples (up to 70 °C), that had previously been cooled to -40 °C. Samples of cheese with eliminated thermal histories differed during their second heating from the curves from the first cycle of heating. However, the second heating curves did not differ in shape between the two types of cheese. For both cheeses, the DSC melting curves showed a minor endothermic event at 7.55 °C and 7.81 °C and a larger main peak at 16 °C, after which a complex of overlapping endothermic events in the form of two shoulders ending at 37.3 °C was recorded.
Analyzing all the DSC results (Table 3) from the second curves for both type of cheeses, it could be observed that, as with first heating curves, there were no differences in any melting temperatures (P>0.05), but there were significant differences in the values of the enthalpy ΔHm2, which were higher value for unsmoked cheese. These observations were consistent with the meltability results inTable 1 showing all parameters to be lower for smoked cheese.
1first heating cycle from 5 °C to 90 °C
2second heating cycle from -40 °C to 90 °C
± SD: group averages ± standard deviations
a,b,c: group averages with different superscripts differ significantly within rows (α = 0.05)
During heating, the phase transition of ice melting in the cheese matrix was also measured by the DSC method. Melting curves of ice in samples of smoked and unsmoked cheeses previously cooled to -40 °C are shown inFigure 1b, and the results obtained from the curves are presented inTable 3. In the case of this phase transition, significant differences were observed for the temperatures and enthalpy of ice melting. For the smoked cheese sample, lower values of enthalpy ΔHice and higher values of the temperatures TIonset and TIpeak were obtained. These observations were in agreement with the results of water activity shown inTable 1 where the lower value of aw = 0.9615 was noted for smoked cheese than for unsmoked (aw = 0.9736).
a.
b.
The percentage of unfrozen water in the water fraction (UFW) of cheese was also calculated according toEq (1) and the results were presented inTable 3. It was found that smoked cheese contained higher percentage of unfrozen water than unsmoked cheese.
The low-field NMR technique is increasingly finding broader application in investigations of food, due to the noninvasive nature of its measurements (Budiman et al., 2000;Arimi et al., 2008; van Duynhoven et al., 2010). Structural and dynamic properties of water in food are determined primarily by the interaction of their main constituents like proteins or fat. When analyzing these properties using low-field NMR, a signal from the water proton is observed.Halle (2004) has conducted a comprehensive review of physical methods that allow analysis of water-protein interactions. It includes a depletion into the free water fraction and the hydrated water fraction. Such depletion is entitled for liquid systems like protein solutions or low concentration polymer gels. In foods like cheese or meat, there are usually two fractions of water: the free/bulk water and the bound water (Møller et al., 2010;Anedda, 2015). The values of the transverse relaxation times bulk water fractions are about several ten milliseconds. The bound water fraction, directly interacting with the protein matrix, relaxing with values of T2 ranging from several to several milliseconds. The difference in values is the result of both the freedom of molecular motion and the resonance frequency. The values of T1 reflect the relative bulk water content in relation to bound water, while the values of T2 describe the dynamics of molecules in both the free and bound water fractions (Kowalczewski et al., 2015). Distributed exponential analysis of the NMR T2 relaxation data revealed the existence of distinctly different water populations. Values of T21-the so-called short component-describe the spin-spin relaxation of the bound water fraction, while values of T22 concern the spin-spin relaxation of the bulk water fraction (Stangierski and Baranowska, 2015). The results are shown inTable 4.
| Relaxation parameters | Mozzarella cheese | |
| smoked | unsmoked | |
| T1 (ms) | 279.3±4.1a | 376.1±9.1b |
| T21 (ms) | 24.1±2.9b | 20.9±1.4a |
| T22 (ms) | 164.1±4.3a | 262.0±1.3b |
a-b: different small letters with mean values in columns indicate statistically significant differences at the level α = 0.05
The values of the spin-lattice relaxation times T1 indicated that the smoked cheese had a smaller amount of bulk water (relative to bound water) than the unsmoked cheese. The mobility of the bulk water fraction was also lower, which was reflected in the lower values of the long component of the spin-spin relaxation time T22. These results explain the differences observed in the values of water activity (Table 1). The bulk water fraction is less bound to the system components and is easier to remove from unsmoked cheese.
The higher value of the enthalpy of ice melting in the unsmoked cheese demonstrates the higher content of the bulk water content. Water activity is a parameter characterizing the stability of the food product (Lewicki, 2004). As demonstrated, the increase in water activity is determined by the molecular properties of the bulk water in the system, which can be easily transported to the surface of the cheese. It was also found that the short component of the spin-spin relaxation time T21, whichis related to the bound water, was higher in smoked cheese. This fraction of the water is mainly associated with the proteins and milk fat. In both types of cheese sample, the content of these components is the same. In mozzarella cheese, fat is present in the form of molecules that have lost part or all of the original membrane. These are arranged in a matrix of casein. During heating, the fat in mozzarella cheese changes from a solid to a clear liquid and the particle size distribution of the fat changes, with a portion of the fat coalescing and migrating to the surface as a clear free oil (Metzger, 2000). This may explain the observed obstruction of the diffusion of water molecules and the reduction in the water activity values in smoked cheese.
The observed changes in the molecular and thermodynamic parameters may be associated with changes in mechanical properties. Rapid smoking, quick heating, and surface drying bring water transpiration to a halt. Such heating of mozzarella cheese leads to increases in protein hydration and swelling inside the casein cheese (Sheehan et al., 2005). The transport of fat to the cheese surface shows the adsorption sites on the surface protein matrix. This reduces the amount of bulk water. It can therefore be concluded that the water acts as an antiplasticizer. Similar effects were observed, for example, in the high moisture content of extruded products. Water does not always act as a plasticizer: in certain products, especially those rich in starch, increasing water activity leads to hardening of the material. This phenomenon was observed byMarzec and Lewicki (2006) in their analysis of crisp breads of various water activities. In mozzarella cheese, the protein network could be formed in a similar fashion to the starch network in other products. The water molecules participate in building the nodes of the biopolymer network and the result is a rigid structure, observed as an increase in the hardness of the smoked cheese.
Conclusion
In summary, it was found that both, smoked and unsmoked, cheeses were characterized by similar compositions, in terms of protein, fat, and water content. However, the water activity was higher in the unsmoked cheese than in the smoked cheese. This result was confirmed by DSC (higher ice melting enthalpy) and NMR (higher T1 value). All these findings indicated that the unsmoked cheese contained more bulk water than the smoked cheese. This suggests that the smoking process caused differences in the distribution and the binding of water to the lipid-protein matrix of the cheese. It was confirmed by DSC and NMR techniques that the content of unfreezable, bound water was higher in the smoked cheese. This resulted in a more fragile and loosened structure in the smoked cheese than in the unsmoked cheese, which manifested in lower values of stretching and meltability. The weakening of the lipid–protein network in smoked cheese could also be influenced by the leakage of the smoke. An increase in the hardness of the smoked cheese was also observed, which could be the result of the water molecules participating in building the rigid structure of the nodes of the biopolymer network.