
Introduction
Kefir is a fermented and carbonated refreshing milk, with a slightly acidic aromatic taste and creamy foam composition which contains yeasts and many bacterial species from genus Lactobacillus, Leuconstoc, Lactococcus and acetic acid bacteria (Chifiriuc et al., 2011). Besides milk ingredients such as proteins, fat and lactose, it also contains small amounts of lactic acid, ethanol, carbon dioxide, acetic acid, acetaldehyde, acetoin and diacetyl, influencing its flavour and odour (Gronnevik et al., 2011;Glibowski and Zielinska, 2015).
The main raw material applied in kefir production is bovine milk; however, kefir can also be produced from caprine or ovine milk (Wszolek et al., 2001;Tratnik et al., 2006;Grzegorczyk and Wszołek, 2010). As well as different kinds of milk, different additives, such as skim milk powder (SMP), whey protein concentrate (Tratnik et al., 2006) and inulin (Tratnik et al., 2006;Ertekin and Guzel-Seydim, 2010;Glibowski and Kowalska, 2012;Montanuci et al., 2012;Glibowski and Zielinska, 2015) were studied for kefir production. Usually, the addition of the above mentioned substances caused a change of rheological parameters.
Consumers are demanding for foods with increasingly properties, such as pleasant flavor, low-calorie value or low-fat content and beneficial health effects (Gonzalez-Tomas et al., 2008). Dietary fiber (DF) is a remnant of the edible part of plant; it is analogous carbohydrates that are resistant to digestion and absorption in the human small intestine and undergo complete or partial fermentation in the human large intestine. DF includes oligosaccharides, lignin, resistant starch, tannins and associated plant substances. The significant physicochemical properties of DF include solubility, viscosity, water holding capacity and fermentability (Elleuch et al., 2011;Mudgil and Barak, 2013). DF plays an important role in human health. High DF diets are associated with the prevention, reduction and treatment of some diseases, such as diverticular and coronary heart diseases. This has prompted efforts to add DF into food products (Tungland and Meyer, 2002). Recently, DFs have been commonly used in various food products such as yoghurt, ice cream, beverages, pasta, biscuits, and bread (Dello Staffolo et al., 2004;Dervisoglu and Yazici, 2006;Akin, 2005;Akin, Akin and Kirmaci, 2007;Brennan et al., 2008;Sendra et al., 2008;Soukoulis et al., 2009;Gularte et al., 2012;Agama-Acevedo et al., 2012;Paquet et al., 2014;De Lima et al., 2014;Fu et al., 2015).
The by-products of fruits from industrial applications are potential sources of DF that can be incorporated into food products. The processing of apples, in particular for apple juice, generates the by-product apple pomace, which consists of a heterogeneous mixture of peel, seeds, calyx, stem and pulp. Apple pomace can represent 20-40 % of the weight of processed fruits, depending on the technology used in the extraction of juice (Macagnan et al., 2015). Lemon is the third most important Citrus species in the World and is mainly processed into fruit juice. Lemon pomace accounts for 50-65 g per 100 g whole fruit mass, there is a great interest in utilizing the remaining biomass. DF was the major constituents (77.34-81.71 %) in dried lemon by-products (Marin et al., 2007).
Therefore, to use these widely available and low cost fiber sources in human nutrition, elucidating their potential physiological and metabolic actions is fundamental. Thus, it was aimed to develop a functional product containing apple fiber (AF) and lemon fiber (LF). In an attempt to improve the nutritional value of kefir different levels of AF and LF were added to the batches. Furthermore, the effects of apple and lemon fiber levels on the physico-chemical, microbiological and sensory properties of kefir were also examined.
Materials and methods
Materials
Cow’s milk was supplied from Animal Husbandry unit of the Faculty Agriculture, Harran University. The chemical composition of milk used for the production of kefir fell within the following averages: titratable acidity 0.160 % (±0.02) as lactic acid (L.A.), pH 6.68 (±0.015), dry matter 11.73 %(±0.08), fat 3.1 % (±0.03), protein 3.35 % (±0.05), lactose 4.58 % (±0.04) and ash 0.75 % (±0.015). Kefir grains were obtained by Professor Celalettin Koçak (Ankara University, Department of Dairy Science and Technology, Ankara, Turkey). Kefir starter culture was prepared by inoculating 10 g of kefir grains into 1000 mL of pasteurized skimmed milk and then incubated at 25 °C for 22 hours until pH fell to 4.7. That kefir was used as kefir starter culture, which contains 10.35 log cfu/g Lactic acid bacteria and lactococci, 7.88 log cfu/g Leuconostoc and 6.05 log cfu/g yeast.
AF and LF were obtained from Arosel Food (İstanbul). The gross composition of apple and lemon fiber claimed by the manufacturer is; dietary fiber 70-80 % of which 10 % is soluble, moisture 12 % and fibre 90 %, moisture 10 %, fat 1 %, protein 5 %, carbohydrate 1 % and salt 1.3 %, respectively. The fibers are 100 % apple fiber and citrus fiber. L, a and b values of AF and LF were 58.61, 8.25, 18.21 and 83.05, 0.12 and 11.56, respectively. All of the other used reagents were of analytical grade.
Kefir manufacture
Raw whole cow’s milk divided seven parts of 10 L batches. The first batch was control (A). The other batches supplemented with 0.25, 0.5 and 1 % AF and LF (B: 0.25 % AF, C: 0.5 % AF, D: 1 % AF, E: 0.25 % LF, F: 0.5 % LF and G: 1 % LF), respectively. Each milk was pasteurized at 90 °C and kept for 5 min by using a batch type pasteurizer with water jacket vat and cooled to 25 °C in 2-3 min. The process of the fermentation of milk to be processed was initiated by the addition of kefir starter culture at an amount of 10 mL L-1 milk, and incubation was carried out at 25 °C for 22 hours until pH reached to 4.7. Then kefir samples were cooled to 4 °C and stored in glass jars (1 L) at 4 °C for 20 days. The experiment was conducted in duplicate (totally 14 kefir samples were analysed).
Chemical analysis
The pH of the milk and kefir was measured using a digital pH-meter and titratable acidity was measured by titrating 10 g of sample with 0.1 N NaOH using phenolphthalein indicator (Guler-Akin and Akin 2007). The fat and lactose contents of milk were determined by the Gerber method (T.S.E. 1994) and spectrophotometric (Lawrance, 1968) methods, respectively. The protein, moisture and ash contents of milk were estimated from the crude nitrogen content of the samples determined by the Kjeldahl, oven-drying and gravimetric methods, respectively (AOAC, 1990). The water activity of the kefirs was measured using a water activity meter at 25 °C (HygroPalmAW1; Rotronic ag, Bassersdorf, Switzerland).
Physical measurements
The viscosities of the kefirs were determined at 4 °C using a digital Brookfield Viscometer, Model DV-II (Brookfield Engineering Laboratories, Stoughton, MA, USA) (Akin et al., 2007).
Water-holding capacity of kefir was determined using a centrifuge (Mudgil et al., 2016). 10g of kefir (X) sample was centrifuged at 3000 rpm for 20 min at 4 °C. The whey (Y) separated was removed and weighed. The water-holding capacity was calculated as.
Water Holding Capacity (%) = [(X-Y)/X] x100)
Color measurements
A reflectance colorimeter (Color Quest XE, USA) was used to determine Hunter L, a and b color parameters of the kefir samples. The source of light and the observation angle are D65 and 10°.
Microbiological enumerations
Kefir samples (10 g) were decimally diluted in 100 mL sterile peptone water (0.1 %) and 1 mL aliquot dilutions were poured onto plates in triplicate. Lactococcus spp. counts were determined in M17-lactose agar (Difco®), followed by incubation under aerobic condition at 30 °C for 48 hours (Garcia Fontan et al., 2006). Leuconostoc spp. counts were determined on APT agar (Merck®) supplemented with sucrose (100 g L-1) and 0.005 % of sodium azide, and it was incubated under aerobic condition at 22 °C for 4 days (Montanuci et al., 2012). Total lactic acid bacteria (LAB) were enumerated on MRS agar (Merck®) and incubated under aerobic condition at 30 °C for 48 hours (Garrote; Abraham; De Antoni, 2001).
Yeast count was determined on YGC agar (yeast extract glucose chloramphenicol agar). The medium was acidified to pH 3.5 by adding a sterile (Millipore 0.45 μm membrane filter) 10 % tartaric acid (w/v) solution. Incubation was performed aerobically at 25 °C for 5 days (Montanuci et al., 2012).
Sensory evaluation
The samples were organoleptically assessed by untrained ten panelists using a 10 point hedonic scale as described byBodyfelt et al. (1988). The properties evaluated included flavour and taste, consistency and general acceptability (1 = strongly unacceptable, 10 = very good). The panel of assessors was an external panel (consisted of staff from the Harran University Department of Food Engineering, Turkey) of non-smokers who were very familiar with dairy products and were checked on the basis of sensory acuity and consistency.
Statistical analysis
Statistical analysis of data via one-way analysis of variance (ANOVA) was performed to check the significance of differences at p<0.01 using SPSS Version5.0 (SPSS Inc. Chicago, IL, USA). Statistically different groups were determined by the LSD (Least Significant Difference) test (Düzgünes et al., 1987).
Results and discussions
Physicochemical properties
The effect of fiber type and fiber level on the pH, titratable acidity and dry matter of kefir was significant (p<0.01) (Table 1). Control sample had the lowest dry matter content because it had not been fortified with DF. There are no differences statistically between the samples AF and LF according to their dry matter. The dry matter of kefirs slightly increased as the DF content increased. Storage did not affect the dry matter content of the samples (p>0.05).
The pH of the samples was ranged between 4.26 and 4.65. Addition of DF caused to the decrease of pH values and increase of the acidity and dry matter content of kefirs. The results indicate that AF added kefir samples had the lowest pH and the highest acidity contents. We concluded that AF had more improvement effect on the lactic acid bacteria than LF. pH decreased and the acidity increased as the fiber rate increased up to at a rate of 0.5 %. It could be related to stimulation of lactic acid bacteria by fiber. Previous studies have also demonstrated that kefir as a probiotic (Van Wyk, 2001;Chifiriuc et al., 2011) and dietary fiber had a potential prebiotic effect (Ferliarslan, 2012;Guzeler et al., 2010). However, addition of 1 % fiber increased the pH values and decreased the acidity content of all samples. The result of that study could be related to lower water activity (aw) of kefir samples enriched with 1% AF and LF. As known, DF had very high water holding capacity (Figuerola et al., 2005;Macagnan et al., 2015). So the lactic acid bacteria couldn’t find enough water for growing or producing lactic acid. Lactic acid bacteria in kefir culture need 0.95-1 water activity (Ayhan, 2000). Aw of kefir samples supplied with 1 % DF was under 0.95 (Table 1). As expected, the storage time significantly affected the level of acidity in the samples (p<0.01), titratable acidity contents increased, while the pH decreased due to the catabolism of lactose.Glibowski and Zielinska (2015) reported that pH of kefirs decreased during storage. However,Gronnevik et al. (2011) noticed substantial decrease in pH values of kefirs during the first week with no further changes for the next 3 weeks of storage.
a-c/1-3Means in the same column followed by different letters were significantly different according to fiber and different numbers were significantly different according to storage period (p < 0.01).
AF: Apple fiber, LF: Lemon fiber
The water activity values of kefir samples were between 0.93-0.99. Control samples had the highest aw. Addition of DF reduced aw of kefirs due to the being highly hygroscopic and water binding capacity of DF. According to our result binding water of AF is slightly higher than the LF. Fiber concentration affected aw negatively (p<0.01). The result of this is that the water molecules become immobilized and unable to move freely among other molecules of the kefirs enriched with DF. Storage did not affect aw of the samples (p> 0.05).
The viscosity of the kefir samples fortified with DF was higher than control sample. The increased viscosity of the fiber-enriched kefir seems to be caused both by the contribution of the soluble matter to the composition of the aqueous phase and by the contribution of insoluble fibers to the increase of total solids (Soukolis et al., 2009), affecting the three dimensional conformation of the hydrated biopolymers. However,Ertekin and Guzel-Seydim (2010) andGlibowski and Zielinska (2015) reported that addition of inulin, which is soluble fiber, reduced the viscosity of kefir. The samples enriched with AF had the highest viscosity value. It could be related the higher soluble and insoluble fiber and pectin content of AF. The significant content of soluble matter in pectin of AF, which is well known for its gel-forming ability (Macagnan et al., 2015), can explain the intense enhancement of viscosity, greater than the other samples. Viscosity values significantly increased with increasing the fiber levels. This can be explained by the interactions of the DF and liquid components of kefir. DF, being highly hygroscopic, would bind water (Elleuch et al., 2011;Mudgil and Barak, 2013).
Water holding capacity of a product, such as yoghurt or kefir, is its tendency to retain water or its resistance towards phase separation of the product. The kefirs made with DF showed a significantly higher level water holding capacity (p<0.01) than control. It could be related to the synergistic effect of both soluble and insoluble fibers. Fiber may act as a stabilizer due to its capacity for binding water (Elleuch et al., 2011;Mudgil and Barak, 2013). The samples enriched with AF had slightly higher water holding capacity than the sample supplied with LF, due to the probably higher water holding capacity of AF.Macagnan et al (2015) determined that the faeces moisture content of rats feed with apple pomace was higher than the faeces moisture content of rats feed with orange bassage. Water holding capacity of kefirs increased as the fiber rate increased (p<0.05). Viscosity and water holding capacity of kefirs increased continuously throughout storage period in a similar way for all the samples (p<0.01).
Color properties
The fiber type and level significantly affected the L, a, b and C values of kefirs (p<0.01). Lightness (L) values of kefir samples were closer but with AF were significantly lower than the other samples (Table 2). All samples except AF had negative a (greenness) values. The lowest b value was obtained in control samples whereas the highest was obtained in LF added samples. The samples fortified AF had the lowest C values and followed by LF and control samples, respectively. The increase in the concentration of fiber diminished to lightness, contributed to the red color, yellow color and C values of the samples. L, a, b and C values didn’t change during storage (p>0.05).
a-cMeans in the same column followed by different letters were significantly different (p < 0.01). AF: Apple fiber, LF: Lemon fiber
Microbiological counts
Lactic acid bacteria (LAB) counts were between 9.79-10.89 log cfu mL-1 during storage time (Table 3). The number of LABwere found to be higher in the DF added samples than the control samples (p<0.01). This could be due to the stimulated growth of lactic acid bacteria by DF. The effects of fiber type on the lactic acid bacteria counts of kefir were negligible (p>0.05). However, the samples enriched with AF had slightly higher bacterial counts than the samples enriched with LF. Bacterial counts of kefir increased slowly up to at a rate of 0.5 % DF addition, and decreased at a rate of 1 % DF addition. The result of this could be attributed to lower water activity (aw) of kefir samples enriched with 1 % DF. About a 0.5 log cycle reduction was observed during the storage.
Lactococcus spp. counts were between 9.79-10.88 log cfu mL-1 during storage time (Fig 2). Addition of DF didn’t influenced Lactococcus spp. counts of kefir (p>0.05).Montanuci et al. (2012) also reported that addition of inulin did not affect Lactococcus spp. counts of kefir. The samples fortified with AF had slightly higher Lactococcus spp. counts than the other samples. Lactococcus spp. counts increased as the DF increased up to at a rate of 0.5 %, then it reduced. During storage Lactococcus spp. counts reduced about a 0.8 log cycle due to the high acidity of kefir.Garrote et al. (1998) andMagra et al. (2012) reported that the lactococci in kefir were sensitive to low pH.
Addition of DF, fiber type and fiber rate did not change the Leuconostoc spp. and the yeast (Table 3) of kefir samples (p>0.05). Similar results were reported byErtekin and Guzel-Seydim (2010) andMontanuci et al. (2012) for inulin added kefirs. Leuconostoc spp. and yeast counts increased about 1.5 log cycle during the storage period.Montanuci et al. (2012) reported that yeast and Leuconostoc counts increased during storage due to the metabolism of lactose by Leuconostoc.
a-c/1-3Means in the same column followed by different letters were significantly different according to fiber and different numbers were significantly different according to storage period (p<0.01).
AF: Apple fiber, LF: Lemon fiber
(a)
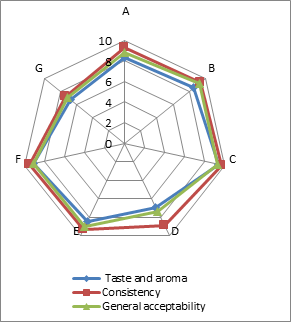
(b)
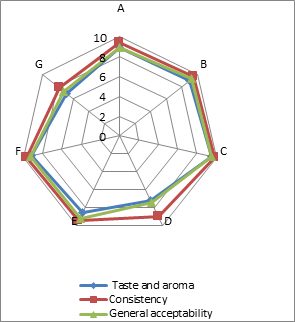
(c)
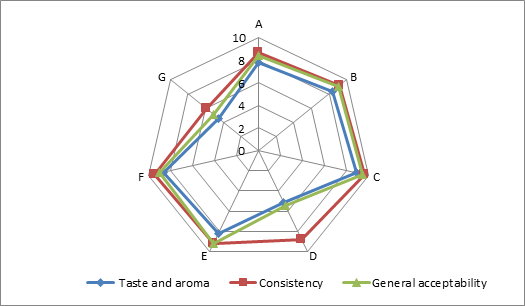
Addition of DF had significant effect on the sensory characteristics (Figure 1) of kefirs (p<0.01). 0.5 % AF added kefirs had the highest sensory scores and 1 % LF added kefirs had the lowest sensory scores. WhileErtekin and Guzel-Seydim (2010) andGlibowski and Kowalska (2012) reported that addition of inulin had no effect on sensory properties of kefir,Tratnik et al. (2006) andGlibowski and Zielinska (2015) had reported that addition of inulin had negative effect on the taste of kefir. In this study, DF addition positively influenced taste and aroma, consistency and general acceptability scores up to at a rate of 0.5 %, because of better mouth thickness and pleasant aroma of them. The higher fiber concentration (1 %) caused the lower sensory scores. It could be related to the insoluble parts of the AF and LFs. The all sensory scores of the samples increased during storage for up to 10 days, and then decreased. This could be associated with development of acidity and decreases in aroma compounds (such as acetaldehyde) contents of the samples during storage.
Conclusion
The enrichment of kefir with DF is an effective way to enhance physiological aspects of the final product. Addition of DF led to improvement of the physical, microbiological and sensory properties of kefir depending on the rate of DF. Addition of DF up to 0.5 % positively affected viscosity, LAB, Lactococcus spp. counts and sensory properties of kefir. Usage of DF at a rate of 1 % had negatively affected aw, color (L, a, b), LAB, Lactococcus spp. counts and sensory properties of kefir. Results showed that AF and LF can be used successfully in the production of kefir at a rate of 0.25 % or 0.5 %.