
1. INTRODUCTION
Professional orientation represents a set of different activities that enable individuals to identify their own interests, competencies and capabilities at different times of life, in order to make decisions on education, training and employment that will help them in development of their professional career (EC, 2008) .Youth is a fluid category and refers to people between the age when they leave their compulsory education and the age when they find their first employment (Dwyer et al., 2018:680) . There is no consensus regarding the youth age boundary. Having this in mind, we have included individuals of age 13 to 30 who have either started to consider their profession prospects or have still not found their desired jobs. To become skilled and competent in a specific field or activity, individuals should invest a lot of time and effort. In their study which included 1000 different experts, Ericsson et al. (1993) found that the journey to superior performance may last for about a decade and includes, besides deliberate effort, several important factors such as: guidance of an expert to provide often tough but necessary feedback; optimal conditions for learning; time management skills to prevent exhaustion and burnout; and development of self-improvement methods to foster high levels of performance. By choosing their specific careers, individuals shape not only their lives but also the community they live in and the society at large. This means that the significance of professional orientation goes far beyond the economic dimensions and determines socio-political and cultural context as well as personal satisfaction of every individual. Given that work plays a central role in most people's lives, successful pursuit of work activities is crucial to psychological well-being (Swanson, Fouad, 2014) .
Regarding the issue of youth unemployment, Croatia is among the worst countries in Europe with youth (under 25s) unemployment of 40.3% (in December 2015) and holds the third place slightly behind Spain (46%) and Greece (48.9%) (Genev, Vreeswijk, 2016) . In the last decade, professional orientation of young people and the problem of their inclusion into the Croatian workforce has been examined by many different authors such as Potočnik (2006) , Bogdanović (2009) , Koller-Trbović (2009) , Dubravac-Šigir (2011) , Šverko (2012) , Ivanović, Rajić-Stojanović (2012) , Gregurović, Lukić, (2014) and Perin et al. (2015) . In one of their latest publications, HZZ (2016) reported that only a quarter of students (23.3%) in primary schools do not have any difficulties in making decisions regarding the choice of their occupation, while the majority of students (64.9%) expressed a wish for career guidance services. Fortunately, in recent years the issue of the professional orientation of young people in the Republic of Croatia seems to gain in importance. According to the latest official report on the current state of affairs and challenges related to vocational guidance at higher education institutions in the Republic of Croatia, 27 higher education institutions (30%) had a professional guidance office, whereas in 2016 only 18 had such an office (Đorđević, 2017:11) . According to Đorđević (2017:6) , major challenges in faster development of professional guidance offices in the Republic of Croatia are: financial issues, motivation of staff responsible for these activities and additional education of employees that will perform activities of professional guidance. Moreover, many contemporary authors, such as Laal (2011) , London (2011) and Barros (2012) , stress that professional guidance should be available not only to the young, but also to everyone else who needs help in professional and personal development as a part of lifelong learning. The main purpose of this research is to find answers on the following two questions:
How many young people in the Republic of Croatia need help in professional orientation?
How young people choose their professions?
The hypothesis of this research is that significant number of the young needs assistance in professional orientation. This paper consists of four parts and is structured as follows. In Introduction, research problems are explained, trends in youth orientation are presented, followed by a short review of previous research, with an emphasis on findings pertaining to the Republic of Croatia. The second part explains research methodology. In the third part, results of the empirical research are presented and discussed followed by a conclusion and guidelines for future research.
2. METHODOLOGY
To empirically ascertain the newest trends in the professional orientation of youth in the Republic of Croatia, an empirical survey was conducted between May 2015 and June 2017 on a randomly chosen sample of the young people from 13 to 30 years of age who live and study in the Republic of Croatia. Research was conducted in the form of a questionnaire, which allowed respondents to anonymously answer the questions. In order to reduce bias in sampling it was necessary to ensure that each member of the population has an equal chance of being chosen, and therefore these approaches were applied: in-situ interview in elementary schools and high-schools - mostly for the youngest respondents who needed permission of their parents to participate in this survey; creation of flyers with a link on the survey that were left in many different schools, faculties, sport clubs and youth clubs; creation of the Facebook page named “The professional orientation of youth in the Republic of Croatia” which included a digital invitation and link to the survey and gathered 199 followers; creation of an email invitation that was sent to all these schools, faculties, sport clubs, youth clubs and youth network members who showed interest to participate. Moreover, all the respondents were asked to invite their friends and colleagues to participate in the research. The final result was the research sample that included a total number of 996 (N) respondents who had completed the questionnaire, which represented 0.12% of the total population of individuals from 13 to 30 years of age in the Republic of Croatia in the middle of 2017 (DZS, 2018) .
The research was based on a wide set of different scientific methods. Historical method was used to present the results of previous studies and the current situation regarding vocational guidance in the Republic of Croatia. In order to test whether the youth of the Republic of Croatia needs the service of professional guidance, the survey method (N=996) and the methods of descriptive and inferential statistics were applied.The questionnaire had 20 questions. The first 5 questions were used to describe the research sample, while other 15 questions investigated the professional orientation of respondents and other closely related issues. Through systems thinking presented, the research identifies vocational guidance as a crucial component of economic, educational and social systems that create satisfied and successful individuals.
3. RESULTS
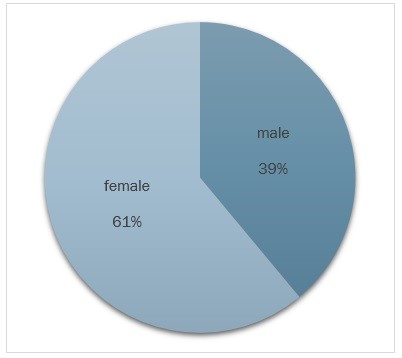
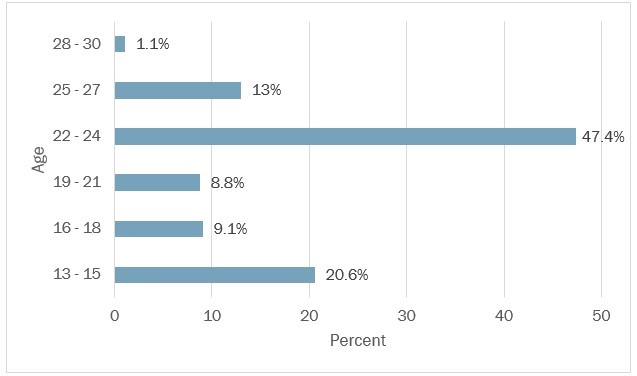
This survey encompassed a total of 996 (N) respondents, out of which 608 female and 388 male participants. Figure 1 shows the relative frequencies of women and men in the conducted survey, while figure 2 shows the relative frequencies of respondents by age.
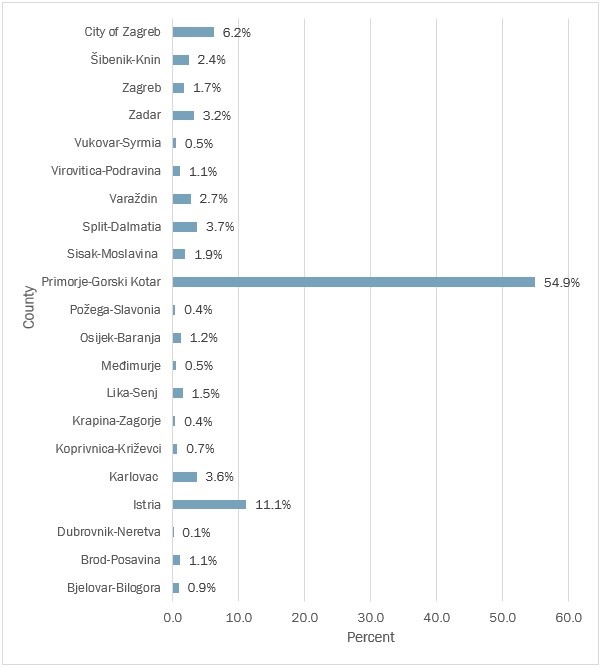
The third question tried to identify in which Croatian counties the respondents resided. The majority of the respondents were form Primorje-Gorski Kotar, Istria and Zagreb, while other respondents were represented in slightly smaller frequencies (see figure 3).
By using a Likert scale from 1 (it does not describe me at all) to 5 (it fully describes me), in the fourth question the respondents rated eight different statements that were used to measure their attitudes toward work. Distributions are not normal, but this is expected because of a fairly large sample. In such cases, it is necessary to check the skewness (that should not go over +/- 0.80). Further analysis has shown that skewness is within the limits that allow the use of parametric procedures (t-test, ANOVA). Table 1 shows mean values and std. deviations for eight different statements. According to the results in Table 1, it is possible to conclude that the respondents that were part of our research are quite convinced that hard work and sacrifice will be worth the effort (M = 4.02, SD = 0.937). However, this positive belief slightly drops among older respondents. As the time pass, some of them encounter difficulties and disappointment as they realize that personal effort and rewards are not always in strong correlation. Despite of this, most of young people are inclined to believe that their rewards will come after they invest a lot of time and energy in order to achieve their goals. On the other side, the youth of Croatia adopted a strong ethics that suggest that winning should always be in balance with means and price that they pay for that win. In other words, success is not so attractive if it is achieved by cheating or accompanied with a loss of friendship and disrespect of peers.
(1- it does not describe me at all; 5- it fully describes me)
Source: Made by author
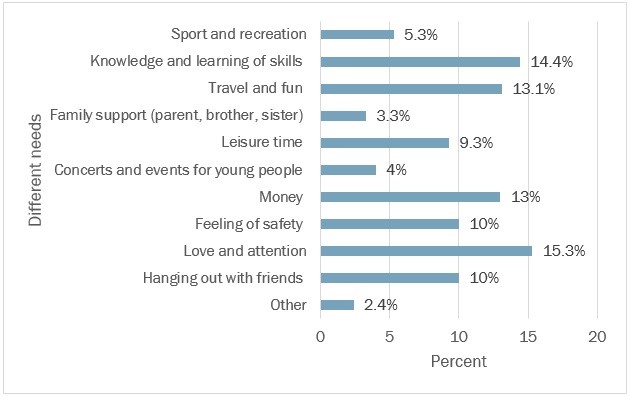
From the third statement it is possible to conclude that the inclination for learning increases with age. This is quite an expected result. Through maturing, young people begin to realize that gaining of specific knowledge allows them to be just what they want to be. Similar to the previous statement, but with less intensity, the number of personal interests increases with age. Hence, it becomes harder to keep focus on every specific thing. However, having a lot of different interests that hinder focus is characteristic only of the most creative individuals and thus it is not a feature that describes all the participants of this research. Empirical results clearly show that the young, at least those that were part of our research, do not look at their future with too much optimism. Regardless of that, young people are still not so much concerned about insecurity that the future might bring. Interestingly, only after they reach the age of 25, a period in which they begin to work and live independently, young people start to feel the pressure of insecurity. It is positive that most of the respondents do not share belief that they learn and work because they have to meet the expectations of others. It is more likely that they learn and work because they want to achieve their own goals. Even though the young believe that work and commitment bring better opportunities to achieve successful life, as they getting older they become more inclined to believe that learning and working do not guarantee personal success.This result is also expected, especially in periods when some of young adults plan to attend college, while others do not have this opportunity and when they discover that many vacancies are not equally accessible to everyone. Moreover, the respondents were asked to identify one thing which they miss most in order to feel happy. This question offered ten different choices and one open field for a free entry. Figure 4 shows frequencies of different answers.
The next question was addressed to young people between 13 and 15 years of age and it tried to find out which secondary school they would like to attend. Among 237 respondents who provided their answer to this question, almost 17% of the respondents still do not know which secondary school they would like to enrol in, which means they urgently need professional counselling services (see figure 5). Female respondents rather choose grammar school (34.6%) and art school (7.9%), while male respondents rather choose vocational school (56.3%). Among those who do not know which high school they would like to enrol in, there is a slightly higher proportion of male (19.6%) than female (15%) respondents.
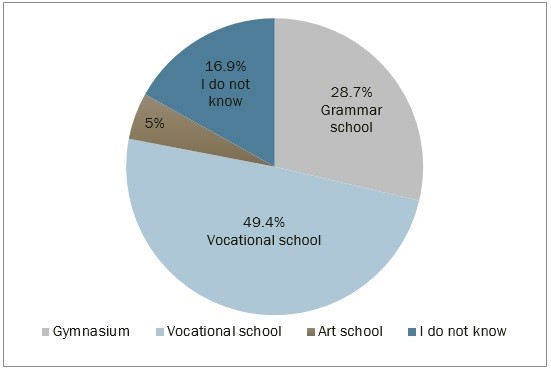
Source: Made by author
The seventh question addressed young people between 16 and 18 years of age and it tried to find out which faculty they would like to attend. Among 147 respondents who answered this question, only 0.7% of them stated that they do not want to enrol in a faculty (see Figure 6). Female respondents rather choose medicine and health (22.4%), social sciences (16.5%), humanities (11.8%), and biotechnology (9.4%), while male respondents rather choose engineering (50.8%) and natural sciences (7.9%). However, the most interesting fact is that 17% of respondents between 16 and 18 years of age do not know which faculty they would like to enrol in and these young people are among the first who need professional VET services. The same as in the previous question, among those who cannot decide on a specific course of study, there is a slightly greater proportion of males (19%) than females (15.3%).
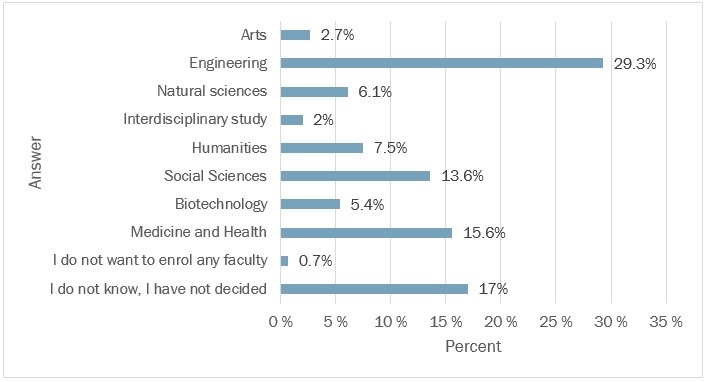
Source: Made by author
Table 2. shows that when deciding about their educational direction, the young rely mostly on themselves and their own estimates. This result is in accordance with the findings of other authors, such as Noshina et al. (2014) , who also confirm that „personal choice” has a strong and direct impact on career selection. All other listed subjects have substantially lower influence on educational direction of the respondents. On a scale where 1 means the minimal influence, and 5 the maximum influence, only parents (M = 2.42, SD = 1.229), friends (M = 1.78, SD = 1.004) and siblings (M = 1.60, SD = 1.052) have got slightly higher scores.Given that parents have the most important role, Ulrich et al. (2018) recommend strengthening parents’ competences in order to enable them to better assist their children in making suitable career choices. Quite surprisingly, teachers (M = 1.54, SD = 0.932) and external experts (M = 1.34, SD = 0.828) had very low scores regarding their influence on educational direction of the youth of Croatia.
| Parents | I have decided myself | Close relatives | Friends | Teachers | Experts (e.g. trainer) | Brother or sister | |
|---|---|---|---|---|---|---|---|
| Mean | 2,41 | 4,50 | 1,42 | 1,78 | 1,54 | 1,34 | 1,60 |
| Std. Deviation | 1,229 | ,877 | ,818 | 1,004 | ,932 | ,828 | 1,052 |
N=991 Source: Made by author
In the next question, the respondents were asked to evaluate nine factors that could affect their education direction. As it can be seen in table 3, most of these statements got very low scores which means that they do not have particular impact on the educational direction of the respondents. The highest scores were given to the statement that this school/faculty represents a good platform for further education (M = 3.78, SD = 1.275). Similar to data for the previous question, scores in table 3 also confirm that one part of students still relies on advice from their parents when they have to choose their educational path. Choices of siblings and friends have low impact on respondents’ educational direction. Youth rebellion usually takes form in the violation of societal norms and parental advices. With the statement „I have chosen this high school / college because my parents do not support it“, this research has tried to measure how many respondents show elements of youth rebellion. The collected results show that such behaviour is very rare among the young when they are making their decisions about their education.
N=990
Source: Made by author
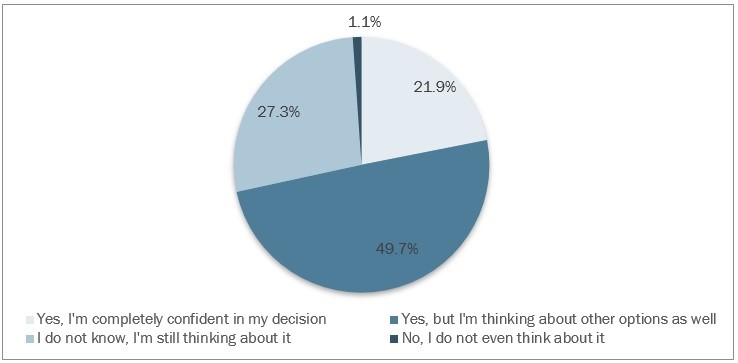
In the next question, the respondents were asked whether they had decided what will be their occupation. It seems that at transitional moments of their lives, such as the completion of high school and faculty, the respondents were slightly more confident in their decisions about the occupation they want to deal with. When this transition periods pass and when they become faced with difficulties in the implementation of their own choices, their confidence in terms of career decisions decreases. Even though by the end of their study period they should be clearly focused on development of their own careers, almost half of the respondents still do not know what their occupation will be. These respondents urgently need help from VET professionals.
In order to get a detailed picture of the preferences of their future occupations, the respondents were asked to specify the industry in which they would like to work. In figure 8 vocational plans of the respondents were compared with the relative number of people with paid employment (1.143.328) in the Republic of Croatia in January 2017 (HZZ, 2017) . As it can be seen in figure 8, the majority of respondents (20.3%) would like to work in professional, scientific and technical services, which is quite surprising given that in the Republic of Croatia only 4.6% of workers that are currently employed in this activity. Nevertheless, such results are in line with existing labour market trends, according to which only professionals with highly developed scientific and technical skills can be sure that they will find or retain well-paid employment (WEF, 2014) . The biggest difference is in the manufacturing industry, where only 0.8% of the respondents stated that they would like to develop their career in this sector even though 17.8% of employees in Croatia are currently working in manufacturing industries. One possible explanation of such differences is that the respondents simply predict that some activities in the near future will be more needed on than others. Another possible explanation of these differences is that some respondents have not participated in career guidance activities that could help them to adjust their career plans with future trends in the labour market. Young people usually hold some stereotypes about the types of jobs that are appropriate for men and women (Millward et al., 2006) . Regarding the gender of respondents, even in this research is possible to notice some interesting differences. While female respondents prefer the real estate activities, human health, social work, education and public administration, male respondents rather choose professional, scientific and technical activities, information and communication, tourism, arts, entertainment and recreation activities for their future occupation.
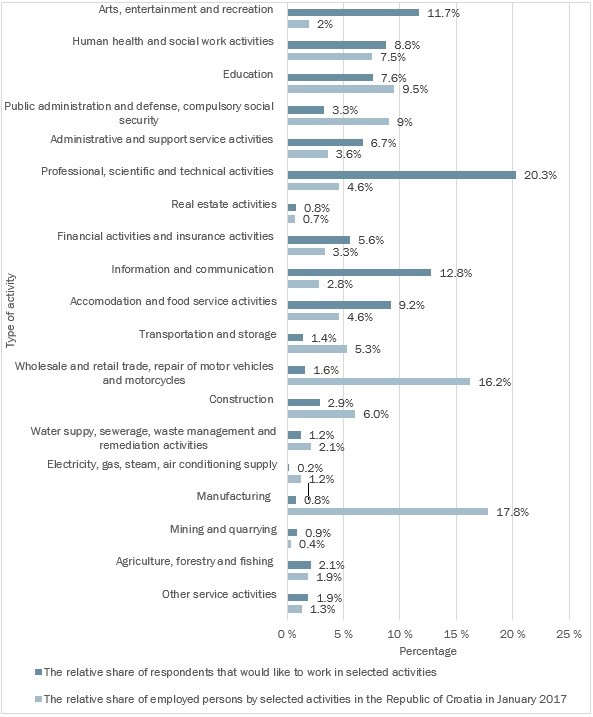
Source: Made by author / DZS (2017)
In order to get more details about the factors that motivate youth to choose a specific profession, the respondents were asked to evaluate eight different factors by using a Likert scale from 1 (minimum) to 5 (maximum). The mean values that indicate the importance of the offered factors are shown in table 4. The highest mean value was given to a particular personal’s interest for some specific profession. The least important factor in choosing a profession is that someone in the family is already engaged in the job. This is a very different situation compared to the past, when transferring the profession from one generation to the next was a common occurrence.
N=990
Source: Made by author
Figure 9 shows how the respondents assessed their ability to find a job in a selected industry. In answering this question, the respondents used a scale from 1 to 5, where 1 indicates extremely low employment opportunity, while 5 indicates an extremely high employment opportunity. Given that 41.7% of the respondents estimate that they will face some difficulties in finding jobs in occupations they have chosen this research suggests that the Republic of Croatia has substantial structural problems within its educational system which educates a substantial part of young people for occupations that are not needed on the labour market. Except the fact that this reduces the competitiveness of the economy itself, such a structural discrepancy creates enormous costs of social assistance and retraining for individuals who cannot find jobs in the professions they were trained for.
Source: Made by author
In the next question, by using a scale from 1 to 5 (where 1 means „it does not help me at all“, while 5 means „it is very helpful“), the respondents were asked to estimate to what extent selected activities may help them in finding the way toward a desired profession (see table 5). Completely unexpectedly, most of the offered activities received a fairly low ratings.One of the possible explanations may be that most of the respondents did not have an opportunity to participate in workshops, lectures and courses in order to evaluate the usefulness of such events in their professional development. It is interesting to notice that workshops, lectures and courses outside school and faculty got higher mean scores than those that are held in these institutions. In addition, it is quite staggering that young people do not think that their participation in political and professional organizations can be helpful in development of their professional career.
N=990
Source: Made by author
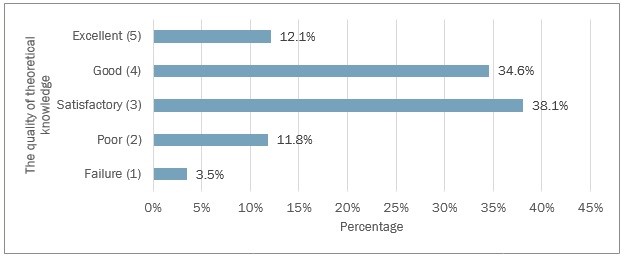
In the next question respondents were asked to evaluate the quality of theoretical knowledge and practical skills that they have learned about the profession that they want to pursue.This question is answered only by the respondents that were 19 years of age and older. In both categories, the respondents of this research give themselves a middle range scores (see table 6).
| theoretical knowledge | practical skills | |
|---|---|---|
| N | 578 | 576 |
| Mean | 3,40 | 3,03 |
| Std. Deviation | 0,963 | 1,160 |
Source: Made by author
The collected results are in accordance with the latest reports of European Commission which suggest that the educational system in the Republic of Croatia needs an urgent reform which will improve the quality of practical skills within its educational system (EC, 2016) . Out of 578 (N) respondents who have answered this question, more than half of them evaluate the quality of the acquired theoretical knowledge about the profession that they want to pursue with grades failure (3.5%), poor (11.8%) and satisfactory (38.1%). Only 12.1% of the respondents evaluate the quality of acquired theoretical knowledge about the profession that they want to pursue as excellent.
Source: Made by author
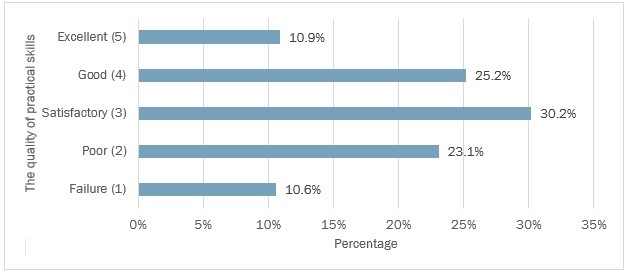
When it comes to the quality of practical skills that young people in the Republic of Croatia have acquired about the profession they want to pursue, the situation is even worse. As figure 11 shows, out of 576 (N) respondents who have answered this question only 10.9% of them evaluate the quality of their practical skills with an excellent rating. Although these results represent only subjective opinions, which cannot be used as the only relevant quality measure, they suggest that the Croatian educational system should put stronger emphasis on teaching of practical skills. In this way, young people will improve their own employment opportunities and competitiveness on the labour market.
Source: Made by author
The previous claims were confirmed through the results to the last question which tried to determine whether the respondents’ talents and preferences for future occupations have ever been tested. Among 338 (N) respondents who have answered on this question, only 29.2% of them were tested in order to recognize their interests and talents for a specific occupation. Almost 62% of the respondents stated that they did not receive any information about the occupations they could deal with after finishing high school or college. The data collected clearly indicate that the respondents did not have access to VET services.
4. DISCUSSION
The main findings of the conducted research are in accordance with the European vocational policy and both suggest that coping with upcoming social challenges and fostering of sustainable innovations can be achieved only through incentives that support vocational education and training (EC, 2011) . A substantial number of young people that were part of this research will experience some problems in finding employment. In order to help those young people and all other workers who will have similar problems, it is necessary to implement an action plan that will: improve the quality of training (initial education, continuing development), improve the quality of teachers, trainers and other professionals in the sector, and make courses more relevant to the labour market (EC, 2016b) . These days, young people live in a time of high uncertainty. Educating young people for occupations that are not or will be not needed on the labour market represents substantial cost and unnecessary loss of energy. However, it is quite normal that some individuals do not know the exact direction in which they want to develop their careers. For young people, vocational education and training should offer options for both employment and further study (EC, 2011:3) . When they need to determine their educational path that should enable them to develop desired careers, the youth of the Republic of Croatia rely mostly on themselves and their own opinions. The research results suggest that very small number of the young in the Republic of Croatia use professional help in VET services. The main drawback of the conducted research arises from the fact that collected answers represent only subjective opinions of the respondents. In future research it would be desirable to examine whether there is a correlation between the success in education and occupation that individuals choose. Since the respondents stated that the main reason for choosing a specific occupation are their specific talents for some occupation, it would be interesting to explore which talents and skills are needed for success in different occupations.
The vocational education and training represent a crucial connection between economic, educational and social systems that create satisfied and successful individuals. Even though theories of career development tend to be primarily psychological in nature, it should not be forgotten that there are many different elements, such as cultural and economic factors, that strongly influence the individual's career development. The individual's choices and decisions, or lack of choices, are shaped by his or her gender, family, disability, sexual orientation, and culture, which in turn influence his or her schooling, access to resources and interaction with the larger environment (Swanson, Fouad, 2014:3) . The economic and social systems in which an individual resides play crucial roles in professional orientation. For example, when the economy is booming, an individual may see many opportunities available and may feel little risk in deciding to leave current job for the one in another organization or field (Swanson, Fouad, 2014:4) . On the other hand, when economy is in a downturn, the same individual may see few opportunities and may not be able or willing to risk any work-related changes (Swanson, Fouad, 2014:4) . Because of this, human resource management is not only concern of a company or organization but also one of the tasks of the state and its institutions (Šverko, 2012) , which should enable adequate combination of work opportunities and professional guidance for its citizens. And last but not least, given that young people can be easily influenced towards certain options, depending on how those options are presented (Jin et al., 2011:5) , it is extremely important to emphasize that career advisors should be very careful, ethical and mindful in all their activities.