
1. INTRODUCTION
In rapidly growing wine market of the EU, wine-products purchasing processes are becoming ever more complex even for accustomed consumers both in the wine markets and in wine tourism destinations ( Hodd et al., 2005 ; Greatorex and Mitchell, 1988 ; Rasmussen and Lockshin, 1999 ).
In the past, wine producers have often tried to better understand and communicate wine quality attributes, by adopting the subjective perception of wine quality obtained by consumers ( Lockshin and Corsi, 2012 ; Szolnoki and Hoffmann, 2013 ; Verdù Jover, 2004 ; Parr, 2011 ; Piqueras-Fiszman and Jaeger, 2014 ; Robinson, Blissett and Higgs, 2013 ). Those studies highlighted the strategic role played by subjective wine quality attributes but suffered from their intrinsic qualitative nature. In European countries, the EU Commission (2018) supplies objective information to food consumers through the adoption of quality logos. By so doing, they describe wines by adopting a geographic, thus supply-oriented, objective approach.
Nowadays, wine consumers attach greater value to the relationship between food/beverage intake and the deterioration and amelioration of their health status (Higgins and Llanos, 2015) . On the one, very negative, hand it is recognized that the risk linking the consumption of alcoholic beverages to the insurgence of cancer of the oral cavity and pharynx increases in a dose-dependent manner ( IARC, 2010; WHO, 2018) . The authors of this study recognize the need to reduce alcoholic beverages intake and reject as superficial the equation of highest-in-healthy-compounds-wines with ‘functional beverage”. On the very positive hand,
a plethora of studies highlight the potential role played by antioxidants including vitamins C and E, carotenoids, flavonoids and thiol compounds (SH) contained in food and beverages in protecting cells of the body from being damaged by harmful free radicals. ( Demming-Adams and William, 2002 ; Scalbert, Johnson and Saltmarsh, 2005 ; WHO, 2018 ). In this vein, health prevention potentials have been highlighted in food within the World Heritage ( Davis et al., 2015 ; UNESCO (2010) , rich-in-antioxidants, Mediterranean Diet and low-fat diets, as well as in grape varieties ( Corder et al., 2006 ; McDonald et al.,1998 ; Granato, Katayama and de Castro, 2011 ) and wine varieties ( Queipo-Ortuño et al. 2012 , Moreno-Indias et. al 2016 , Di Renzo et al. 2014 ). This interdisciplinary study focuses on the need to rank wines according to regional wine-growing production data and biomedical scientific evidence, representing both objective and quantitative data.
Based on this, two research questions are defined:
RQ1: How biomedical data on the Total Antioxidant Activity (TAA) can be used in differentiated marketing strategy formulation of wine producers and wine tourist destinations?
RQ2: Do the Protected Designation of Origin (PDO) support wine’s Total Antioxidant Activity as added value in gaining competitive advantage for wine producers and wine tourism destination?
2. RECOURCES AND METHODS
2.1. PDO and PGI wines
Food stuff production traditions represent one of the most important pillars within
the European Union agricultural product quality policy (EU Commission, 2018) and European Union countries. Those traditions help consumers to recognize intangible quality attributes and assure them that specific products are not imitations of others but try to maintain certain quality attributes over time. The existence of those quality attributes is certified (made objective) by three quality logos: the Protected Designation of Origin (PDO), the Protected Geographical Indication (PGI), and the Traditional Speciality Guaranteed (TSG).
While foods achieving the PDO status must reflect local productive traditions and must be prepared, processed and produced, thus manufactured, within a specific area, those achieving the PGI status must be at least partially manufactured within a specific area. Quite differently, foods possessing the TSG status must possess specific characteristics differentiating them from others in its category from at least 30 years (Tosato, 2013) .
In Italy, the PDO certification includes wines with Controlled Denomination of Origin (DOC) and wines with Controlled and Guaranteed Denomination of Origin (DOCG). Production of such wines is mainly concentrated in Northern Italy, where about 60% of the area is devoted to high-quality wine production (Santeramo et al., 2017: 72) .
The number of Geographical Indications (GIs) in Europe is constantly growing. In May 2017, EU countries numbered 1,579 designations in the wine sector, of which 1,141 were PDO wines and 438, PGI wines. The importance of this segment confirms the fact that during
the last twenty years the numer of GIs for wine in Europe has almost tripled, from 672 in 1996 and 1,177 in 2006 up to 1,579 in 2017 (Qualivita 2017:24) .
The same upward trend in the growing number of GIs in EU is also present in Italy, a country with the highest number of GIs, not only for wines but for Italian food and Italian spirits as well. In May 2017, there were 523 designations in Italy's wine sector, in comparison with 206 in 1996 or 419 in 2006. Of the 523 wine designations, 405 are PDO wines and 118, PGI wines. Their importance for the Italian economy is obvious from the fact that in 2015 the GI wine sector alone was worth 7.4 billion Euros and together with the GI food sector, 13.8 billion Euros, and accounted for 21% of Italian agri-food exports (Qualivita 2017: 26-27) .
Resource Based Theory (RBT), Knowledge Based View (KBV) and the VRIN model
Despite the influence of studies that have found links between firms’ resources and their performance in specific firms and industries (Crook et al., 2008) , there is a general lack of theoretical approaches and related methodologies showing ‘in what way’ and ‘to what extent’ competitors differ in terms of their productive resources ( Hoopes and Madsen, 2008) . This study adopts to the RBT framework ( Penrose, 1959 ; Wernerfelt, 1984 ; Barney, 1991, 2001 ; Sirmon, Hitt and Ireland, 2007 ) and its spill-over called the ‘Knowledge-Based View’, or KBV, ( Grant, 1996 ; Ståhle & Grönroos 2000 ) as conceptual lenses. Following Barney ( 1991 , 2001 ), both frameworks postulate that the defensibility of a firm’s competitive advantage depends on the availability of productive inputs at the same time ‘Valuable’ (above
the average, thus defined 'resources' strictu sensu), ‘Rare’ (concentrated), ‘Inimitable’ (or at least lowly imitable) and ‘Nonsubstitutable’ (not provided with strategically equivalent ones).“ Thus, both the RBT and KBV supply the VRIN model to evaluate the strategic relevance of
a productive input. This study focuses on the heterogeneous antioxidant activity of wines as a productive input and potential source of a defensible competitive advantage ( Peteraf, 1993 ; Peteraf and Barney, 2003 ; Maritan and Peteraf, 2011 ). Furthermore, this study considers only TAA Valuability thresholds, which should be exogeneously determined respect firm’s boundaries, and Rarity representing the first two quality attributes, while their inimitability and nonsubstitutability are going to be considered in a forthcoming study.
2.3. Wine antioxidant potentials and Total Antioxidant Activity (TAA-I) approach
Antioxidants are ‘substances that when present in food, beverage or in the body at very low concentrations can delay, control or prevent oxidative processes leading to food quality deterioration or initiation and propagation of degenerative diseases in the body’ (Shahidi and Zhong, 2015: 757) . Fruit, vegetables and selected beverages contain thousands of structurally different phytochemicals, a large part of which are polyphenols having different potential antioxidant activity ( Scalbert and Williamson, 2000 ; Pietta et al., 1995 ; Ghosh and Scheepens, 2009 ; Habauzit and Morand, 2012 ; Holt et al., 2009 ).
Wine represents one of the most chemically complex beverages. It contains >200 phenolic and antioxidant compounds (German and Walzem, 2000) , most of which are derived from the skin of grapes (Howard et al., 2002) . Scientific evidence indicates that the antioxidant potential of the nutrients found in red wine and the Mediterranean Diet can be an essential component of a holistic approach to facing chronic non-communicable diseases linked to inflammation. Moreover, the effect of red wine in association with a pro-oxidant meal and
an antioxidant meal was studied by Di Renzo et al. (2010) , Lagouge et al. (2006) , Schirmer et al. (2012) , Mukherjee et al. (2009) and De Nisco et al. (2013) . By inhibiting oxidation processes, anti-oxidants can play an important role in preserving foods and contributing to health promotion as already done by functional food ingredients, nutraceuticals and dietary supplements (Gresele et al., 2011) . Therefore, the antioxidant potentials of wine have become of great interest in ranking wines.
Wine TAA evaluated with the method of Rice-Evans and Miller (1994) represents
a spectrophotometric measurement technique quantifying the relative abilities of phenolic antioxidants in a given food to scavenge specific radicalcations in comparison with
the antioxidant potency of standard amounts of Trolox’, which is a water-soluble compound like vitamin E used in biological or biochemical applications to reduce oxidative stress or damage and achieve optimal antioxidant performances (Simonetti, 1997) . For the purposes of this study, the Total Antioxidant Activity Index (TAA-I) index may be described as
the above-average TAA achieved by a specific vine variety.
2.4. Consumer willingness to pay for hidden wine quality attributes and differentiated marketing strategy
In the contemporary wine market the consumer behaviour have changed significantly along with lifestyle, food integrity, ethical and sociological sustainability factors, electronic communication and which affected on demand for quality and customisation (Virtuani and Zucchella, 2008) . For that reason the understanding of consumer attitudes and perceptions are essential in the marketing field and necessary to develop effective production and marketing strategy (Botonaki and Tsakiridou, 2004) .
The aspect of “quality” has increasingly gained in importance, especially as a central ingredient of marketing that adds value to the product and positively differentiates it in ways recognized by consumers (Botonaki and Tsakiridou, 2004:91) . Antonelli (2004) point out that the product differentiation can be increased working on the quality features that satisfy
the tangible and intangible consumer expectations, then communicated to the consumer so that the value differential can be perceived by the consumer, make him willing to pay
a premium price (Virtuani and Zucchella, 2008:3) . Jenkins & Parrott (2000) emphasise that quality is able to command a market benefit in the form of a price premium and give competitive advantage to products, processes, producers or regions (Botonaki and Tsakiridou, 2004) .
The PDO and PGI are objective quality attribute certifications. In comparison with foods and other beverages, wine is more suitable for PDO and PGI certification. Differently aromatized wines and spirits are mostly eligible for PGI recognition. It is also important to point out that the TSG logo focuses on interlinking production processes and production traditions, while the PDO and the PGI logos focus on links existing between products and the place of origin. That characteristic makes both PDO and PGI logos suitable to be considered objective. From the results of the Skuras and Vakrou (2002) survey conducted on Greek origin labelled wine, revealed that certification in the form of PDO or PGI targets a highly educated consumer which usually have higher incomes, attracted to wine quality characteristics and are willing to pay a top up to average price. The price premium for denominated products bears the cost of a quality assurance scheme signalling to the consumer concepts of an authentic, healthy, safe and traditional product. The method commonly used to determine the amount consumers would pay for products or the attributes of the products is willingness to pay – WTP (Ogbeide et al., 2015) . Thus, valuability of both the PDO and PGI depends on consumers' willingness to pay for a product covered by them, which varies across different periods and countries of origin. Nevertheless, consumers seem to show a greater willingness to pay for GI-labelled than for non-GI-labelled products, especially when it comes to evaluating the value of high quality products such as oils or wines. Furthermore, they tend to value PDOs more than PGIs (Menapace et al., 2009) .
Consumer willingness to pay for hidden wine quality attributes represents a determinant in developing tourism marketing strategies (Mikulić et al., 2016) Bain (1968) point out following differences which create added value: product and servise quality and characteristics; image, reputation and assortment; familiarity with brand; promotional activities and location advantage in the industry (Renko, 2009) . Regarding this, differentiated marketing strategy means that the company must create or add to the product or service some new features that are unlike those offered by the competition and consumers evaluate them useful and important (Renko, 2009:296,300) .
When based on market segmentation a particular segment is identified, which is willing to pay an extra amount of money for wine quality features, differentiated marketing strategies should be implemented for target this segment. The TAA-Index proposed in this article presents quality criterion for wine differentiation and its positioning on the market, which should be communicating to the consumer through implementation of promotional strategy. Promotional strategy for which will choose a wine company will include a mix of shares and means subordinated to the overall marketing objectives of the company and built so
a contribute to achieving them with success , adapted to the external environment and to
the specificity of wine product (Matei, 2014: 608) .
In the context of tourist destination, the number of PDOs is a key determinant of tourism flows. The number of PDOs, both for wine and other products, plays a significant role in
the sense that the higher the number of denomination of origins the higher is the number of tourists. It also indicates that marketing campaigns, through wine exhibitions and policies to promote food and wine quality, are likely to be a catalyst for inbound tourism (Santeramo et al., 2017: 72) .
2.5. Wine sample studied
As previously mentioned, the setting-up of homogeneous thus comparable databases for biomedical, strategic benchmarking and marketing purposes represents an issue. In Italy, which is the country focused by this paper, the seminal study (Simonetti, Pietta and Testolin, 1997) compares exhaustively the phenols-related total antioxidant activity of thirteen wines. This study selected ten types of red (grape harvest years-vintage: from 1991 to 1994) and three white (1994-1995) commercially available wines for the purpose of comparing their polyphenol contents and total antioxidant activity.
White wines were considered as a control group given the higher antioxidant activity of red ones. This wide portfolio of wine products creates a dynamic marketplace, causing consumers even greater difficulties and making purchase decisions even more complex ( Hodd et al., 2005 ; Greatorex and Mitchell, 1988 ; Rasmussen and Lockshin, 1999 ) . For
the purpose of quantifying wine rarity, data on the regional production of wines provided by the Italian Institution for Agro-Food Market Services (ISMEA) have been adopted and analysed. Table 1 synthesizes the kind of wines, grape varieties, vintages, grapes and wine brands considered here.
3. RESULTS
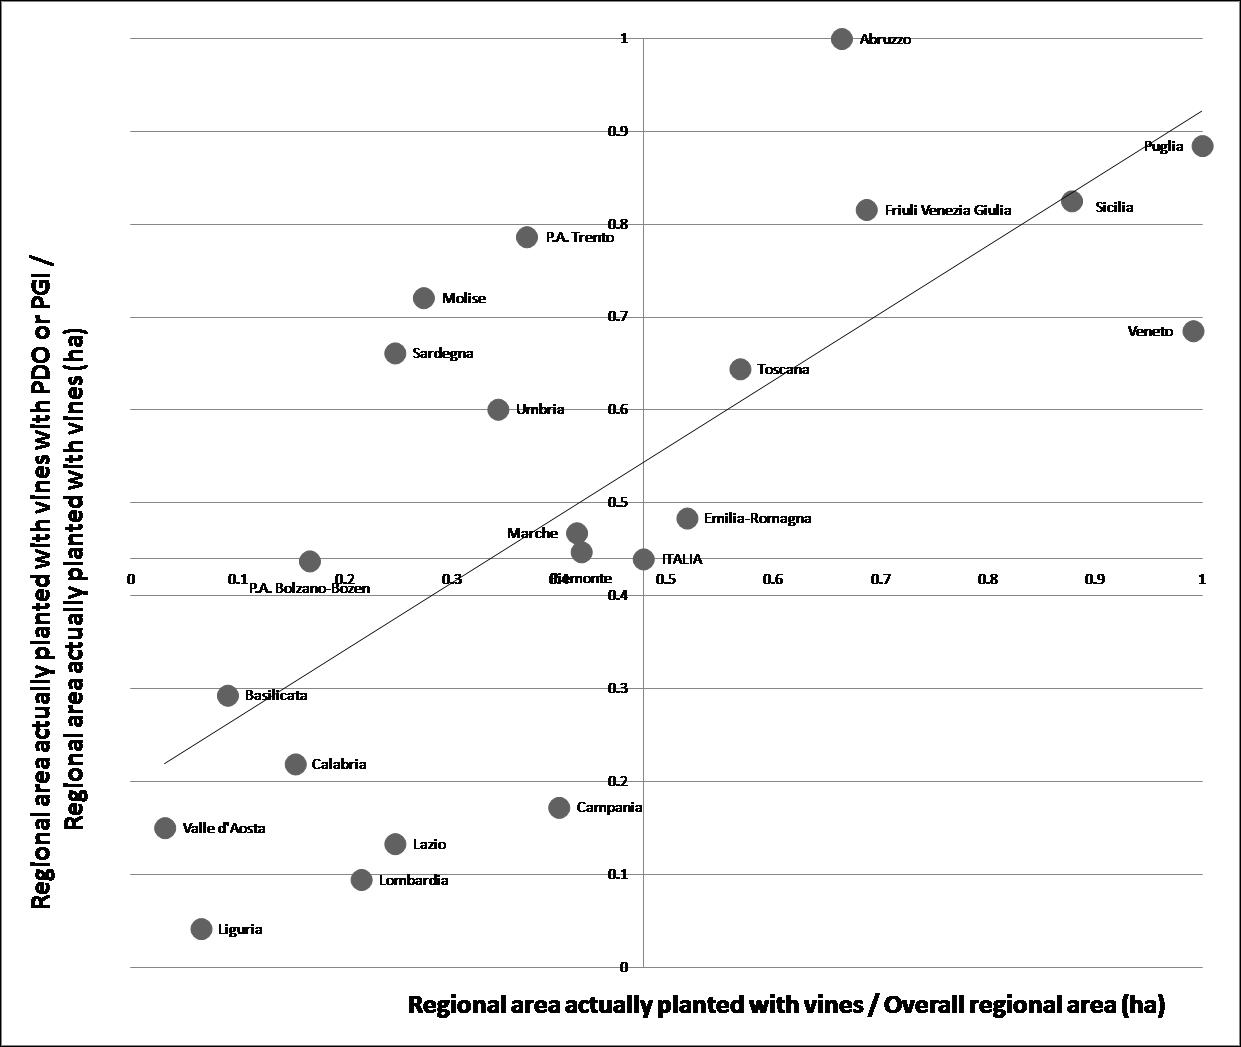
Graph 1 represents the relationship existing between two ratios: Regional area actually planted with vines / Overall region area (X-axis) and Regional area actually planted with vines with PDO or PGI / Regional area actually planted with vines (Y-axis). Data for the year 2016 have been adopted and two 0-1 normalized scales have been obtained by parametrizing each value to Y-axis and X-axis maximums. Two valuability thresholds, X and Y, have been established by considering average (Italy) results of 0.478 (x) and 0.439 (y). By this way, six administrative units (regions: Puglia, Abruzzo, Sicilia, Veneto, Friuli Venezia Giulia, Toscana and Emilia Romagna) achieve above-threshold wine growing vocations, considering both of the given valuability thresholds. On the opposite, seven administrative units (Liguria, Valle d’Aosta, Lombardia, Lazio, Calabria, Basilicata and Campania) do not exceed either of the thresholds. The administrative units P.A. Trento, Molise, Sardegna, Umbria, and Marche achieve above-threshold wine growing vocations but only with regard to population. Last but not least, P.A. Bolzano and Region Piemonte occupy positions which are very close to the same valuability threshold. Thus, vine growing vocations seem quite heterogeneous for the 21 administrative units (19 regions and 2 provinces) which have been considered.
Graph 2 shows the valuability of vines areas of origin considering the area (ha) planted with vines covered with PDO and, or PGI / the Total area (ha) planted with vines.
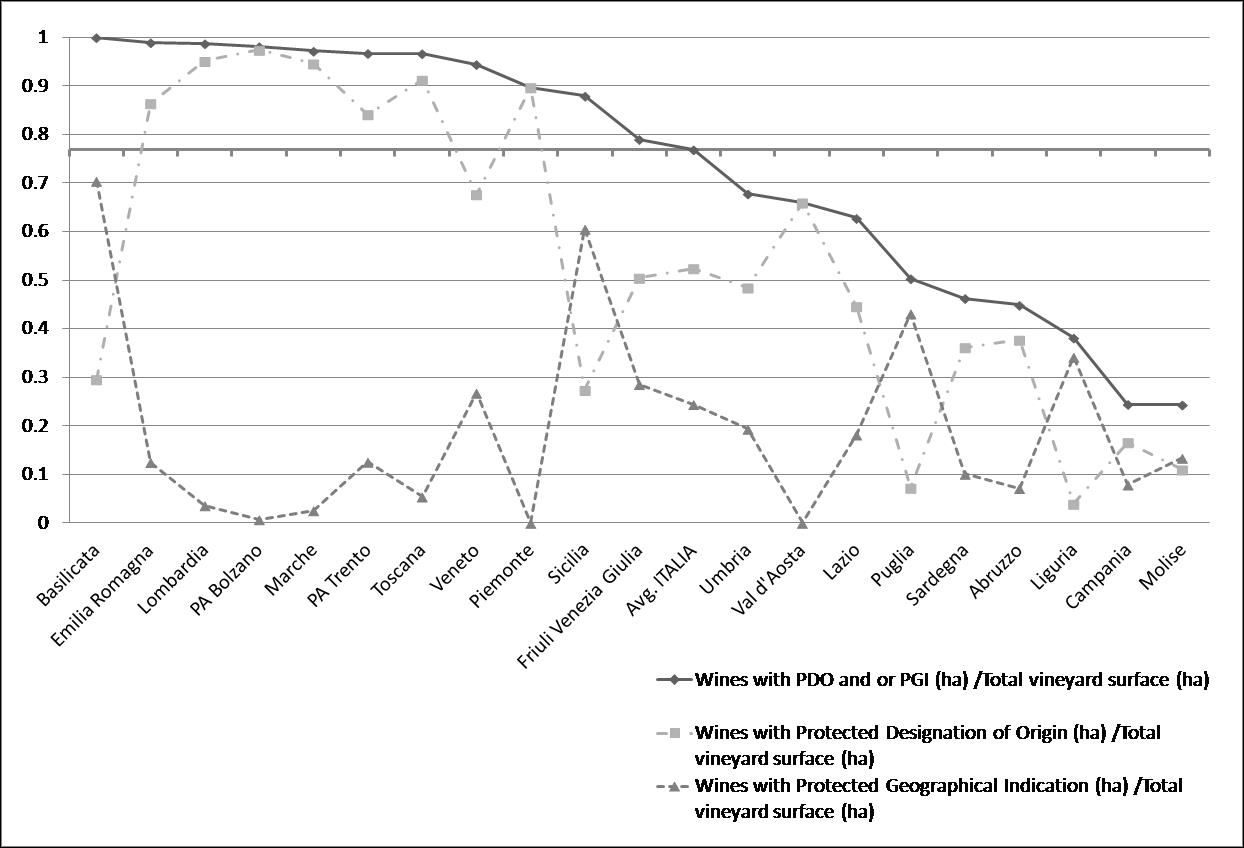
For the purpose to establish a valuability threshold which considers both PDO and PGI labels, the ratio achieved by Average Italy (0.76903) has been assumed by considering
the standardized values of the ratio between Wines with PDO and or PGI /Total vineyard surface expressing high-quality wine growing traditions. Administrative units reaching above-threshold, thus valuable, positions are Basilicata, Emilia Romagna, Lombardia, Autonomous Province of Bolzano-Bozen, Marche, AP of Trento, Toscana, Veneto, Piemonte, Sicilia, and in the Region of Friuli Venezia Giulia. On the other hand, that ratio does not exceed
the valuability threshold in the remaining ten administrative units, six of which are located in Central and Southern Italy.
Graph 3 portraits an antioxidant-based ‘winescape’ (Peters, 1997) . It ranks those wines by considering the dichotomic position (valuability/non valiability) of their TAA-Indexes moving along a normalized (0-1) scale respect the overall average value (0.451) resulting from considering GAE (0.484), CE (0.373) and TAA (0.495) average values.
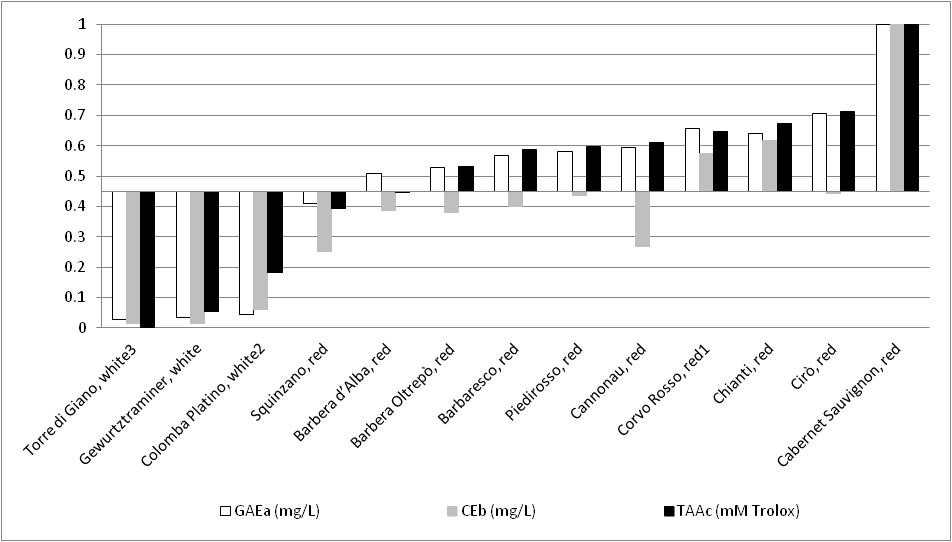
Source: Droli elaboration on Simonetti et al. 1997 database, Normalized values
Considering the TAA levels, these wines could be split in groups 1 and 2. Group 1 encompasses three whites (Torre di Giano, Gewurtztraminer, and Colomba Platino) and, surprisingly, two red wines (Squinzano and Barbera d’Alba) whose TAA levels are below the average. Group 2 includes eight red wines (Barbera Oltrepò, Barbaresco, PIedirosso, Cannonau, Corvo Rosso, Chianti, Cirò and Cabernet Sauvignon) whose TAA levels exceed the valuability threshold. Thus, the TAA index of white wines and especially red wines encompassed in the Group 1 cannot represent a productive resource for strategic marketing purposes and viceversa. CE levels and GAE levels seems weakly and / or strongly related to TAA levels suggesting the important role of the latter index as a proxy mediating their positions. Among whites, Torre di Giano achieves the lowest, thus below threshold and not valuable GAE, CE and TAA levels. Last but not least, GAE CE and TAA indexes achieve
the highest, above threshold thus valuable, level in Cabernet Sauvignon representing
the best red wine, among those targeted, when considered for its antioxidants and valuable when comes the need to define marketing strategies based on antioxidants in wines.
4. IMPLICATIONS AND LIMITATIONS
A RBT-rooted TAA-I wine quality benchmarking system represents one of the first outcomes produced by applying this interdisciplinary perspective.
As underlined above, the wide array of wine products both within wine tourist destinations and in the global wine market creates a complex marketplace, which causes consumers great difficulty when making a purchase decision ( Hodd et al., 2005 , Greatorex and Mitchell, 1988 ; Rasmussen and Lockshin, 1999 ). Despite this, the growing competition is always bringing even more tourism destinations to set-up benchmark tools (Backendorff and Shu, 2019) . The application of the TAA-I proposed here could help to make both wine producers and wine consumers aware of the hidden properties of the selected white and red wines.
Regarding RQ1, up to date, the global wine market has been segmented by the adoption of five differentiation criteria by taste, by wine style, by color, by body type, and by geography (Mordor Intelligence, 2018) . Nevertheless, in the above mentioned wine industry, a growing number of wine producers and wine tourist destinations augment the need for new, objective, and evidence-based wine differentiation criteria. The TAA-Index proposed in this article represents the sixth differentiation criterion and hidden wine quality attributes of the selected PDO wines, which can be used as additional wine quality attribute and added value for consumer. Mattiacci, Ceccotti and de Martino (2006) pointed out health as one of the wine hedonic attributes which contribute to the consumer creation of value (Virtuani and Zucchella, 2008) . If we take in consideration previously explained antioxidant influence on health, TAA-Index as such can be used as criterion of differentiation between wines and their positioning on the market. This added value, which represents TAA-Index, should be communicating to consumer in efficient way, that the value differential can be perceived by the consumer and make him willing to pay a premium price (Virtuani and Zucchella, 2008) . The effort to inform people about PDO label is of major importance when taking into account that as the confidence in the PDO label increases, the willingness to pay for a quality wine also increase (Botonaki and Tsakiridou, 2004:97) .
In respect to RQ2, TAA-I in Cabernet Sauvignon, which is an internationally scattered vine variety, achieved the highest position. Thus, competitive advantage of vines in TAA_I is far from being expressed and thus promoted by adopting PDO labels. In other words, the PDO are not supporting decision makers when it comes to wine antioxidants. Lack of knowledge in antioxidant potentials can result in suboptimal marketing strategies both on the level of individual wine producers and on the level of the wine tourist destination. For that reason promotional strategy should be implemented for improving knowledge and awareness in antioxidant potential and their influence on health, which will in accordance with identified consumer behavior patterns in communication on the target market and wine market specificities.
This early, interdisciplinary study is burdened by some limitations. In dynamic terms, there is a high variability in wine antioxidants arising from different vintages, ageing, region and winemaking procedures (Heras-Roger, Díaz-Romero, Darias-Martín, 2016, p. 1226) . Thus, TAA-I may achieve very heterogeneous levels across space and time even within the same grape variety. Nevertheless, the heterogeneity of competitive positions and their dynamics represent two of the main assumptions at the core of the Resource Based Theory and call for further studies.
5. CONCLUSION
In the last century, substantial gains were achieved in economic growth and living standards. These advancements are now threatened by the crisis in NCDs, (Beaglehole, 2011) . Consequently, the interest to evaluate the antioxidant potentials of red wines in relation to their antioxidant constituents seems to be growing (Wine Spectator, 2017) .
Scientific evidence on antioxidants can be adopted to guide wine producers and wine tourist destination managers in increasing the quality of both wines and wine tourist destinations, as well as in creating the dynamic capabilities needed (Kaurić, Miočević and Mikulić, 2014) .
The Resource Based Theory and its application could be beneficial for targeted wine industry stakeholders and tourist destination marketing managers interested in gaining a competitive advantage by targeting specific segments of wine consumers based on knowing their willingness to pay for wine quality attributes as a precondition to developing a successful marketing strategy.
By means of adopting the interdisciplinary TAA-I as a benchmarking system, the decision makers acting in both the wine products sector and wine tourism industry could more effectively involve the most relevant sectors in society, that is, the economy, health, environment, agriculture and education, to ensure more research into antioxidants and/or dealcoholized wines to reduce the harmful use of alcohol (WHO, 2017) . This study emphasizes the lack of correspondence among the antioxidant content, antioxidant power and functional capacity of a wine. The results of this study recommend great caution in promoting a single type of wine and destination in terms of TAA-I and call for further studies in this direction. Nevertheless, despite this limitation, the TAA index, where adopted following the RBT assumptions, could allow wine producers and wine tourism destination managers to put in place more-competitive and successful evidence-based marketing strategies. Further studies are needed on the marketing of wines highest in antioxidants and dealcoholized wines.
Attribution:
Droli: 1. Introduction; 2.2. Resource Based Theory (RBT); 2.3. Wine antioxidant potentials and Total Antioxidant Activity (TAA-I) approach; 3. Results
Sarnari: 2.5. Wine sample studied
Basan: 1. Introduction; 2.1. PDO and PGI wines; 2.4 Consumer willingness to pay for hidden wine quality attributes;
All: 4. Implications and limitations; 5. Conclusion;