1. INTRODUCTION
Although projection of the global FDI flows were that FDI will increase by about 5% in 2018 (UNCTAD, 2018), global FDI decreased in 2018 by 13% (UNCTAD (2019). Analysing the FDI flows over the period 1990-2018, it can be concluded that in 1990 more than 60% of FDI inflow in developed countries went to Europe. In the observed period, the share of Europe was highest in 2005 when it exceeded 80% and after 2005 share of Europe started to decline to 31% in 2018.
In order to stimulate economic growth countries liberalise trade, the movement of capital, and even the labor. Related to FDI, they liberalise the movement of capital expecting positive effects on their economy from FDI inflows. The trends of proliferation and deepening regional economic integrations led to the liberalization of the movement of capital within and beyond regional economic integrations (Bilas, 2007). Developing countries try to attract more FDI with their incentives due to the expectation of a positive impact on the host economy (Kersan Skabic, 2013).
Many authors examined the effects of FDI on the host economy (Carbonell and Werner, 2018). There is a spread belief that FDI promotes economic development (Alfaro et al., 2010;Hunady and Orviska, 2014), especially in developing countries (Sokang, 2018).De Mello (1997) found that impact of FDI on output growth in the host economy depends on the scope of efficiency spillovers to domestic firms.Borensztein, De Gregorio and Lee (1998) examined the effect of FDI on economic growth for the period 1970-1989 on the sample of 69 developing countries and concluded that the effect of FDI on economic growth is dependent on the level of human capital available in the host economy.Gürsoy, Sekreter and Kalyoncu (2013) found biased results on the relationship between GDP and economic growth in the observed period 1997-2010.
Iamsiraroj and Doucouliagos (2015) applied meta-regression analysis to 946 estimates from 140 empirical studies. They found robust positive correlation between economic growth and FDI, significantly larger for single country case studies than with cross-country analysis. Similarly,Ozturk (2007) analysed literature on the relationship between FDI and economic growth and found that consensus has been reached that FDI tends to have significant effect on economic growth through multiple channels. On the other hand,Alfaro et al. (2010) claim that empirical literature finds weak support for an exogenous positive effect of FDI on economic growth.
Jirasavetakul and Rahman (2018) found FDI has played a strong role in the export-led growth of new European Union member countries.De Mello (1999) found on the sample of OECD and nonOECD countries over the period 1970-1990 that extent to which FDI fosters economic growth depends upon the level of complementarity and substitution of FDI and domestic investment.Ekananda and Parlinggoman (2017) found positive role of FDI and domestic investment on economic growth on the sample of 50 countries over the period 1992-2014.
Kurecic and Kozina (2017) examined the correlation between GDP and FDI in EU15 countries over the period 1980-2014 and found most of the EU15 member countries show a significant correlation.Tang (2015) examined the FDI effects on economic growth of the European Union member countries over the period 1987-2012 and concluded that EU countries can maintain sustainable higher growth by attracting more FDI.
Angelopoulou and Liargovas (2014) examined the relationship between FDI and economic growth for three group of countries, EU members, EMU members and transition countries, over the period 1989-2008 and found no robust causality relationship between FDI and economic growth.
Hlavacek and Bal-Domanska (2016) examined the impact of FDI on economic growth on the sample of Central and Eastern European countries (Czech Republic, Estonia, Hungary, Latvia, Lithuania, Poland, Slovakia and Slovenia) over the period 2000-2012 and found statistically significant relation between FDI and GDP, as well as growth of the FDI positively impacts growth of the GDP.Carstensen and Toubal (2004) examined the determinants of FDI into Central and Eastern European countries in the period 1993-1999 and identified the factors which encourage inflow of the FDI: market potential, low relative unit labor costs and skilled labor force. On the other side,Dhakal, Mixon and Upadhyaya (2007) on the same sample of countries for the period 1995-2004 found following determinants of FDI: real exchange rate, openness of the economy and deregulation. Furthermore,Jude and Pop Silaghi (2016) examined the impact of FDI on aggregate employment in Central and Eastern European countries for the observed period 1995-2012 and found a negative short run effect on employment which becomes positive in the long run.
Schmitt and Alexiou (2016) examined the FDI led growth hypothesis in Ireland over the period 1976-2011, using annual data. They found, among others, significant relationship between FDI and GDP, as well as unidirectional Granger causality from GDP to FDI. Similarly,Sârbu and Carp (2015) found that FDI has a positive effect on the economic growth in Romanian over the period 2000- 2013.
Kikerkova et al. (2018) examined the impact of the FDI inflow on the economic growth of Macedonia over the period 2003-2015 and found positive bidirectional relationship, higher GDP can lead to higher FDI inflows, as well as the increase in FDI can cause positive reaction to the economic growth.
Mahmoodi and Mahmoodi (2016) examined the causal relationship between FDI, exports and economic growth in two panels of developing countries - eight European developing countries over the period 1992-2013 and eight Asian developing countries over the period 1986-2013. They found in the European developing panel bidirectional causality between GDP and FDI, as well as unidirectional causality from GDP and FDI to exports and for Asian developing panel bidirectional causality between exports and economic growth in short run. However, they found in the long run causality from export and FDI to economic growth, and causality from economic growth and export to FDI for both of the panels.
Chowdhury and Mavrotas (2006) examined the causal relationship between FDI and economic growth on the sample of Chile, Malaysia and Thailand over the period 1969-2000 and found GDP causes FDI in the case of Chile (unidirectional causality), while for both Malaysia and Thailand, there is a strong evidence of a bidirectional causality between the two variables.Suliman et al. (2018) found bidirectional relationship between FDI and economic growth - FDI boosts growth and the growth rate stimulates positively FDI inwards, for the Economic and Social Commission for Western Asia countries over the period 1980-2011.Iqbal et al. (2013) examined the relationship between FDI and GDP in Pakistan over the period 1983-2012 and found positive relationship between FDI and GDP. Similarly,Rahaman and Chakraborty (2015) examined the causal relationship between FDI and GDP in Bangladesh over the period 1987-2011 and found long-run equilibrium relationship and Granger unidirectional causality from FDI to GDP.
Empirical evidence of the relationship between FDI and economic growth has been mixed. Therefore, the aim of the paper is to examine the relationship between FDI and GDP in EU15 countries. EU15 makes a group of countries which entered the EU prior to the biggest enlargement in 2004, namely latest in 1995 (Austria, Belgium, Denmark, Finland, France, Germany, Greece, Ireland, Italy, Luxembourg, Netherlands, Portugal, Spain, Sweden and United Kingdom). The hypothesis of the paper is that FDI positively impacts GDP in EU15 countries.
Paper is divided into four parts. After the introduction, second part refers to methodology and data. Third part of the paper presents empirical analysis, results and discussion. Conclusion is given in the fourth part of the paper.
2. METHODOLOGY AND DATA
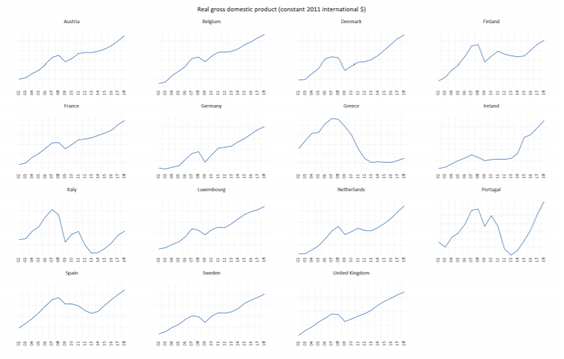
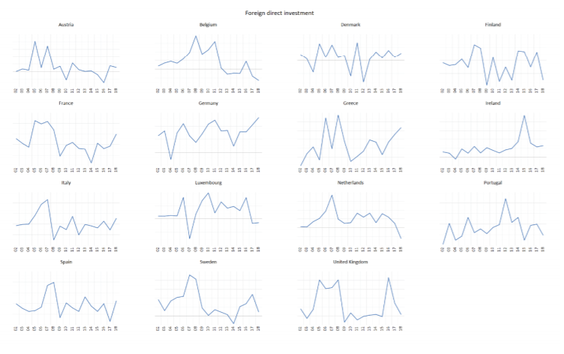
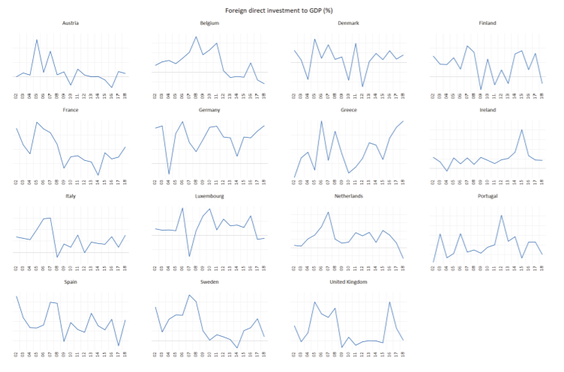
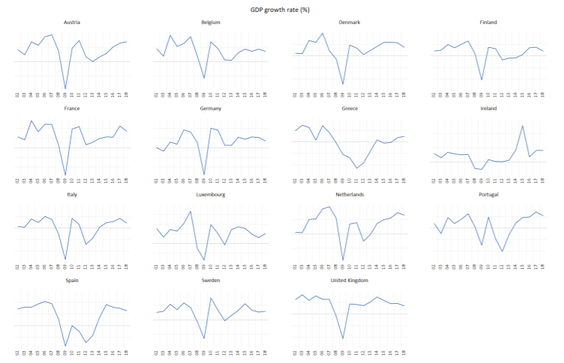
Paper employed different unit root tests, panel cointegration test (ARDL model) and Granger causality test using EViews v. 10 and Stata v. 15 in order to examine relationship between FDI and economic growth in the EU15 countries (Austria, Belgium, Denmark, Finland, France, Germany, Greece, Ireland, Italy, Luxembourg, Netherlands, Portugal, Spain, Sweden and United Kingdom) over the period 2002-2018. This is a balanced panel with 17 observations for each series and each country. EU15 countries make a group of countries which entered the EU prior to the biggest enlargement in 2004, namely latest in 1995 (Austria, Finland and Sweden).
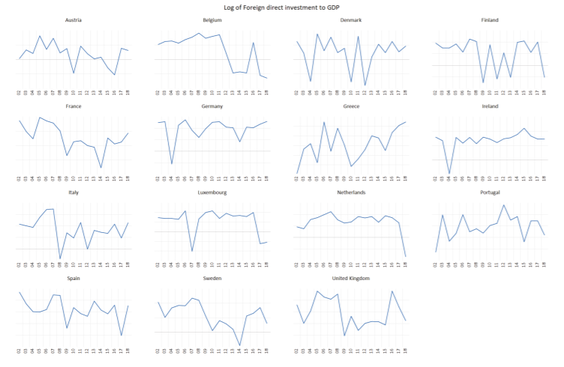
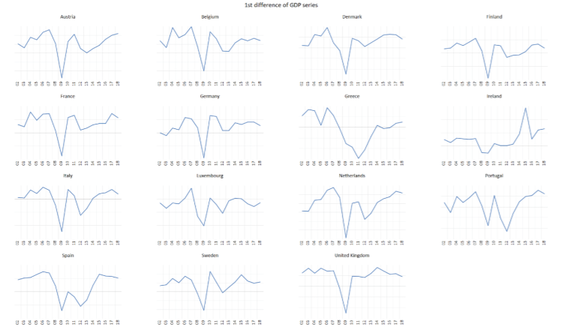
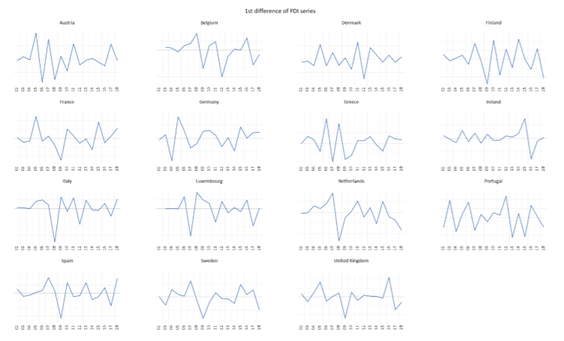
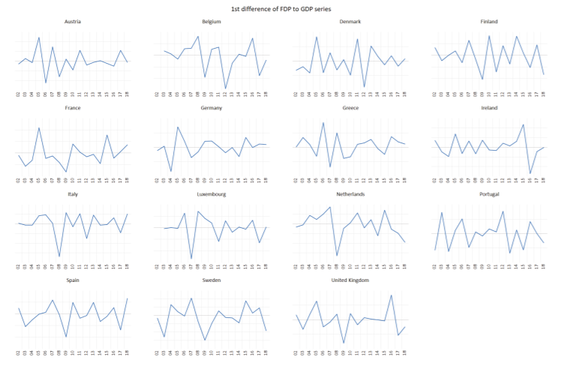
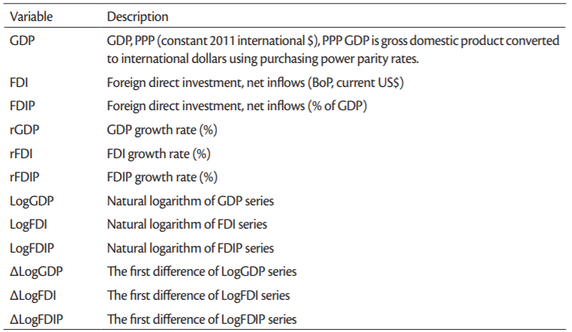
Annual data for FDI and GDP were retrieved from the World Bank, World Development Indicators. Variables’ description is presented inTable 1.
3. EMPIRICAL ANALYSIS, RESULTS AND DISCUSSION
3. 1 Unit root tests
Levin-Lin-Chu (2002) and Breitung (2000,2002) tests are using t—statistic to test the null hypothesis of common unit root.Im-Pesaran-Shin (2003) with W-statistic, ADF (Dickey and Fuller,1979,1981) Fisher and PP Fisher with Chi-square statistics are testing the null hypothesis of individual unit root against an alternative hypothesis of some cross-sections without unit root. Finally, the null hypothesis of stationarity was tested usingHadri (2000) Z-statistic and heteroscedastic consistent Z-statistic. The results are presented inTable 3.
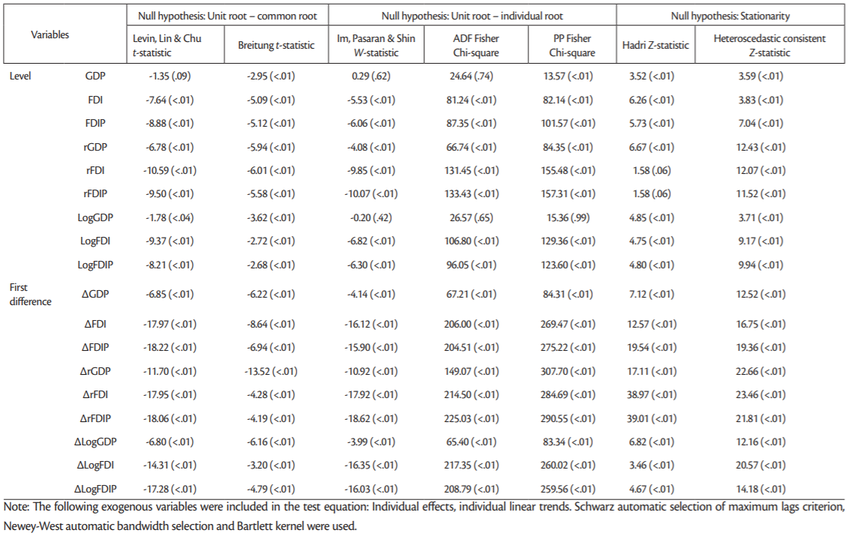
The problem with all the first generation panel unit root tests is that they assume cross-sectional independence. Therefore, the first generation panel unit root tests cannot be applied to panels where cross-sectional dependence cannot be excluded. Before using panel unit root test that can deal with cross-sectional dependence we highlight the cross-sectional dependence in our data. The null hypothesis is that there is no cross-section dependence. The results of all cross-sectional dependence tests are presented inTable 4.
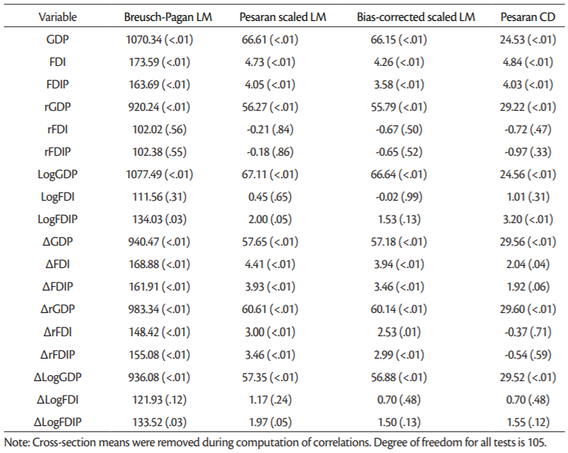
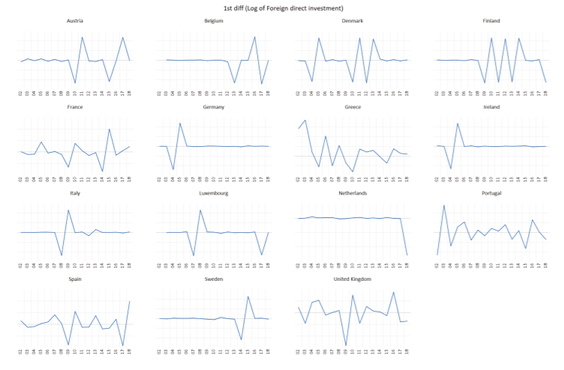
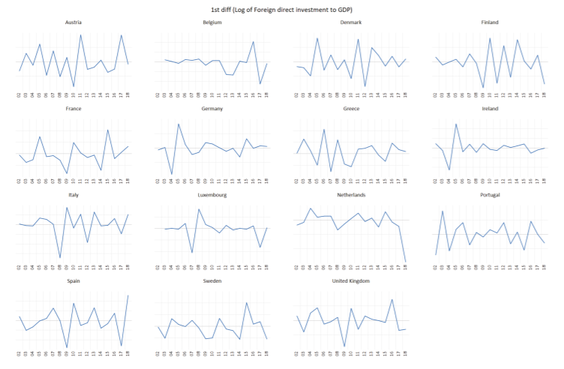
All the tests applied reject the null hypothesis of cross-sectional independence for level of three series (original series and logarithm transformed series) with one exception. Series LogFDI and ∆LogFDI and also some of the growth rates and the first difference series show no cross-sectional dependence. While for these series we can trust the outcome of the first generation panel unit root tests results, results of cross-sectional independence tests for other series recommend use of the second generation panel unit root tests.
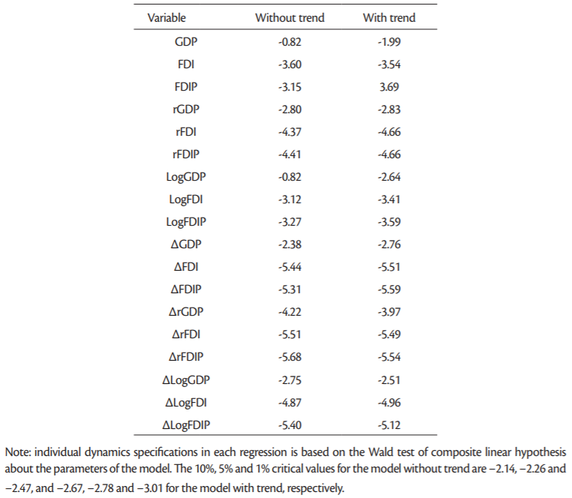
One of the tests that can deal with cross-sectional dependence is the Pesaran’s CIPS test (Pesaran, 2007). We have use Stata v. 15 to apply Pesaran’s CIPS test for unit roots in heterogeneous panels, i.e. in the presence of cross-section dependence. The null hypothesis is that all panels contain unit root, against the alternative hypothesis that some panels are stationary. Results of this tests are presented inTable 5.
Source: Author’s calculation
Pesaran CIPS test indicates for all but two series that the null hypothesis of unit root in all panels should be rejected at the 1% significance level. Two exceptions are series GDP and LogGDP for which the Pesaran CIPS test indicated unit root in all panels.
Finally, Levin, Lin & Chu and Breitung (2000,2002) tests reject the null hypothesis of common unit root for all series at all significance levels (Table 3). We reached the same conclusion when using Im-Pasaran-Shin, ADF Fisher and PP Fisher tests, with two exceptions. Namely for series GDP and LogGDP these tests suggested that null hypothesis of unit root with individual trend can’t be rejected. Contrary to the results of the above tests Hadri test and test based on heteroscedastic consistent Z-statistic reject for all series null hypothesis of stationarity. Possible reason why we are getting such mixed results could be that these tests have lower power in case of the structural break in time series, which is evident in case of GDP and LogGDP series.
Therefore, because of the strong cross-sectional dependence for some of the series, results of the Pesaran CPIS tests are more reliable than the results of the first generation panel unit root tests. In summary, we may say that all series both in level and the first difference are I(0), with GDP and LogGDP being the only exception. These two series are considered to be I(1).
3. 2 Panel cointegration test (ARDL model)
Since unit root tests result suggested that GDP/LogGDP and FDI/LogFDI series are of different order of integration (I(1) and I(0) respectively), for these series cointegration tests based on ARDL model will be used.
The panel ARDL technique was selected to investigate the long-term and short-term cointegration correlations between GDP and FDI and extract the error correction version of the panel characteristics to identify the short-term dynamic. The panel ARDL method was preferred over more traditional cointegration techniques, such as Johansen (1991) cointegration test, because it could be used with the studied factors regardless of whether they were I(0), I(1), or both I(0) and I(1). Using panel ARDL, both long-term and short-term coefficients are provided at once.
This approach is based on the use of the panel form of ARDL model proposed byPesaran and Shin (1999) andPesaran Shin and Smith (2001). The asymptotic features of these panels are different from the traditional panels’ assumptions, with homogeneous slope parameters across the groups. They developed the pooled mean group (PMG) estimator, where the PMG assumes the combination of both pooling and averaging of the coefficients. In this respect, therefore, the intercept and slope parameters, and the error correction variances may all differ across the groups. To assess impact of the optimal lag length criteria on the ARDL results we have used bothAkaike (1974) information criterion (AIC) andSchwarz (1978) information criterion (SIC). We have also estimated ARDL models for both original and logarithm transformation of the original series. Finally, ARDL models were estimated with two different trend specification: constant level and linear trend.
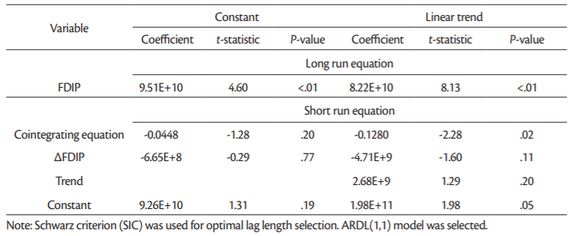
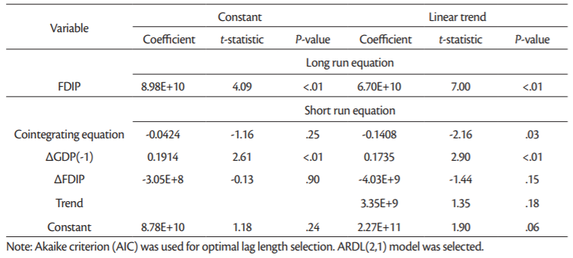
ARDL models based on logarithm transformation of the original series are preferred, for at least two reasons. First, most of the ARDL models estimated in literature are based on logarithm transformed series. Second, interpretation of the coefficients in such models is more intuitive. Coefficients in these models are elasticities, showing for how much will change the dependent variable for 1% change in independent variables. Therefore we are presenting all the results, but will comment only on those models with logarithm transformed series.
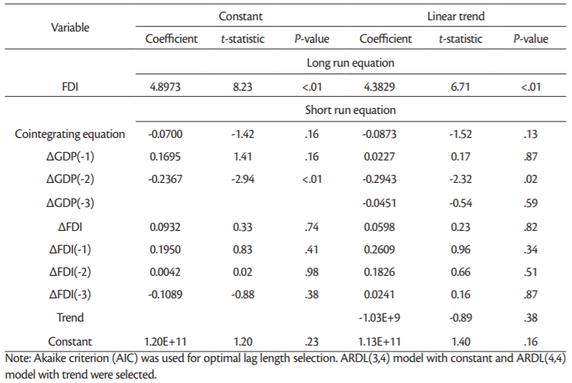
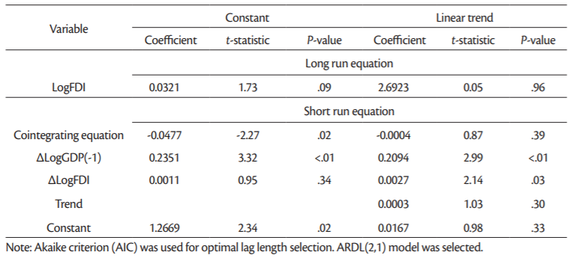
The coefficient of the error correction term (ECT) goes in line with the underlying convergence assumptions in order to validate the long-run equilibrium nature of the model. These include that the ECT be negative, significant, and less than one (Pesaran et al., 1999). We are commenting on the results of models based on Akaike information criterion presented in Tables11 and13. The reason is that the Schwarz information criterion tends to underestimate optimal lag length. For instance Akaike criterion suggested ARDL(3,1), while Schwarz criterion suggested ARDL(1,1) model. As a consequence of such underestimation there could be some residual autocorrelation. While Akaike information criterion tends to overestimate the optimal lag length, this has less serious consequence on the reliability of the estimated panel ARDL model.
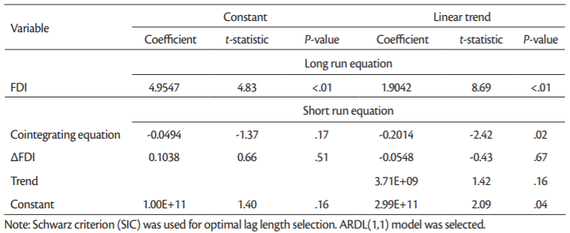
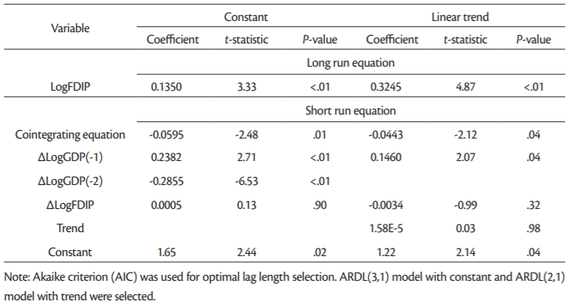
The cointegrating equations (model with trend: –0.0443 and model with constant: –0.0595) inTable 13 explain that the rate of adjustment back to (long-run) equilibrium is 4.43% (model with trend) and 5.95% (model with constant) which are significant at 4% and 1 % significance level respectively. In the short-run, only the coefficients of each of LogGDP(–1) and LogGDP(–2) are each significantly related to LogGDP, at less than 1% significance level.
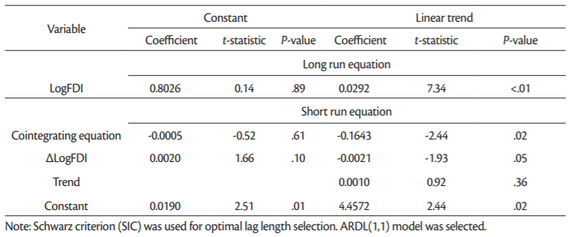
More mixed results are presented inTable 11 for LogFDI series. Here we have the cointegrating equation (model with constant: –0.0477) explains that the rate of adjustment back to (longrun) equilibrium is 4.77% which are significant at 2% significance level. However, the ECT in the model with trend is not statistically significant, though it is negative and less than one. In the short-run, only the coefficient of LogGDP(–1) is significantly related to LogGDP, at less than 1% significance level.
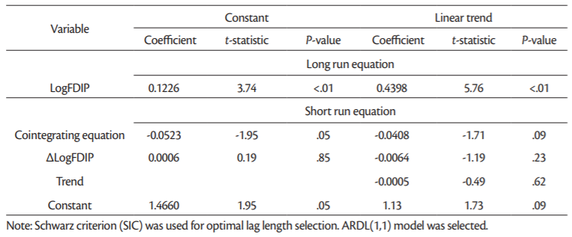
The panel ARDL is a long-run estimate of the equilibrium analysis, and therefore the long-run coefficients are usually given higher importance. The long-run coefficients are all positive, but not all of them are statistically significant. For instance the long-run coefficient for LogFDI (0.029) is statistically significant only in the model with trend (Table 9) but not in other models (Table 11). In case of LogFDIP series long-run coefficients are statistically significant in all four models in Tables12 and13, varying between 0.1226 and 0.4398. These coefficients indicate that 1% increase in LogFDIP (logarithm of FDI to GDP) increases LogGDP between 0.1226% and 0.4398%.
Therefore, the cointegration test based on panel ARDL (PMG) model confirm that there are long-term relationship between LogGDP, LogFDI and LogFDIP series in case of 15 “old” European Union countries for the period being investigated (2002-2018).
3. 3 Granger causality analysis
We tested whether there is a causal relationship among the variables using the panel Granger noncausality test developed byDumitrescu and Hurlin (2012). The null hypothesis is that variable X does not homogeneously cause variable Y, against the alternative hypothesis that X does Grangercause Y for at least one panel.Table 14 gives the results of this test.
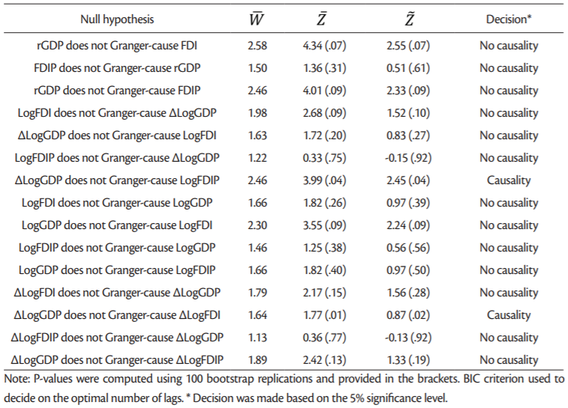
According toTable 14 there is no causal relationship between any two variables considered with only two exceptions. When investigated the causal relationship between GDP growth rate (∆LogGDP) and FDI growth rate (∆LogFDI) we can say that GDP growth rate cause FDI growth rate at least of 2% significance level, while FDI growth rate does not cause GDP growth rate. Thus, there is a unidirectional causal relationship between the GDP growth rate and FDI growth rate. Similarly, there is a unidirectional causal relationship between the GDP growth rate and LogFDI at 4% significance level.
Expectation is that if there is a cointegration between two series then they are also causally related. However, mixed results of cointegration test based on ARDL (PMG) model and the Dumitrescu-Hurlin panel causality test do not confirm this, which could be caused by lower power of these tests and weak relationship between series. Therefore we can say that there is only a weak evidence of the positive impact FDI has on GDP growth in the “old” European Union member countries.
4. CONCLUSION
The aim of this paper was to examine the relationship between FDI and economic growth in EU15 countries over the period 2002-2018. Based on the conducted analysis following conclusions can be drawn. Results of the Pesaran CIPS panel unit root test indicated that all series considered are stationary, i.e. I(0), with two exceptions. This test indicated that series GDP and LogGDP are with unit root, i.e. I(1). Since level of GDP series is I(1) and levels of FDI and FDIP are I(0) only the ARDL modelling approach to cointegration could be used, because this approach allows series to be different order of integration. Estimated panel ARDL (PMG) model found some evidence that there are long-run equilibrium between LogGDP, LogFDI and LogFDIP series. The rate of adjustment back to equilibrium is between 4.43% and 5.95%. The long-run coefficients are all positive, but not all of them are statistically significant. For instance the long-run coefficient for LogFDI (0.029) is statistically significant only in the model with trend, but not in other models. In case of LogFDIP series long-run coefficients are statistically significant in all four models, varying between 0.1226 and 0.4398. These coefficients indicate that 1% increase in LogFDIP (logarithm of FDI to GDP) increases LogGDP between 0.1226% and 0.4398%. Results of Dumitrescu-Hurlin panel causality test indicated that there is only unidirectional causal relationship from GDP growth rate to FDI growth rate, and from GDP growth rate to LogFDIP. There is no other causal relationship between any other two variables considered. Conclusively, there is only a weak evidence that FDI had statistically significant impact on the GDP in EU15 countries for the period being investigated. Despite its insights and accomplishments, this research has some limitations, for example number of variables which could have impact on FDI and GDP should be extended. Therefore, it is advised to include in future research other variables (for example, institutional quality, human capital, market size, unit labour costs, openness of the economy, etc.). There is also a need to extend the period of research and/or to use quarterly/monthly data if possible in order to increase the number of observations. Also, single-country studies are needed, due to the heterogeneous relationship between FDI and growth.