
INTRODUCTION
There is no doubt that new business creation is important for an economy. The business enterprise population for the 28 European Union countries in 2016 consisted of almost 27 million active enterprises, which employed about 150 million people. The share of newly born enterprises increased by 3,5 % in 2016 in comparison to 2015 and resulted in the total of 2,6 million enterprises births in 2016, which generated about 4,0 million jobs[1]. New business creation is considered as one of the main factors of innovation, economic productivity and job creation. Many empirical researches have confirmed the role that newly born enterprises have in stimulating the competitiveness and efficiency of other enterprises within a country.
Understanding the specific circumstances that affect the scale and the determinants of business demography is therefore very important for development of policies that enhance entrepreneurship and increase the level of employment – one of the main priorities of the European Union 2020 growth strategy[2]. The heterogeneity of birth and death of enterprises is context-dependent in nature. The business dynamics related policies and institutions may be a very important driving force for information and communication technology (ICT) related sectors especially since more significant cross-country differences in enterprise birth and death rates are present in younger than in mature ICT sectors3. According to the research conducted by4, which examined the impact of business policies and laws on birth rates of enterprises across countries, the policies which restrain large enterprises competitiveness also encourage more new enterprises births.
Measurement of the differences in entrepreneurial activities across countries in this research is based on enterprise level indicators. The application of the enterprise approach in measuring enterprises dynamics such as the birth and death of enterprises provides a high consistency in methods and definitions of business events across European countries. Enterprise birth rates can therefore be used as a measure of entrepreneurial activity.
Hence, based on the data on the total number of active enterprises and enterprises birth and death rates, the first aim of this article is to analyse the variations and changes in business statistics indicators, as well as the accompanying effects that these events have on the unemployment rate and gross domestic product per capita for 28 (for the year 2012) and 29 (for the year 2016) European countries. For that purpose, the methods of descriptive statistics were used. By applying the methods of hierarchical cluster analysis, the second aim of the is article to investigate the changes that occurred in these two years regarding the grouping of European countries with similar characteristics based on the relative business demography variables and the chosen macroeconomic indicators. That way, the main stakeholders of this research, which are governments of the observed countries and leading macroeconomists, can, based on the results presented in this article and selected macroeconomics variables, form new regulations and give additional instructions which could lead to an increased level of wellbeing in their countries.
This article is organized as follows. After a brief introduction, the second section of this article presents the review of the relevant literature. The data and methods are described in the third section. The analysis, along with the discussions, is presented in section four. The article ends with final conclusions summarized in section five.
LITERATURE REVIEW
BUSINESS DEMOGRAPHY AND JOB CREATION
Previous research on the impact of business demography activities on job creation considers the birth of new enterprises as one of the key factors of employment creation and productivity of an economy[5-9], and the death of enterprises as a crucial factor in the process of “creative destruction”[10].
Every year in most OECD countries about 20 % of enterprises enter and exit the market and within the first two years about 20-40 % of newly born enterprises exit and only about 50 % of the newly born enterprises are still active after 5 years[11]. Nevertheless, the birth of new enterprises is still the most important generator of employment growth[7]. The number of jobs created by newly born enterprises outnumbers the employment lost due to the death of enterprises in all size classes[7]. According to[9] in the EU context, smaller enterprises contribute more to employment creation than larger enterprises do.
BUSINESS DEMOGRAPHY AND UNEMPLOYMENT
Business demography indicators are sensitive to changes in macroeconomic environment. Previous research regarding the relationship between unemployment and the birth of enterprises proves a significant relationship between these variables[12-15]. However, the empirical research often shows contradictory results regarding the direction of the relationship between unemployment and the birth of enterprises. A negative relationship would be expected: an increase in unemployment should be followed by a decrease in the number of new enterprises. According to[12] unemployment is mainly negatively related to birth and death rates in Italy, but this relationship is also sector dependent. An update of that study conducted by[13] revealed that a positive impact of unemployment on the net birth rate is due to a negative impact of unemployment on the firm death rate. For European countries,[16] found a significant positive correlation between the death rate of enterprises and the unemployment rate and a significant negative relationship for the unemployment rate and the difference between the birth and the death rate of enterprises (enterprise dynamics). The authors in[17] found a negative relationship between the number of newly born enterprises and unemployment for the EU countries.
The research performed by[14] empirically confirmed the existence of two different relationships between unemployment and self-employment for the OECD countries: the “entrepreneurial” effect whereby higher rates of self-employment may lead to a rise of entrepreneurial activity and a reduction of unemployment was found to be much stronger than the “refugee” effect of start-ups whereby high unemployment rates may be responsible for start-up activity of self-employed people. In a more recent study a positive and statistically significant relationship between self-employment and unemployment was found for more than 50 per cent of the European OECD countries, but the presence of a negative or statistically insignificant relationship was also reported[15].
The use of different indicators and/or application on different units of analysis (different industries, different countries, regions, different cross-country context or different time) may be the reason for these mixed research results on the relationship between unemployment and the birth and death of enterprises.
ENTREPRENEURSHIP AND ECONOMIC DEVELOPMENT
There is no doubt that entrepreneurial activities and economic development are closely related. The studies on the relationship between entrepreneurship and economic development (measured as GDP per capita) are generally also controversial. It has been found that the GDP growth rate has an impact on start-up rates[18,19] and the authors[17] explored the relationship between GDP growth and the absolute number of newly-born enterprises for the EU countries by applying a random-effects negative binomial regression model and they found that the number of newly-born enterprises is positively related to GDP growth. If income is measured as GDP per capita, the impact on entrepreneurship could be negative[20] as well as positive[6, 8] and some authors suggest a U-shaped relationship for GDP per capita and entrepreneurship[5,21]. The level of economic development fosters new-firm formation[22] and it is after the countries reach a certain level of income that a higher GDP per capita is related to higher start-up rates[6].
CLUSTER ANALYSIS IN ENTREPRENEURSHIP
Cluster analysis is a widely used multivariate method for data analysis in which data are grouped into different clusters based on a set of variables, in the way that similar objects are placed in the same cluster. Many researchers in the area of business enterprises also use this method.
For instance, the author[23] explored the differences in ICT adoption among enterprises in different groups of European countries (innovation leaders and followers, moderate and modest innovators). Authors[24] used a cluster analysis in order to confirm their results of the discriminant analysis carried out for the purpose of examination of the differences between applied funding policies in wine industry enterprises in France and Hungary.
One of the examples of previous research that uses the methods of cluster analysis in entrepreneurship and business demography is the research conducted by[25] on the role that national culture plays as an explanatory variable alongside entrepreneurial variables for the level of economic development. According to this research, national culture reinforces the impact of entrepreneurship on economic development: the used variables explain over 60 % of the variance in the linear regression model for GDP per capita. By applying the cluster analysis for the European Union countries the same author[25] found four entrepreneurial clusters, each characterized by a different entrepreneurial dynamics explained to some extent by cultural value variables and income as measured by GDP per capita. By performing a cluster analysis on variables connected to economic development, institutions and entrepreneurship for the European Union countries the authors[26] examined the entrepreneurial performance of transition economies with a focus on productive entrepreneurship. In the study conducted by[27] five entrepreneurial types of European countries were distinguished by using principal component analysis and hierarchical cluster analysis on variables related to entrepreneurial activity and economic development. Their research showed that the diversity in entrepreneurial activities can be explained and discriminated by five explanatory themes on innovation, employment, formal institutions, entrepreneurship and governance.
Our research takes an approach in line with previous research[27] but explores exclusively the business demography activity indicators, the death and birth rates of enterprises as classifying variables for the cluster analysis along with the economic environment indicators – GDP per capita and the unemployment rate[28]. We believe that our research contributes to the existing empirical literature by using the most recent data set on business demography indicators for selected European countries from 2016 and by presenting a comparison of the results for this data set with older data from 2012.
DATA AND METHODS
In the article, a focus is given to three selected business demography variables, listed with their brief descriptions in Table 1. The values of business demography variables have been observed for the total number of enterprises excluding holding companies. In addition, to set those business demography variables into the context, two macroeconomic variables related to the business demography are included in the analysis as well.
In order to collect the data for the selected variables, Eurostat and the World Bank databases have been used[29-31]. The data from 2012 and 2016 are going to be observed in the analysis. The analysis is going to be conducted using the sample of European countries for which data were available. Consequently, the following 29 European countries have been included in the analysis: Austria. Belgium, Bulgaria, Croatia, Czechia, Denmark, Estonia, Finland, France, Germany, Greece, Hungary, Iceland, Ireland, Italy, Latvia, Lithuania, Luxembourg, Malta, the Netherlands, North Macedonia, Norway, Portugal, Romania, Slovakia, Slovenia, Spain, Sweden and the United Kingdom. Out of the 29 observed countries, 26 are the European Union member states. Unfortunately, the data for Greece are missing in 2012 and therefore the count of the observed countries in 2012 is equal to 28.
The observed variables are going to be first analysed by using the descriptive statistics approach. Within the descriptive statistics analysis, variables are going to be plotted, descriptive statistics measures are going to be calculated and relations between the variables are going to be observed. In addition, the outlier analysis will be conducted to check whether there is a country (or more of them) that has values of the observed variables significantly lower or higher in comparison to other observed countries.
A hierarchical cluster analysis will be performed to detect groups of countries with similar characteristics according to the observed variables. Overall two hierarchical cluster analyses will be conducted. The first one will include data from 2012 and the second one will use data from 2016. In order to get sensible results, standardized values of relative business demography measures, BirthRate and DeathRate, are going to be considered. In both hierarchical cluster analyses, both observed macroeconomic variables will be included as well.
ANALYSIS AND DISCUSSION
DESCRIPTIVE STATISTICS ANALYSIS
The observed European countries differ in both their land and their population sizes. Consequently, it is expected that the number of active enterprises is quite different among the observed countries. Therefore, the number of active enterprises in the observed countries in 2012 and in 2016 is shown in Figures 1 and 2, respectively.
Figures 1 and 2 confirmed that there are large differences in the number of active enterprises among the observed European countries. Five countries stand out: Italy, France, Spain, Germany and the United Kingdom. Those five countries have convincingly the largest number of active enterprises among all the observed countries. On average the observed countries
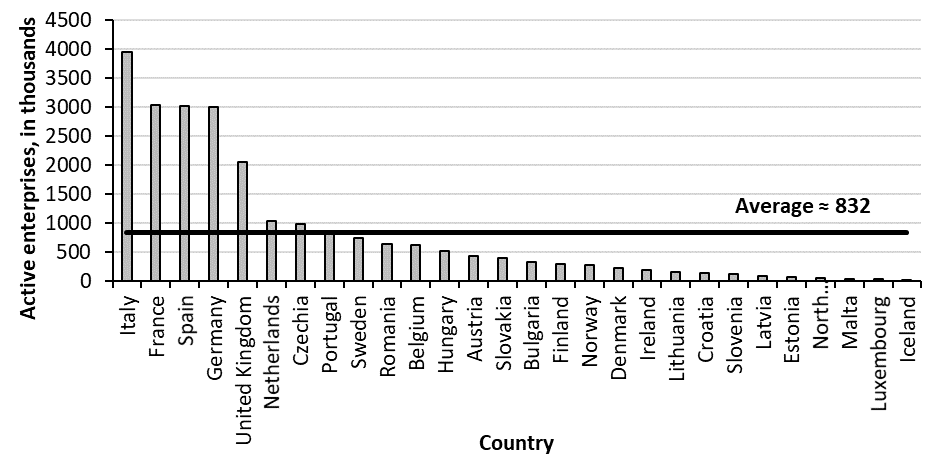

had about 832 thousands of active enterprises in 2012 and about 872 thousands in 2016. Along with the five mentioned countries, the Netherlands and Czechia are the only countries which have the number of active enterprises above the average value in both observed years. All other countries have the number of active enterprises below the average. Such relations suggest that a researcher should be careful when the business demography is observed by taking only absolute values into account. The absolute indicators of the total enterprises births (or deaths) are also less comparable across countries if they are based on different definitions of enterprises. The data on business demography variables used for analysis in this article are already highly consistent in methods and definitions of business events across European countries, but comparability can be additionally improved by using relative business demography indicators (enterprise birth or death rates) since biases (if they exist in the absolute values) are then present in both the numerator and the denominator[32]. Therefore, in the article the focus will be given to relative variables BirthRate and DeathRate whereas, for the purpose of comparison of different countries only descriptive statistics results of the variable ActiveEnterprises will be shown.
Table 2 shows main descriptive statistics results of the observed variables in 2012 and in 2016. According to the coefficient of variation values it can be concluded that at the absolute business demography variable ActiveEnterprises a much larger variation level is present than at relative business demography variables BirthRate and DeathRate. The descriptive statistics results also show a moderately high variability of variables related to business demography activities (BirthRate and DeathRate) as well as to the indicator of economic development (GDPCapita) and a relatively high variability in UnempRate in both observed years. Hence, these results indicate a relatively high heterogeneity between the European countries, which did not change much in 2016 in comparison to 2012. However, the observation of the average values of variables reveals that the total number of active enterprises increased in 2016 in comparison to 2012. The birth rate of enterprises in 2016 had almost the same average value as in 2012, but the average death rate in 2016 was lower than in 2012 (with only a little higher dispersion of death rates in 2016 than in 2012). The average GDP per capita was higher in 2016 than in 2012 with about the same variation in both years and the average unemployment rate in 2016 was lower than the average unemployment rate in 2012 with only a slight increase in variation of unemployment rates among European countries in 2016. The range of variation in unemployment rates for the middle 50 % of European countries was much larger in 2012 (interquartile range 6,84) than in 2016 (interquartile range 3,77) which may indicate that the situation regarding unemployment in European countries was much better in 2016 than in 2012. Finally, these results may indicate an overall positive economic and business demography change that occurred among European countries in 2016 relative to 2012.
Table 3 presents the list of the top three and the last three countries according to the value of each observed variable. In both years Lithuania recorded the highest birth rates of enterprises, but its birth rate decreased in 2016 compared to 2012. It is interesting to notice that Malta, which was among the three countries with the lowest birth rate in 2012 moved to the list of the three countries with the highest birth rate in 2016, while being among the three countries with the lowest death rate in 2016. Among countries with the highest levels of GDP per capita,
*values of the variables are shown in brackets
in 2016 Ireland replaced the Netherlands which was in the third place in 2012. The list of the last three countries according to the GDP per capita level remained the same but their GDP per capita values were higher in 2016 than in 2012. The list of countries with the highest levels of unemployment rates was led by North Macedonia in both years, but its unemployment rate decreased in 2016 compared to 2012. The range of variation in unemployment rates was 28,9 in 2012, but only 20,74 in 2016.
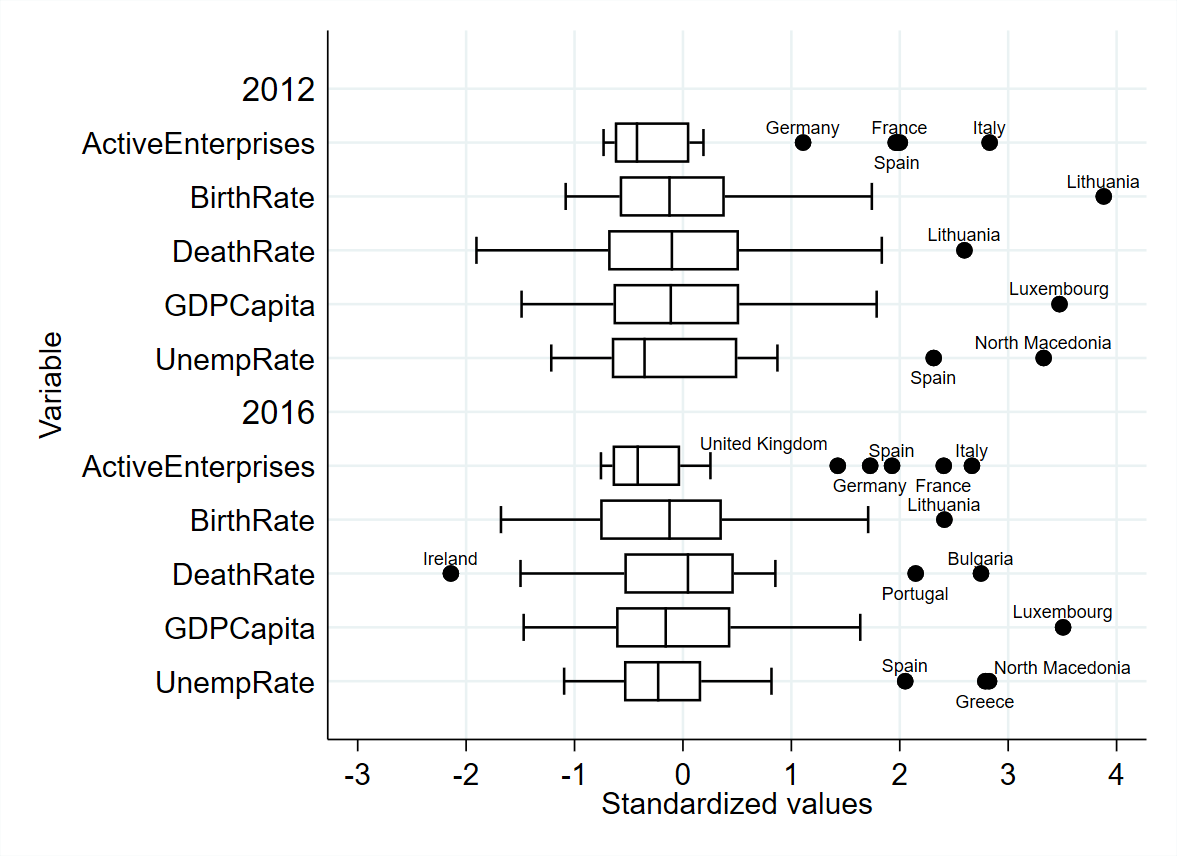
In order to check whether there are some countries that have significantly higher or lower variable values than the other countries, all variables are first standardized. After that those standardized variables are plotted by using box plots. In this case the width of the “box” in the box plots is defined by the values of the 1st and the 3rd quartiles whereas the whiskers range is defined by the last actual data point which can be found in the 1,5 interquartile range from those two quartiles. All other data points, which turned out to be outside that range, are considered to be potential outliers. The box plots of all the observed variables are shown in Figure 3.
According to Figure 3 there are many data points that could be considered as potential outliers. In addition, there are some countries (Lithuania, Luxembourg and North Macedonia) whose values for some variables deviate from the averages more than three standard deviations. However, the outlier problem seems to be improved in 2016 since only Luxembourg remained a potential outlier in that year. Hence, in order to be able to compare the situation in the observed periods it has been decided that no countries will be omitted Table 4 shows the matrix of Pearson’s correlation coefficient values among the observed variables in 2012 and in 2016. It turned out that a statistically significant positive correlation between variables BirthRate and DeathRate was present in 2012, meaning that the European
*statistically significant correlations at the significance level 0,05
countries that had higher birth rates of enterprises also had higher death rates at that time. However, in 2016 this relationship between birth and death rates for European countries is no longer evident, since the coefficient of correlation for these variables is statistically insignificant. The variable DeathRate had a statistically significant negative correlation with the variable GDPCapita and a positive correlation with the variable UnempRate in 2012, meaning that the European countries with higher death rates also had lower GDP per capita levels and higher unemployment rates. However, the variable DeathRate had a statistically significant negative correlation only with the variable GDPCapita in 2016, but not with the variable UnempRate, which may also be seen as an indicator of change in determination of unemployment through the death rate of enterprises in 2016. In both observed periods a statistically significant negative correlation was present between variables GDPCapita and UnempRate.
HIERARCHICAL CLUSTER ANALYSIS
In the hierarchical cluster analysis Ward’s clustering method will be applied. As a distance measure, the squared Euclidean distances will be used. Two hierarchical cluster analyses will be conducted. The first one by using data for 28 European countries (without Greece) from 2012, and the second one based on data for 29 European countries (with Greece) from 2016. In both cluster analyses standardized values of variables BirthRate, DeathRate, GDPCapita and UnempRate will be used to form clusters or groups of countries with similar characteristics according to the observed variables. In order to select the most appropriate or optimal number of clusters the Calinski and Harabasz pseudo-F index[33] and the Duda-Hart 01) Je(2)/Je(1) index F[34] have been consulted. High values of the Calinski and Harabasz pseudo-F index and the Duda-Hart Je(2)/Je(1) index F indicate distinct clustering. Along with the Duda-Hart Je(2)/Je(1) index F, the associated pseudo T-squared measures can be found as well. A lower pseudo T-squared indicates distinct clustering.
Figure 4 shows the dendrogram for the cluster analysis based on data from 2012, whereas Table 5 presents the results of the Calinski and Harabasz pseudo-F index and the Duda-Hart Je(2)/Je(1) index F, with the associated pseudo T-squared values, related to that cluster analysis. The Calinski and Harabasz pseudo-F index values are steadily increasing from the solution with 4 clusters to the solution with 8 clusters, where the maximum value is achieved. Consequently, the Calinski and Harabasz pseudo-F index pointed out that the solution with 8 clusters should be taken as the optimal solution. However, the value of the Duda-Hart Je(2)/Je(1) index F is significantly lower when using the solution with 8 clusters than using the solution with 7 clusters. Similarly, the solution with 7 clusters has a considerably lower pseudo T-squared value than the solution with 8 clusters. Because of that it has been decided that the optimal number of clusters in the cluster analysis of data from 2012 is equal to 7.
Table 6 shows the list of countries according to their cluster membership in the first cluster analysis using data from 2012 whereas Table 7 presents the average values of variables included in the cluster analysis separately for each cluster. According to Table 7 the countries from the cluster A5 have the lowest average BirthRate whereas the countries from the cluster A3 have the lowest average DeathRate. On the other hand, Lithuania which is set to be in the cluster A7 has the highest BirthRate and DeathRate value. North Macedonia, which is the only one in the cluster A6, has among the highest values of variables BirthRate and DeathRate but it has the lowest GDPCapita and the highest UnempRate.
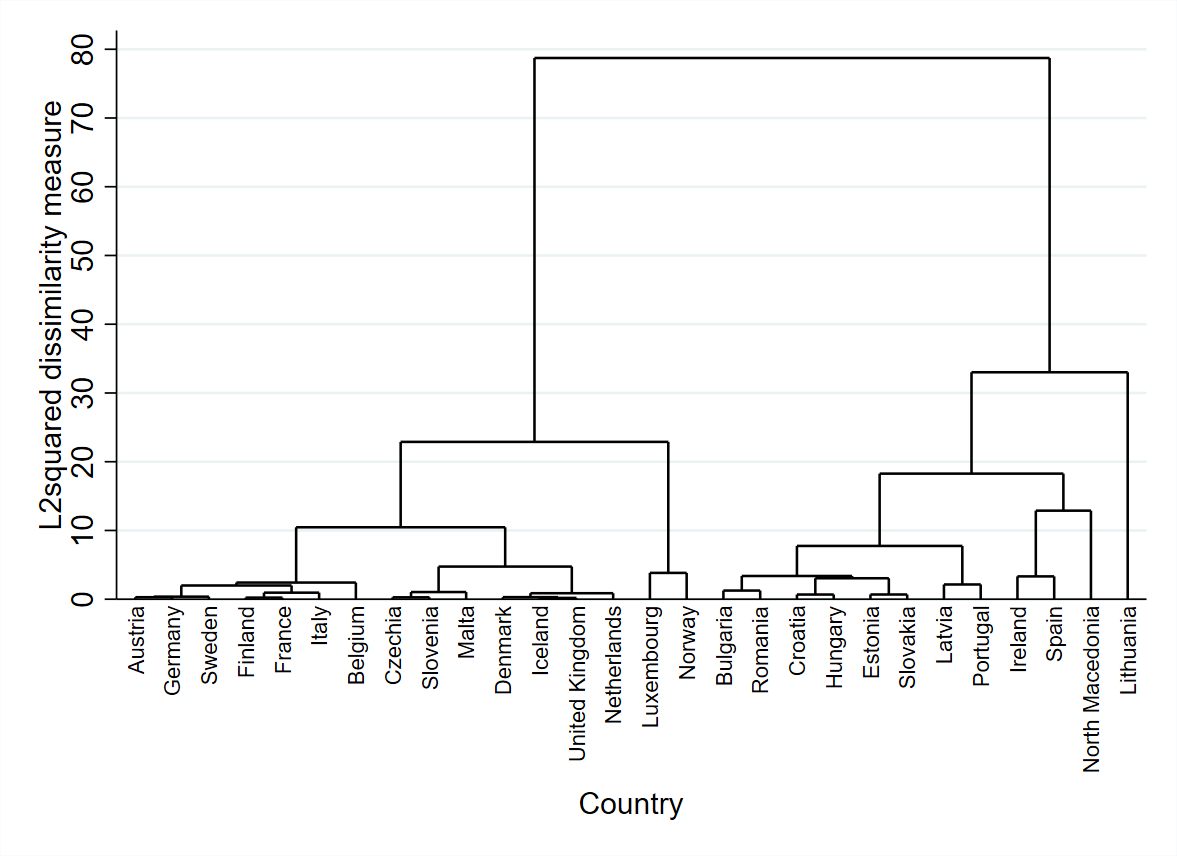
Figure 5 presents the dendrogram for the second cluster analysis, which is based on data from 2016. The values of the Calinski and Harabasz pseudo-F index, given in Table 8, suggest that it would be better to choose a higher number of clusters due to a steady increase of the index. ccording to that, the Duda-Hart Je(2)/Je(1) index F suggests choosing between the solution with 7 and 8 clusters (the highest, but very similar, values in the upper part of the table). Due to the fact that the solution with 8 clusters has a higher pseudo T-squared value, it has been decided that the optimal number of clusters is equal to 7.
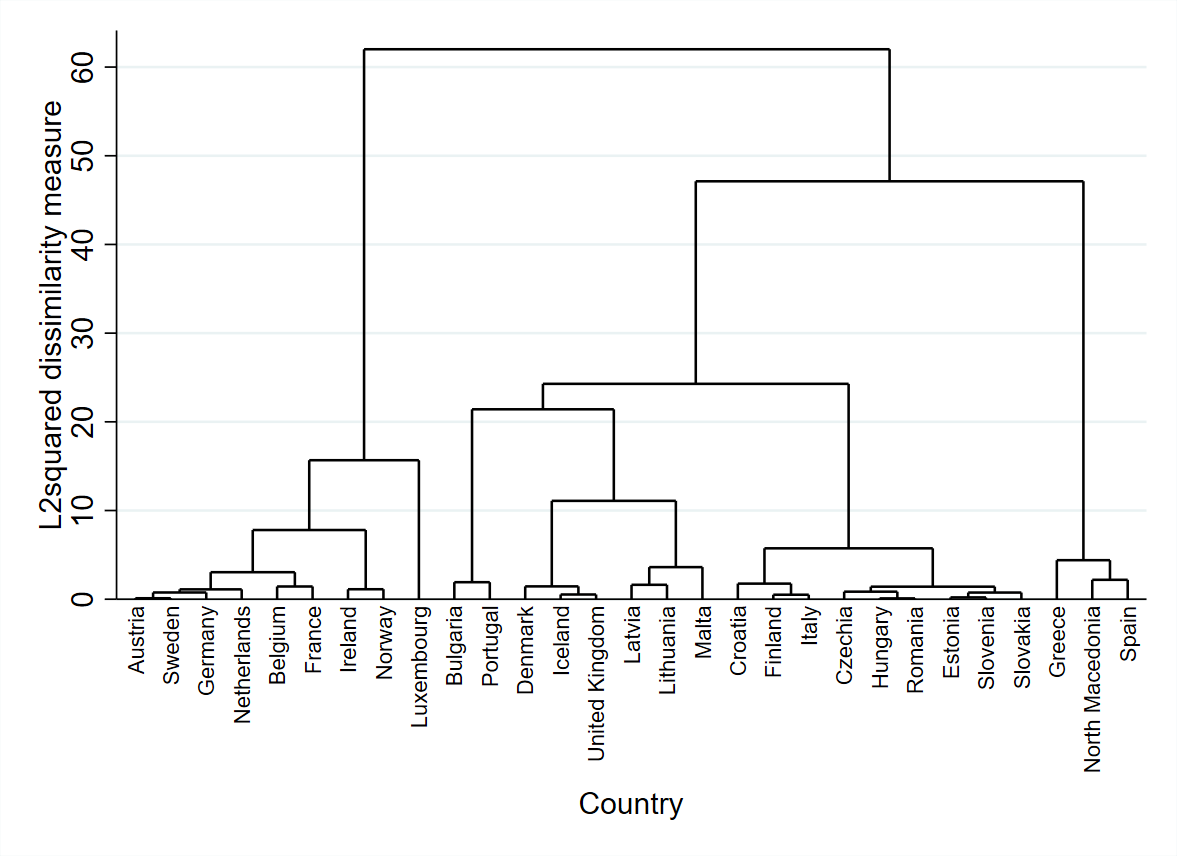
Table 9 contains the list of countries according to their cluster membership in the cluster analysis based on data from 2016 whereas Table 10 presents average values of variables included in the cluster analysis for each cluster separately.
According to Table 10, countries from the cluster B1 on average have the lowest birth and death rate of enterprises. On the other hand, the countries from the cluster B5 on average have the highest birth rates of enterprises whereas the countries from the cluster B3 on average have the highest death rates of enterprises.
DISCUSSION
Theoretical implications
The descriptive analysis results indicate that a very high variation level is present at the absolute indicator of business demography (ActiveEnterprises) and that the variation level in relative business demography indicators (BirthRate and DeathRate) is much lower but still moderately high. The results also show a relatively high variability of macroeconomic indicators (GDPCapita and UnempRate) in both observed years. High variability in economic and business demography indicators suggests the existence of different patterns in these variables among the European countries. However, even though a relatively high heterogeneity of European countries did not change much between these two years, in 2016 the average value of death rates was lower, the average GDP per capita was higher and the average unemployment rate was lower than in 2012, and only the enterprise birth rates had almost the same average value as in 2012. Thus, these results indicate an overall positive economic and business demography change that occurred among European countries in 2016 relative to 2012.
The analysis of the relationships between the variables revealed that the European countries on a lower level of development (measured as GDP per capita) also tend to have higher death rates of enterprises and higher unemployment rates, and that this statistically significant correlation was present in both years. Though, the correlation analysis also revealed that a statistically significant and highly positive relationship between birth and death rates of enterprises found in 2012 was absent in 2016. The existence of a statistically significant and positive correlation between birth and death rates of enterprises would be expected, since this describes the process of creative destruction, through which dynamic and innovative new enterprises drive inefficient ones out of the market[10]. The same change in statistical significance of the correlation was found between death rates of enterprises and the unemployment rate, which was significantly positive in 2012, but insignificant in 2016. These results suggest that the underlying mechanisms of the correlation between birth and death rates of enterprises and between death rates of enterprises and unemployment rates have changed.
The expected significant relationship between unemployment and birth of enterprises[12-15, 17] was not confirmed in our results in either year. In accordance with the research conducted by[16], we found a significant positive correlation between the death rate of enterprises and the unemployment rate, but only in 2012. The insignificant linear correlation between the birth rate of enterprises and the level of economic development (as measured by the GDP per capita level) was expected, since the previous researches[5, 6, 21, 22] report on the more complex functional form of the relationship between these variables, which reflects the findings that it is only after a country reaches a certain level of development (income) that a positive relationship between income and start-up rates is found.
The hierarchical cluster analysis based on four classifying variables: business demography activity indicators – the birth and the death rate of enterprises, and macroeconomic indicators – GDP per capita and the unemployment rate resulted in 7 clusters of European countries each described by its own combination of characteristics related to the used variables in both observed year.
Practical implications
The comparison of cluster solutions reveals that clusters A1 and A3 in 2012 and clusters B1 and B2 in 2016 gather countries on a high or a relatively high level of development in terms of GDP per capita, which also have a low or a relatively low unemployment rate and whose main business demography features are a low or a relatively low birth and death rate of enterprises. Similar characteristics of macroeconomic indicators were found in clusters A2 and B4: these were also countries on a high or a relatively high level of development, but these countries had high or relatively high birth and death rates of enterprises. The cluster A5 gathered countries similar according to a relatively high level of development, a low or a relatively low birth and death rate on average, but a very high unemployment rate. This combination of business demography and macroeconomic features was not found in any of the clusters in 2016.
The clusters that gathered countries on a low or a very low level of development with also a relatively high or a very high unemployment rate are A4, A6 and A7 in 2012 and clusters B3 and B7 in 2016. Among these clusters, A4 and B3 have high birth and death rates, the cluster B7 has a relatively low birth rate but a relatively high death rate, the cluster A6 has the lowest GDP per capita and the highest unemployment rate among all the clusters, the cluster A7 has the highest birth and death rates of enterprises and the cluster B7 has a relatively low birth rate but a relatively high death rate with the highest unemployment rate among all the clusters in 2016.
Countries that are joined in the clusters B5 and B6 share a moderately low level of development. However, the cluster B5 has a relatively low death rate and unemployment rate and the highest birth rate among all the clusters in 2016, while the cluster B6 has a relatively low birth rate of enterprises but a relatively high death rate and unemployment rate.
By comparing the resulting clusters for 2012 and 2016 with similar main characteristics we observe some interesting country-specific movements between clusters. Since the main features of clusters A1 and B1 are a low birth and death rate of enterprises, high GDP per capita and a relatively low unemployment rate, it is interesting to notice that some countries with these characteristics that were present in the cluster A1 are no longer present in the cluster B1 in 2016. Namely, Finland and Italy, formerly in A1 in 2012 were found in the cluster B6 in 2016, which is characterized by a still relatively low birth rate but a moderately high death rate of enterprises, a relatively low level of economic development (as measured by GDP per capita) on average and a moderately high unemployment rate on average that is still lower than the overall sample unemployment rate average for 2016. For Finland and Italy this shift from a cluster with more desirable characteristics in 2012 to a cluster with significantly less desirable characteristics in 2016 could mean a stagnation or even deterioration of business demography activities and macroeconomic performance.
A similar conclusion could be derived for Czechia and Slovenia, both members of the cluster B6 in 2016, since these countries were members of the cluster A2 in 2012, which is characterized by a moderately high birth rate, a moderately high death rate, a relatively high GDP per capita but a relatively low unemployment rate.
For the Netherlands, joining the cluster B1 in 2016 could be seen as an improvement in the observed variables since in 2012 this country was the member of the cluster A2. An improvement is also evident for Ireland which is found in the cluster B1 in 2016 since in 2012 it was a member of the cluster A5 characterized by a low birth rate, a relatively low death rate, a relatively high GDP per capita but a high unemployment rate.
For Lithuania, which was a potential outlier in 2012 since it grouped alone that year in the cluster A7 with the highest birth and death rate of enterprises, a relatively high unemployment rate and a low GDP per capita, joining the cluster B5 in 2016 could be seen as a positive movement. Countries in the cluster B5 still have the highest birth rate and on average a relatively low GDP per capita in 2016, but also have a low death rate of enterprises and a relatively low unemployment rate. Grouping in the cluster B5 can be seen as a positive movement between clusters for Malta (even though this country groups with significantly less developed countries in 2016) since Malta was in the cluster A2 in 2012.
Bulgaria and Portugal were found in cluster A4 in 2012, characterised by a high birth and death rate of enterprises, a relatively high unemployment rate and a low GDP per capita. In 2016 these two countries formed the cluster B3 whose main features are the highest death rate of enterprises and the lowest GDP per capita on average among all the clusters in 2016 and also a high birth rate of enterprises and a relatively high unemployment rate. For Bulgaria and Portugal this separation from other countries could mean a lack of adequate mechanisms for correction of undesirable characteristics related to the observed variables.
North Macedonia formed a 1-unit cluster A6 in 2012 and was a potential outlier that year since it had a relatively high birth and death rate of enterprises followed by the lowest GDP per capita and the highest unemployment rate. However, in 2016 North Macedonia clustered with Spain and Greece in the cluster B7, characterized by a relatively low birth rate but still a relatively high death rate, low GDP per capita and the highest unemployment rate on average among all the clusters in 2016. Hence, the fact that North Macedonia lost the status of an outlier in 2016 could be seen as an improvement in the observed indicators of business demography activities and economic development. On the other side, for Spain, a shift from the cluster A5 to the cluster B7 could point to some issues regarding the death of enterprises. Finally, even though Luxembourg was a potential outlier in 2012, this country was grouped with Norway in the cluster A3 that year, but in 2016 Luxemburg confirmed its outlier status by excluding itself from all other countries with far the highest GDP per capita level.
CONCLUSIONS
In this study the descriptive statistics methods and the hierarchical cluster analysis approach were used to explore the features of European countries regarding the business demography activities based on the data on the total number of active enterprises, enterprises birth rates and enterprises death rates and regarding the chosen macroeconomic indicators based on the level of economic development (measured as GDP per capita) and the unemployment rate. This research uses the data for 28 European countries in 2012 and for 29 European countries (the same 28 countries as in 2012 plus Greece) in 2016. Our results indicate a presence of a relatively high heterogeneity of countries in both observed periods relative to business demography indicators and macroeconomic indicators. However, by observing a lower average value of death rates and a higher average value of birth rates of enterprises alongside with a higher average value of GDP per capita and a lower value of unemployment rate, it is concluded that a positive economic and demographic change occurred in 2016 relative to 2012. The correlation analysis shows that the significance of the relationship between business demography activities and economic development indicators in 2012 changed in 2016: the death rate of enterprises had a statistically significant negative correlation with GDP per capita in both years and a significant positive correlation with the unemployment rate and with the birth rate of enterprises only in 2012. The hierarchical cluster analysis based on Ward’s clustering approach and the squared Euclidean distances resulted in 7 distinct groups of countries in both years with respect to their enterprise birth rate, enterprise death rate, GDP per capita level and unemployment rate.
Previous research applying cluster analysis in this area mainly focused on the classification of groups of countries due to one or more measures of entrepreneurship such as the birth of new enterprises (number or rate), Global Entrepreneurship Monitor’s TEA Index, Global Entrepreneurship and Development Index [25, 26] and others. In line with a recent research conducted by[27], our research excludes other measures of entrepreneurship but includes the death rate of enterprises in the cluster analysis in order to explore its capability to differentiate the groups of countries alongside the birth rate of enterprises and macroeconomic indicators.
All resulting clusters in 2012 and in 2016 are described in terms of low, relatively low or high, and high average values of demography statistics indicators and macroeconomic indicators. The country-specific situation regarding the movement between clusters the countries participated in 2012 to the ones they formed in 2016 is presented. For some countries this movement between clusters could be seen as a stagnation or deterioration of some or all of the observed business demography activities and/or macroeconomic performance. This is possibly the case for Finland and Italy (movement from A1 to B6), Czechia and Slovenia (from A2 to B6), Bulgaria and Portugal (from A4 to B3) and Spain (from A5 to B7). However, for some countries movement between clusters could be seen as an improvement in the observed indicators: for the Netherlands (from A2 to B1), Ireland (from A5 to B1), Malta (from A2 to B5), Lithuania (from being an outlier in A7 to B5) and North Macedonia (from being an outlier in A6 to B7). These results may have important practical implications for country-specific public policies aimed at (further) reduction of death of enterprises and unemployment.
Main limitations of this research are the lack of data on business demography indicators for Greece in 2012 (the data on these activities for Greece have been available only since 2015) and the outliers issue which was not treated deliberately in order to enable comparison of results for all the observed countries in 2012 and 2016. In future research the outlier problem should be resolved and the obtained results should be verified in accordance with the exclusion of outliers. Also, in future research the formal analysis of the differences across clusters in terms of the classifying variables should be performed and the main determinants that influence the movement of countries between clusters over time should be explored.