
INTRODUCTION
As aging societies become a worldwide issue, more attention has been paid to the sustainability of public finances. With the increasing proportion of elderly and decreasing birth and fertility rates, special pressure is created on the social security systems, and the pension systems, in particular. The challenges are even greater if the working-age population emigrates, which reduces the proportion of individuals paying social contributions. Consequently, economies are reforming their pension systems to make them more sustainable. The unsustainability of the system, with adverse demographic trends, further increases with the growth of basic pensions, conditioned on the choice of the indexation of pensions, and the provision of benefits to special groups of retirees. A large number of existing studies in the broader literature have examined the sustainability of pension systems, such as Pallares-Miralles, Romero, and Whitehouse[1], Marcinkiewicz, and Chybalski[2] Verbič and Špruk[3] and De la Fuente[4]. One of the most used indicators for the assessment of the sustainability of the public pension systems which are based on a pay-as-you-go (PAYG) social security scheme is public pension expenditure expressed as a share of GDP. Previous research has empirically assessed its main determinants, which can be classified into three categories: demographic, macroeconomic, and characteristics representing the design features of the public pension system, mostly determined by the government policies[3]. This study focuses on the pension systems of eleven economies usually grouped as the New Member States of the European Union (NMS): Bulgaria, Croatia, Czech Republic, Estonia, Latvia, Lithuania, Hungary, Poland, Romania, Slovakia, and Slovenia, excluding Cyprus and Malta. In response to many of the challenges of public pension systems: population aging, growing public debts, financial crisis, and many others, NMS has been reforming their pension systems. Therefore, our research question focuses on clustering these eleven newest member states of the European Union according to three perspectives of the pension system analysis: characteristics of the pension system, demography, and the third category points out to macroeconomics and the labor market. Cluster analysis is employed for the three selected years: 1996, 2006, and 2016. The idea of clustering economies in three years with a 10-year gap seemed particularly interesting since it reveals how the cluster structure is changing over time. Additionally, they represent three different phases in the pension systems’ development: 1996 represents the phase before the multi-pillar introduction, 2006 the period of economic boom, after pension privatization, and 2016 the most recent year, characterized by adverse demographic trends and rising pension expenditure. Moreover, the cross-section of the cluster in a particular year reveals which economies are better coping with the aging population, which of them have fewer problems with the sustainability of pension systems and better economic and labor market conditions. Such an approach is a novel in comparison to previous research, and it is the main contribution of this article. Many studies have attempted to rank and classify pension systems, but the research of pension systems is mostly concerned with OECD countries, due to data availability, and often only theoretical. The findings of this expanded study[5] provide guidelines for future pension reforms because they show which countries’ experiences and challenges could be valuable in defining certain policy measures. The rest of the article is structured as follows. Section 2 presents previous research. Section 3 describes the selection of variables and the model. Section 4 presents our findings and comments on the limitations of this research. Section 5 concludes.
PREVIOUS RESEARCH
The similarity of pension systems is analyzed in empirical research and professional publications of world research institutions - institutes, banks, supervisory and regulatory bodies, national bodies, and so on[1]. Despite the conventional wisdom to use the World Bank’s “three-pillar” classification, many institutions offer their classification[1][6]. For example, OECD has developed a taxonomy that avoids the concept of pillars altogether. It offers, instead, a global classification for pension plans, pension funds, and pension entities that is descriptive and consistent over a range of economies with different retirement-income systems[7]. OECD collects and analyses data on major insurance and pensions’ statistics. This allows cross-country comparisons and provides a valuable tool for measuring and monitoring the insurance and pensions industries. Social protection makes a focus area for the World Bank which publishes many studies on pension systems, as well as being involved in pension reforms of almost a hundred countries and providing them financial support for reforms. In the European Union, a method of soft governance in socioeconomic policies called The Open Method of Coordination (OMC) is established between the member states[6]. Three main objectives that should be realized by pension systems in the long term include the adequacy of pensions, financial sustainability, and modernization of pension systems. Its indicator portfolio, made available by Eurostat, is structured along with these objectives and it provides a basis for many empirical studies[6]. Much of the empirical research on pension systems are concerned with their classification and differences. The majority of the relevant literature investigates the typology of pension regimes, both empirical and theoretical work[8][9][10]. Esping-Andersen analyzed the relationship between public and private pensions, distinguishing three pension regime types: a corporatist state-dominant insurance system, a residualist, and a universalistic state-dominated system in 1990[8]. This classification largely corresponds to his general typology of welfare regimes. Lately, Esping-Andersen’s typology has been debated widely, with many studies replicating the analyses and making new classifications. Soede and Vrooman conducted an empirical study of the categorization of pension systems of the European Union economies, the United States, Australia, Canada, and Norway in 2008[9]. They compare the systems using thirty-four quantitative and qualitative characteristics of the mandatory parts of the pension systems. The authors conclude that Esping-Andersen’s categorization of welfare regimes is not entirely valid for pension systems. Kim and Lee suggest a classification of strategies of the developed countries for coping with aging societies and analyze the implications of the related causal variables in 2008[10]. Using two dimensions, employment- and income security, they classify countries into welfare-to-work types, welfare-emphasis type, labor-emphasis type, and market-emphasis type. The authors argued that the advanced strategy in dealing effectively with aging is placing equal emphasis on income and employment guarantees. Mikulec investigates the level of pension systems’ efficiency and classifies EU and EFTA countries in the years 2005-2007[11]. The author’s results indicate that countries of Central and Eastern Europe show similar pension systems’ efficiency. Aysan analyzes nineteen OECD economies to create a pension regime classification and to reveal the place of Turkey among these countries[12]. The findings of the cluster analysis prove that pension regimes can be classified into three broad clusters: Southern European, Continental European, and social-liberal. Marcinkiewicz and Chybalski introduce a new pension systems’ typology based on two main criteria: (1) the relation between state and market in the pension system, and (2) the share of voluntary and mandatory schemes using cluster analysis[13]. The results confirm the theoretical typology they proposed: the first regime is similar to the voluntary private regime, the second to the mandatory private regime, whereas the third to the mandatory public one. Marcinkiewicz classifies thirty OECD countries into three pension regimes using Kendall’s W concordance coefficient to measure intra-group similarity[14]. The author argues that the extent of the state’s involvement in the pension system and level of voluntariness are the basic dimensions for distinguishing social policy models concerning old-age pensions. Chybalski pays attention to four dimensions of the pension system efficiency, which refer to the GDP distribution, the pension adequacy, the labor market influence, and the administrative costs[15]. Based on Spearman’s rank correlation coefficient and cluster analysis he analyses twenty-eight European Union countries during the 2007-2011 period. His results showed that Norwegian and the Icelandic pension systems prove to be the most efficient in the observed group. Roman, Toma, and Tuchiluş use Chybalski’s approach to compare the efficiency of the pension systems in twenty-six member states of the European Union[16]. They use cluster analysis to group the countries by their pension systems’ efficiency. The results suggest that Hungary, Luxembourg, and Romania have the most efficient pension systems. In a cross-country study, Chybalski and Gumola investigate whether European pension systems have become more similar and convergent in the sense of the three main objectives of the Open Method of Coordination (OMC): adequacy, sustainability, and modernization of pensions[17]. Their sample consists of twenty-seven countries in the years 2005, 2010, and 2015. Using synthetic indicators and agglomerative hierarchical clustering, the authors conclude that the OMC is not an effective means of making European pension systems more convergent and better in terms of adequacy, efficiency, and modernization. The mentioned atricles have shown that a comparison of countries according to their different characteristics can be conducted in many different ways. However, the latest studies, like[17] and[18], have indicated that cluster analysis is one of the most appropriate statistical methods to do that. Also, it has been shown that this statistical method is generally well accepted in economic research[18]. This approach remains only briefly addressed in previous research. To fill this literature gap, this article clusters economies that are facing similar challenges of the unsustainability of pension systems, to lay the foundations for future comparisons and more detailed analyses of pension systems.
METHODOLOGY
RESEARCH INSTRUMENT AND DATA The focus of the article is on the similarity assessment of the pension systems of eleven new EU members: Bulgaria, Croatia, the Czech Republic, Estonia, Hungary, Latvia, Lithuania, Poland, Romania, Slovakia, and Slovenia. Next to similar demographic challenges, that is a declining share of the working-age population in the number of people aged over 65, or the old-age dependency ratio, the pension systems of the chosen economies are dominated by pay-as-you-go (PAYG) social security scheme[19]. In this kind of pension system organization, current workers pay contributions from which pensions are paid to current retirees[20]. This makes them sensitive to changes in demographic, macroeconomic, and institutional factors. Moreover, these New Member States of the European Union are all post-socialist economies, whose pension systems share poor design characteristics in the transition period. One of them is certainly encouraging early retirement, which was seen as a resolution to mass redundancies in the labor market due to the privatization of state-owned companies[21]. As a result, the ratio of retirees to workers, called the system dependency ratio, was rising. Consequently, the pension systems of the chosen new EU members have been going through the process of restructuring and establishment of the multi-pillar pension system. The introduction of new pillars into the pension system constitutes a systematic reform of the system. Most pension reforms are parametric, whose main objective is to maintain the trend of public pension expenditure to GDP within the European Union, and are called the “sustainability-enhancing” pension reforms[22]. Therefore, these kinds of reforms are gradual and include changing the parameters and rules of the pension system, such as statutory retirement age, pension indexation, and calculation, contribution rates, adjusting pension parameters to demographic trends, harmonization of the retirement age between men and women[22]. Following the above mentioned three perspectives of the public pension system of the New Members of the European Union, demographic, macroeconomic, and institutional, we were interested in identifying the group of economies, which are better coping with every of the mentioned aspect of the pension system. Therefore, our research question focuses on clustering eleven newest member states of the European Union from these three perspectives. Consequently, cluster analysis is employed. The cross-section of the cluster in a particular year reveals which economies have fewer problems with the sustainability of pension systems and demographics, and better economic and labor market conditions. Three years were selected: 1996, 2006, and 2016, which represent three different phases in the pension systems’ development. Additionally, the idea of clustering economies in three years with a 10-year gap seemed particularly interesting since it reveals how the cluster structure is changing over time. It remains to choose the group of variables that will reflect those perspectives. In this context, previous research was explored[3], supplemented by additional variables that were considered important for representing pension systems, macroeconomics, and demographics. Pension systems’ characteristics include average effective retirement age, pension expenditure as a share of GDP, and replacement rate. The average effective retirement age represents the average age of exit from the labor force for 5 years. Weights were obtained using data on the number of men and women aged 55-69, which is considered to be an early retirement “window” when all the countries are jointly observed. Replacement rate refers to the percentage of an employee’s pre-retirement monthly income that an employee receives after retiring. Due to limited data for 1996, the ratio of average pension to average wage served as a proxy for this variable[3]. Demographics encompass fertility rate, life expectancy at the age of 65, net migration rate, and old-age dependency ratio. Life expectancy at the age of 65 is the average number of years a person at that age is expected to live, assuming constant age-specific mortality levels. Here weights were calculated as a share of men and women of that age in each year, each country.
The net migration rate is obtained as the difference between the immigrants and emigrants during the year, expressed per 1,000 inhabitants. It is based on a mid-year population. Finally, the macroeconomics and labor market group refer to the GDP growth rate, real labor productivity, labor force participation rate, and the unemployment rate. These variables are listed in Table 1. Moreover, the table shows abbreviations for variable names and data sources.Therefore, data on all variables were collected from the sources listed in Table 1 for the selected three years: 1996, 2006, and 2016. However, data for some variables were missing for 1996. In such cases, the data for that variable was taken from 1997 or 1998 as approximation values for 1996[17]. In particular, labor force participation data for 1996 is not available for Bulgaria, Romania, and Croatia. So instead, the value for the same variable for 1997 (for Bulgaria and Romania) and 1998 for Croatia is used. STATISTICAL METHODS In the first step, the results of descriptive statistics for selected variables individually per year are given. This is followed by the results of the cluster analysis, as the statistical method that enables the identification of similar groups of statistical units. Those groups consist of homogeneous units but the units between different groups are heterogeneous[23]. Our choice of the cluster analysis is partially substantiated by previous literature, which has already shown that a comparison of countries according to their different characteristics can be conducted in many different ways. However, the latest studies, like[17] and[18], have indicated that cluster analysis is one of the most appropriate statistical methods to do that. Also, it has been shown that this statistical method is generally well accepted in economic research[18]. In the analysis, hierarchical cluster approach was used, which is usually combined with Ward’s method of clustering[24]. As a cluster distance measure, Euclidean distance is used, as is usually the case. For each group of variables and each year only two clusters of economies are considered in line with the dendrograms of hierarchical cluster analysis. Also, by presenting solutions with the same number of clusters for different years, direct comparability between the years is enabled. As a result, 9 cluster analyses are conducted. Whereas variables are measured in different units of measurement, clustering is carried out on standardized values of the observed variables. However, the interpretation of the results is given in the original units. To better understand the differences between the economies in each cluster in each year, profile diagrams, based on standardized values are given in Figures 1, 2, and 3.
RESULTS
DESCRIPTIVE ANALYSIS Table 2 delivers the results of descriptive statistics for selected variables individually per year. By comparing all three years, the upward trend of the average effective retirement age is evident (Table 2). This is in line with reforms aimed at prolonging the working age of the population, as a result of the aging phenomenon[25]. Growth of average effective retirement age has been recorded in all observed economies, except in Poland, where the average effective retirement age decreased from 61,68 in 1996 to 59,30 in 2006 and was raised to 61,13 in 2016. Significant growth of the average effective retirement age has been recorded in Bulgaria, from 56,7 in 1996 to 61,83 in 2016, and Romania, from 60,2 in 1996 to 67,16 in 2016. The disparity between the economies according to average exit from the labor market decreased in time, measured by the coefficient of variation, especially by comparing 2006 and 2016. Therefore, we can conclude that workers of the observed economies are on average
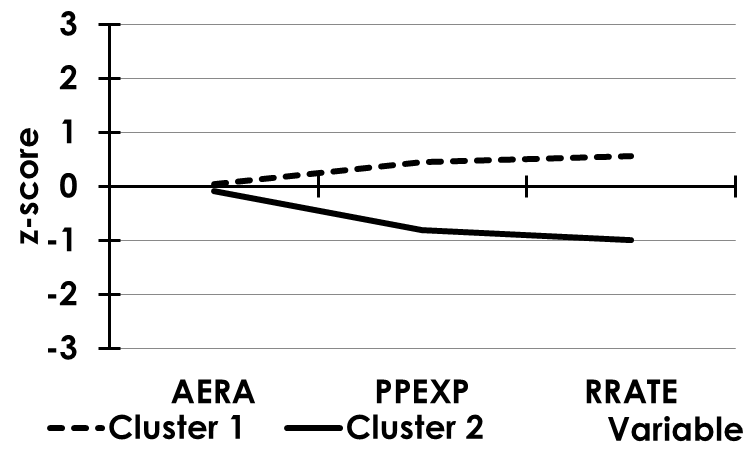
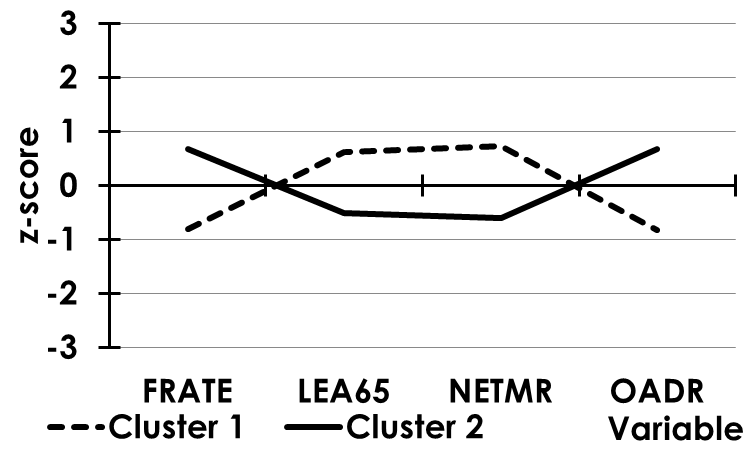
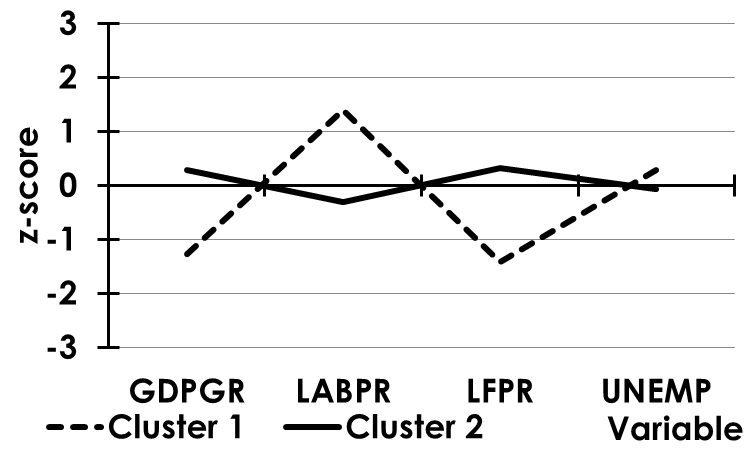
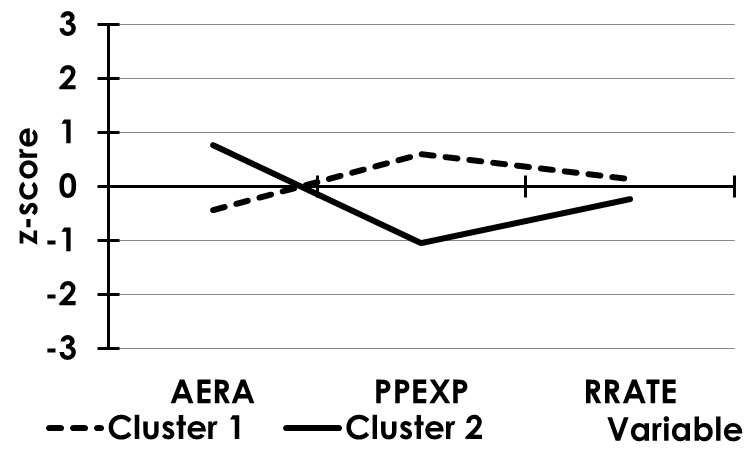
retiring later, with the average effective retirement age of 62 in 2016. Slovaks retire early, at the age of 60 in 2016, and Romanians at the latest, at the age of 67. New member states spend on average 9 % of GDP on public pensions, with a significant decrease of variability among the economies. The coefficient of variation for public pension expenditure as a share of GDP decreased from 28 % in 1996 and 2006 to 17 % in 2016. In all three years Poland remained the leader in spending on pensions, although it has reduced spending over the years, from 13,9 % in 1996 to 11,2 % in 2016. On the other hand, the countries that least spend on pensions, expressed as a percentage of GDP, are Lithuania, Estonia, and Romania, registering average values of below 7 % in all three years. The levels of pension expenditures are significantly determined, among others, by the replacement rate. This variable was approximated by the ratio of average pension and the average wage for the beginning of the observed period. It is interpreted as an indicator of the generosity of the pension system[4]. A slight increase in the average replacement rates may be noted, with reduced variability between countries. The most generous pensions in 1996 were registered in the pension systems of Slovenia (0,66), Poland (0,63), the Czech Republic (0,59), and Hungary (0,58). Bulgaria (0,29) and Lithuania (0,25) on the other hand recorded the lowest values of the replacement rates. In 2016 the highest replacement rate was recorded in Hungary (0,67), Romania (0,66), Poland, and Slovakia (0,62). Croatia (0,4) and Latvia (0,42) registered the least generous pensions. Next to the pension system’s design characteristics, the sustainability of pension systems is largely affected by demographics. The New Member States are facing the aging of the population, with the average old-age dependency ratio rising from 19,66 % in 1996 to 27,36 % in 2016. The old-age dependency ratio is a crucial factor in determining the system dependency ratio (the number of pensioners divided by the number of workers). Additionally, the time spent in retirement increased on average from 14,91 in 1996 to 17,53 in 2016, represented by the life expectancy at 65. Unfavorable demographics are further aggravated by large emigration flows in the majority of New Member States. Except for the Czech Republic, Estonia, Poland, Slovakia, and Slovenia, all economies experienced negative net migration. The average fertility rate rose from 1,38 in 1996 to 1,53 in 2016, with decreased variability among countries. Selected years were characterized by positive and high average GDP growth rates. While in 1996 there were large differences between the economies, ranging from almost stagnation in Hungary (0,01) to 6,8 % in Slovakia, relatively high growth rates marked 2006, with Latvia and Estonia recording 1,89 % and 10,27 % respectively. The economic performance with positive GDP growth rates made an influence on the labor market with decreasing average unemployment rates. The unemployment rate ranged in 2016 between 4 % in the Czech Republic and 13,5 % in Croatia. The average labor force participation rate recorded a slight increase, taking a value of 57,3 % in 2016. The significant rise of average labor productivity to 2010 was detected, from 62,74 % in 1996 to 111,49 % in 2016, whereby labor productivity was the highest in Romania, 131,8 % to 2010. The conducted outlier analysis shows no values that are significantly different from the other values for all selected variables in any particular year. CLUSTER ANALYSIS BASED ON DATA FOR 1996 Results of the hierarchical cluster analysis for each year are presented in Tables 3, 4, and 5. To better understand the differences between the economies in each cluster in each year, profile diagrams, based on standardized values are given in Figures 1, 2, and 3. In 1996, according to the characteristics of pension systems 2 clusters are formed. Cluster 1 is composed of countries with higher pension expenditures and more generous pensions: Croatia, Czech Republic, Hungary, Latvia, Poland, Romania, and Slovenia. On the other hand, economies such as Bulgaria, Estonia, Lithuania, and Slovakia were characterized by less generous pensions and less spending on pensions, as a share of GDP in 1996. While the pension beneficiaries of the economies making the Cluster 1 got on average half the wage, the ones of the second cluster obtained only one third. The workers of both clusters in 1996 went to retirement at approximately the same age. When the criterion is demographics, Cluster 1 with younger economies, higher fertility rates and higher life expectancy at 65 in 1996 is composed of Croatia, Estonia, Lithuania, Poland, Slovakia, and Slovenia. All economies recorded relatively high negative net migration rates,
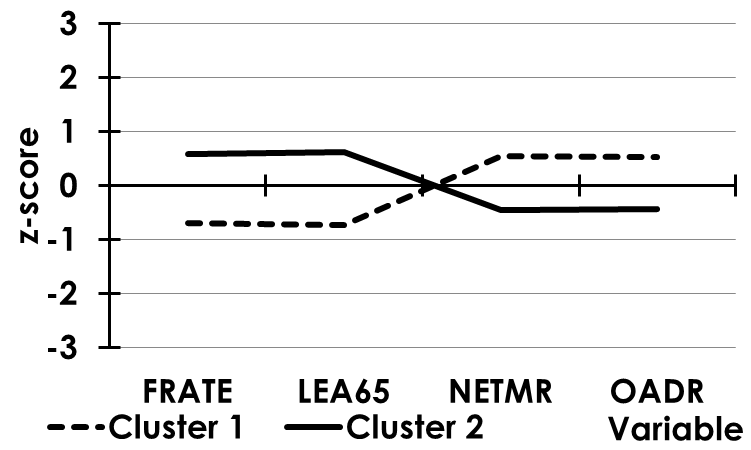
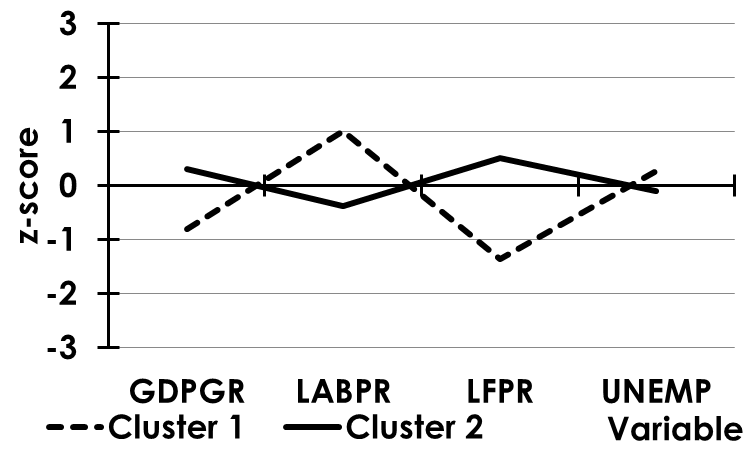
except for Slovakia. On the other hand, Bulgaria, Czech Republic, Hungary, Latvia, Romania make Cluster 2, composed of economies with a higher share of the elderly in the working-age population and lower fertility rates. Their pensioners live shorter in retirement. Except for Latvia and Romania, this cluster is made of net immigration economies. When the macroeconomics and the labor market of the observed economies in 1996 is concerned Cluster 1 with less favorable macroeconomic performance is formed. It is composed of economies with lower GDP growth rates, higher unemployment rates, lower labor force participation rates, but higher labor productivity to 2010. These economies were Bulgaria, Croatia, and Hungary. On the other hand, Czech Republic, Estonia, Latvia, Lithuania, Romania, and Slovenia make Cluster 2, characterized by higher GDP growth rates, lower unemployment rates, higher labor force participation rates, and lower labor productivity to 2010. CLUSTER ANALYSIS BASED ON DATA FOR 2006 According to the characteristics of pension systems, it is interesting how the structure of the clusters changed in 2006 compared to 1996. In 2006 all economies recorded approximately the same replacement rate, as opposed to 1996, but now the cluster (Cluster 1) with more active aging (meaning that workers go to retirement later) and lower expenditures on pensions is formed. It includes Estonia, Latvia, Lithuania, and Romania. The workers of these economies go to retirement later, on average at the age of 63,79, and the economies spent on average 6 % of GDP on pensions. On the other hand, Bulgaria, Croatia, Czech Republic, Hungary, Poland, Slovakia, and Slovenia belong to the group of economies that on average spent more on pensions, round 9 % of GDP and go to retirement earlier, at the age of 58,83. Finally, according to macroeconomics and labor market performance in 2006, a group of countries with lower GDP growth rates, higher unemployment rates, lower labor force participation rates, and higher labor productivity to 2010 make Cluster 1. These economies are Croatia and Hungary. The remaining economies (Bulgaria, the Czech Republic, Estonia, Latvia, Lithuania, Poland, Romania, Slovakia, and Slovenia) form Cluster 2. Based on the intersection of the cluster structure concerning all three criteria in 2006, it is evident that Bulgaria and Croatia had the biggest problems with the aging society, recording the highest share of 65+ population in the working-age population, early retirement, relatively high share of pension spending in GDP and the unfavorable situation on the labor market. A relatively low participation rate in 2006 and a relatively high unemployment rate characterized the labor markets of these two economies.
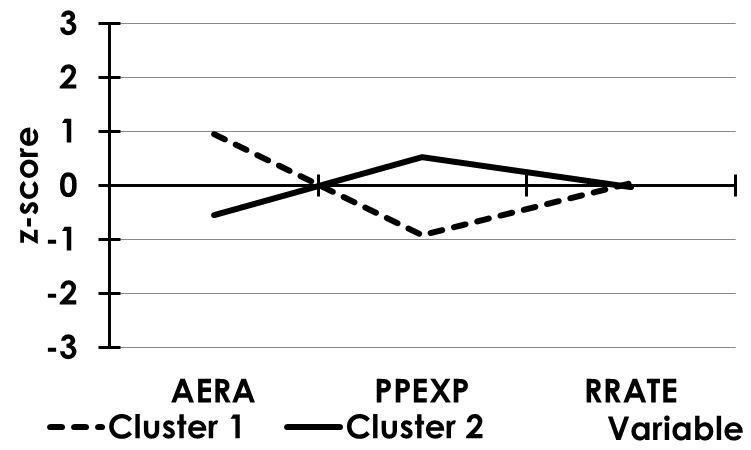
CLUSTER ANALYSIS BASED ON DATA FOR 2016 According to the characteristics of pension systems, the cluster structure in 2016 remains the same as in 2006. It means that the Baltic economies and Romania spent less on pensions and their workers go to retirement later on average. Less active aging and higher pension spending recorded Bulgaria, Croatia, Czech Republic, Hungary, Poland, Slovakia, and Slovenia. The pension beneficiaries of all observed economies recorded similar replacement rates as Figure 3 shows. According to demographics, Bulgaria, Croatia, Latvia, Lithuania, and Romania remained in Cluster 1 with a higher share of the elderly in the working-age population compared to 2006. All economies registered relatively high negative net migration rates. Unlike 1996 and 2006, Estonia recorded positive net migration in 2016 and joined Cluster 2. Additionally, Hungary
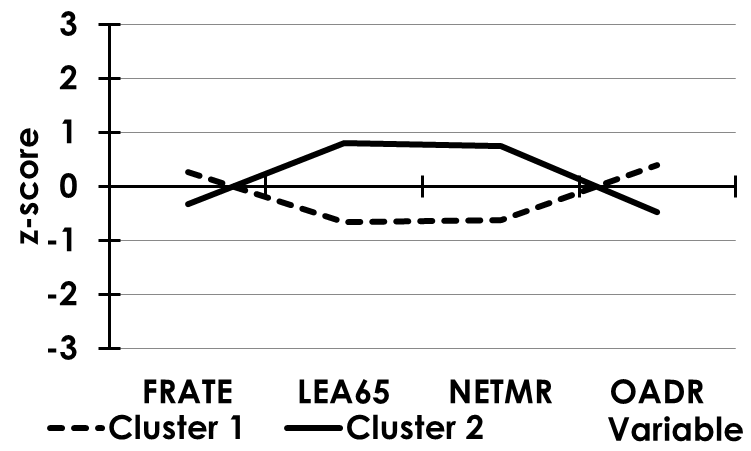
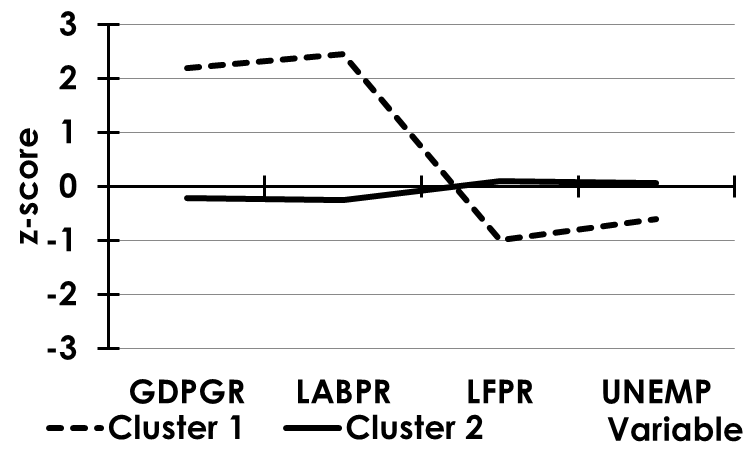
joined Cluster 1 due to the net emigration rate in 2016. Cluster 2 is composed of net immigration economies, with a relatively younger population, higher life expectancy at 65, and relatively lower fertility rates: Czech Republic, Estonia, Poland, Slovakia, and Slovenia. When macroeconomic and labor market performance is used as a criterion, it is interesting how Romania, due to exceptional macroeconomic and labor market performances in 2016, remained a sole member in Cluster 1, recording below-average unemployment rate in 2016, fourth-lowest, of 6,42 %, the highest GDP growth rate, of 4,82 %, and the highest labor productivity to 2010. On the other hand, its labor force participation rate was below average. Other economies make Cluster 2 with relatively higher labor force participation rates, relatively higher unemployment rates, lower labor productivity to 2010, and lower GDP growth rates in 2016.
CONCLUSIONS
The pension systems of the New Member States of the European Union: Bulgaria, Croatia, the Czech Republic, Estonia, Hungary, Latvia, Lithuania, Poland, Romania, Slovakia, and Slovenia are dominated by the pay-as-you-go (PAYG) social security scheme. Due to its structural design, there are sensitive to changes in demographics, macroeconomics, and design features of pension systems. Sustainability issues of pension systems are especially under pressure nowadays due to the aging phenomenon, in which the proportion of elderly is increasing. Economies worldwide are responding to these challenges by reforming their pension systems. In that environment, it is especially important to detect which economies are coping more successfully with aging, which of the analyzed economies have fewer problems with the sustainability of pension systems and better economic and labor market conditions. Therefore, our goal was to cluster the newest Member States of the European Union according to the above mentioned three perspectives of the pension system analysis: the characteristics of pension systems, demographics and the third category points out to macroeconomics and the labor market. In choosing the variables, which reflect those perspectives, the previous literature was consulted, but also supplemented by additional variables that were considered important for representing pension systems, macroeconomics, and demographics. Cluster analysis is employed for the three selected years: 1996, 2006, and 2016. The idea of clustering economies in three years with a 10-year gap seemed particularly interesting since it reveals how the cluster structure is changing over time. Additionally, they represent three different phases in the pension systems’ development. Moreover, the cross-section of the cluster in a particular year reveals which economies are better coping with the aging population, which of them have fewer problems with the sustainability of pension systems and better economic and labor market conditions. In line with reforms aimed at prolonging the working age of the population, all economies record an increasing trend of the average exit from the labor market, as a result of the aging phenomenon. The intersection of the cluster structure according to the chosen characteristics per year implies that Bulgaria and Croatia are groups of economies that have the least active aging, meaning that their workers go to retirement earlier. At the same time they record relatively high proportions of the population over 65 in the working-age population. Furthermore, these countries spend relatively more on pensions, expressed as a proportion of GDP. Relatively low participation and high unemployment rates describe adverse conditions in the labor markets of these economies. Besides, unfavorable demographics and pension system design is exacerbated by relatively high emigration rates. On the other hand, the Baltic economies and Romania are identified as a group of economies with more active aging, meaning that their workers go to retirement later. Pension systems of these economies are more sustainable, due to lower spending on pensions and more favorable economic conditions that are positively reflected in the labor market. Our idea of clustering NMS in three years with a 10-year gap, from three perspectives, that are shown to be important for the sustainability issues of pension systems, is a novelty in comparison to previous research and it is the main contribution of this article. Many studies have attempted to rank and classify pension systems, but the research of pension systems is mostly concerned with OECD countries, due to data availability, and often only theoretical. The findings of this article provide a guideline for future pension reforms because they show which countries' experiences and challenges could be valuable in defining certain policy measures. For example, pension systems of the Baltic economies and Romania stand out as more sustainable in comparison to other analyzed economies. However, several limitations should be taken into account regarding this research. First, the research is concentrated on public pension expenditures of analyzed economies, but at the same time, it excludes private pension schemes, which are especially important for the long-term sustainability of pension systems. Second, the results of our investigation are sensitive to the choice of variables used for the cluster analysis, as well as a selection of observation years. Finally, due to some missing data, the values of the corresponding variables for the next year were used as approximations, although we believe that such an approach has not significantly affected the structure of the clusters. Based on these limitations, future research could focus on private pension schemes, and researchers are encouraged to make experiments with different sets of variables and periods.