
INTRODUCTION
Since May 2005, Croatia has been a part of the Joint Harmonized European Union (EU) Programme of Business and Consumer Surveys (BCS)[1], which has enabled regular monthly publication of consumer confidence data (inter alia). More importantly, the accessibility of such valuable survey data has stimulated a new line of research. Several studies have established an empirical relationship between the Croatian Consumer Confidence Indicator (CCI) and various types of economic phenomena. Empirical evidence has supported the notion of a psychologically driven economic cycle[2][3], CCI was found to Granger-cause aggregate consumption, savings, and gross domestic product (GDP)[4], it was found to be a leading indicator of stock market returns[5], and consumer confidence data has served as a valuable information source for quantifying inflation expectations[6]. All of the above stated studies reflect on the hypothesis that consumer confidence is a leading indicator of economic activity, which is certainly not a novel idea in the international context (see e.g.[7] or[8] for verifications of economic sentiment’s leading characteristics with regards to the aggregate economic activity; see[9][10][11][12] for analogous studies with regard to the stock market; and e.g.[13] for an empirical utilization of consumer survey data for extracting inflation expectations). The notion of economic activity being to some extent driven by sentiment has initially been put forward by Keynes[14] and is nowadays considered to be a stylized fact of modern macroeconomics. However, the determinants of consumer confidence itself have somehow remained underexplored in the literature. Some studies do cover this topic, but they are largely limited to highly developed economies such as the United States (US)[15][16], Portugal[17], etc. On the other hand, the literature is rather silent on the determinants of CCI in small developing countries such as Croatia. Does the consumers’ economic sentiment (quantified through CCI) constitute a mere reflection of the prevailing macroeconomic conditions in the country, or is it completely independent of the macroeconomic outlook? These are the questions that we aim to answer in this article. We build several specifications of Autoregressive Distributed Lag (ARDL) models aimed to explain the variability of Croatian CCI. Our baseline models capture standard macroeconomic covariates such as GDP, the unemployment rate, stock market index, money market interest rate, consumer price index and real wage. These variables are typically utilized in similar studies of CCI determinants for highly developed economies[15][16][17]. Further on, we augment the stated set of covariates by real estate prices to take into account the specificities of the Croatian economy. The motive for examining Croatian real estate prices as a potential CCI determinant is quite straightforward. The real estate market is traditionally one of the most vibrant and most important sectors of the Croatian economy. There are several reasons for that. First, as opposed to saving/investing in modern financial instruments, Croatian consumers are conventionally oriented towards buying real estate as a specific form of saving[18][19]. Overall, Croatia has the third highest percentage of people living in their own dwellings in the EU [[20]. The rationale for such pattern is mostly founded in the historically embedded fear of hyperinflation. The overall effect of these tendencies is that the Croatian economy is highly dependent of the developments in the real estate sector. For example, claims have been made that the recent recession in Croatia would have been twice less intensive if it was not for the disturbances in the real estate sector[21]. Second, in recent years Croatia has witnessed several attempts and announcements of introducing the real estate tax (by as many as three different Croatian Governments). However, all of them were unsuccessful due to severe public pressure, and Croatia has remained the only EU country apart from Malta that has still not introduced the real estate tax[22]. Third, Croatian Government has introduced a subsidisation programme for housing loans in 2018[23]. It has been hypothesized that this program has also triggered a growth of aggregate demand for real estate, ultimately driving a rise in the real estate price level[5]. These three idiosyncrasies make Croatia a very intriguing case study, motivating us to meticulously explore the role of real estate prices in governing Croatian consumer confidence. Our results overall confirm the relevance of main macroeconomic variables in governing CCI. Variables that add the most to the goodness of fit of the assessed models are the general price level, interest rates, and real wages. Opposing our initial assumptions, real estate prices do not significantly feed into consumer confidence. This finding does not alter even if we introduce asymmetric effects in the assessed econometric models. The article is organised as follows. The following section presents a brief review of the literature on the determinants of consumer confidence. The third section explains the utilized dataset and the employed econometric methodology, while the fourth section explains the obtained empirical results. The concluding section offers some policy implications and directions for future research.
LITERATURE REVIEW
BCS provide valuable information for economic research and forecasting. They are widely used to identify inflection points in the economic cycle. Providing monthly data, continuous harmonization, and timeliness, BCS are a crucial complement to official statistics. The Consumer Survey consists of 12 monthly questions and three additional quarterly ones. The questions are organized around four general topics: financial situation of the household, general economic situation, savings, and intentions with respect to major purchases. The answering scheme is conceptualized in the form of a five-option ordinal scale. The issue of converting qualitative survey answers to numerical BCS indicators has deserved a lot of attention from both academics and practitioners. The conventional approach utilized by the European Commission is to apply response balances. Answers are aggregated as balances of positive over negative results per question (conditions are/will get a lot better, better, the same, worse, a lot worse), with double weights for extreme answers. However, the balance statistic does not take into account the percentage of respondents expecting a variable to remain constant. Recent research[24] has proposed to weight the balance statistic and take into account the percentage of respondents expecting no change in the evolution of an economic variable. This has provided an opportunity to accentuate the forecasting accuracy of BCS indicators. In a nutshell, the literature offers a wide array of quantification methods for survey-based leading indicators, ranging from probabilistic or regression-based approaches (see[25] for an overview), to state-of-the-art data-driven machine learning techniques[26]. However, the goal of this study is to discern the true determinants of CCI as the most influential and most widely utilized BCS indicator. Evaluating and ranking the alternative procedures for quantifying qualitative BCS responses is far beyond the scope of this article. With respect to the previous research on determinants of consumer confidence, the literature could be divided in two strands, depending on the focus on economic or non-economic factors. The first econometric studies of consumer sentiment and its determinants started in the 1970s and the introduction of economic variables such as real disposable income, inflation rate, unemployment rate, interest rate and stock market index as the key drivers of US consumer sentiment[27][28][29][30]. Later on, it was confirmed that the rising stock prices reflect rising current wealth and future income therefore positively affecting the consumer confidence[31]. These findings with respect to stock market indices were corroborated by[32], also discovering a negative relationship between contemporaneous consumer confidence and the future small-cap stock returns. In addition to confirming the positive impact of equity market in US, authors in[33] discovered its increasing effect over the time, as well as no impact in Belgium due to the relatively smaller share of listed equity in Belgian households’ wealth. A similar result was derived for Mexico[34]. For the other 10 analyzed countries from The Organisation for Economic Co-operation and Development (OECD), only consumer sentiment and share prices were found to have a statistically significant and positive impact, whereas the other variables had the expected signs, but the relevance was country-dependent[34]. In Europe, the determinants of consumer sentiment were analyzed in United Kingdom (UK), Germany, France and Italy, with particular interest in the impact of foreign factors[35]. Quarterly change in the international oil price was found to negatively affect consumers’ sentiment in Germany, UK and Italy. Rising US stock market was proven to positively affect the German consumer’ sentiment, whereas the effect was the opposite in the UK. Finally, the depreciation of German mark and French franc with respect to US dollar also decreased consumers’ confidence due to expected inflation followed by restrictive monetary policy. Berg and Bergström[36] evaluated the Swedish CCI over the 1975-1994 period. Their results indicated a statistically significant and negative impact of inflation rate and the real interest rate. Vuchelen[37] examined Belgium in the 1985-2000 period and found that consumer sentiment is negatively dependent on the short-term interest rate, change in unemployment, dollar rate, and the lagged value of consumer sentiment, whereas business cycle indicators influence it positively. More recently, research has been focused on panel data analysis of different developed or developing economies. Golinelli and Parigi[38] modeled consumer sentiment within the Vector autoregression (VAR) framework for 7 OECD countries. Inflation rate, unemployment rate and nominal interest rate were found to be significant across the economies, while the authors also suggested that the factors are time-varying and country-specific. Celik et al.[39] explored the long-term relationship between consumer confidence, industrial production and stock exchange index in six emerging countries in the period from January 2002 to August 2009. As expected, both variables showed a positive impact on consumer confidence, albeit the one of industrial production was five times larger. The interrelationship between CCI and real estate prices is not extensively covered in the literature, but some studies did empirically tackle the issue[40][41]. It was found that consumer confidence is correlated with the development of Dutch house prices in 1999 and 2000[40]. On the other hand, CCI did not improve the predictive power of real estate prices in Germany[41]. Finally, certain studies have focused on non-economic determinants of consumer confidence, such as political extreme events[18][42]. Similarly, some evidence has been found of election period effects[43]. In addition to political events, terrorism and its side-effects on consumer behaviour have also been examined[44], finding a statistically significant impact of terrorism events on the panel of 27 EU countries in the post-2001 period, expanding on the previous work of[45] and[46]. In this article, we add to the existing literature by analyzing strictly the economic determinants of consumer confidence. In Croatia, the interdependence of political and economic cycles is only marginally significant[47], while terrorism can fortunately still be treated as a non-issue.
RESEARCH METHODOLOGY
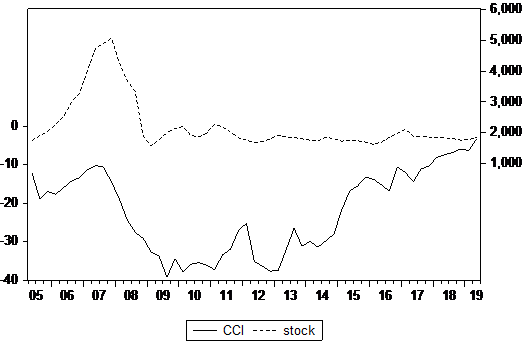
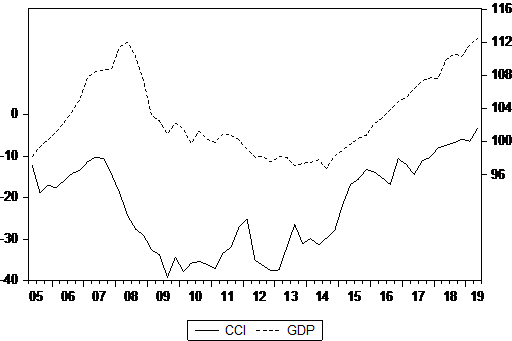
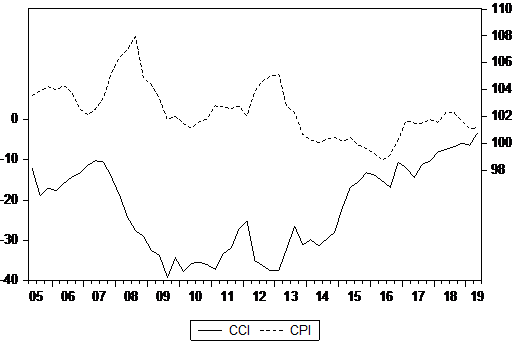
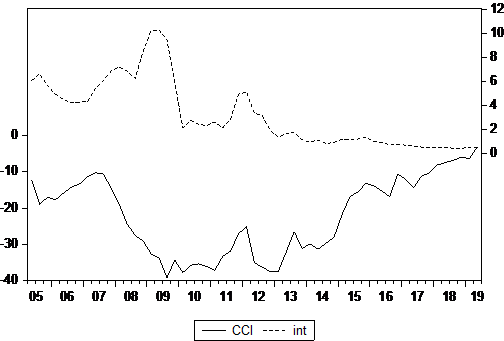
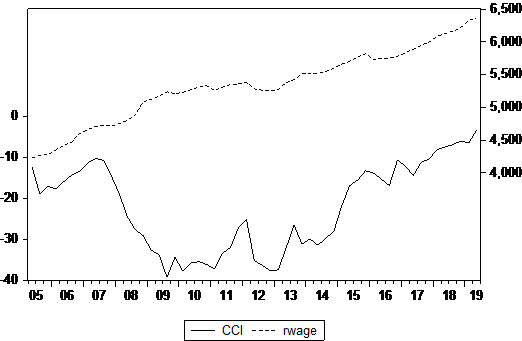
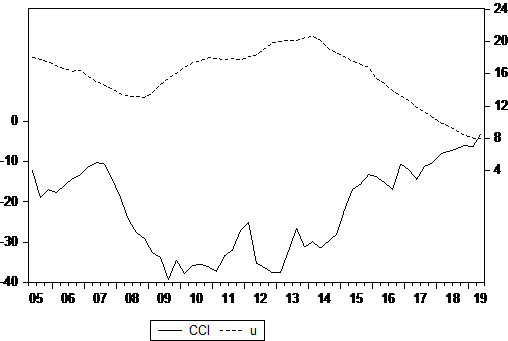
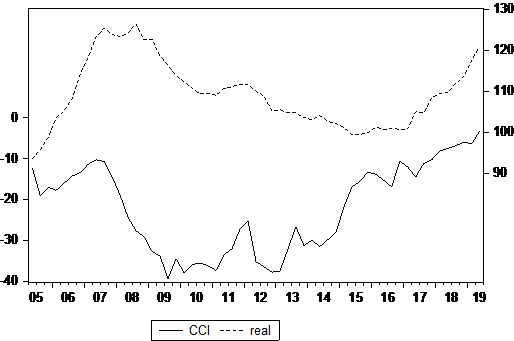
This section briefly discusses the utilized dataset and the applied econometric methodology. DATA The dataset assessed in this study focuses on the Croatian CCI (obtained from the European Commission). CCI is a composite indicator quantified as a simple arithmetic mean of four chosen response balances from Harmonized EU Consumer Survey: financial situation in the household over the last 12 months, expected financial position of the household, expected general economic situation in the country, and the likelihood of major purchases (the latter three questions refer to the forecasting horizon of the next 12 months)1[48]. Although CCI is conceptualized as a leading indicator of personal consumption expenditures[1], CCI has a much wider interpretation in empirical analysis. Namely, there is a body of evidence suggesting that CCI is related not only to hard economic data, but also to a wide array of non-economic concepts that are relevant for consumers’ subjective well-being. Some of them include the emotional state[34], armed conflicts[42][44] and immigration legislation[42]. In that sense, CCI can be roughly interpreted as a measure of life satisfaction. Although there are more direct quantifications of life satisfaction such as the Eurobarometer survey or the World Values Survey, they are conducted on a much lower frequency. The fact that CCI is published on a regular monthly basis makes it adequate for time series analysis such as the one in this study. Among the determinants of CCI, we explore the following variables: Croatian stock market index CROBEX (obtained through the Thomson Reuters Eikon database; stock hereinafter), chain linked volume of GDP (2015 = 100; source: Eurostat; GDP hereinafter), Consumer Price Index (value for 2015 equals 100; source: Croatian Bureau of Statistics; CPI hereinafter), 3 month money market interest rate (source: Eurostat; int hereinafter), average monthly real net wage (source: Croatian Bureau of Statistics; rwage hereinafter), and the registered unemployment rate (source: Croatian Bureau of Statistics; u hereinafter). These variables are considered because they are recognized as standard macroeconomic indicators in related literature[31][32][33],[36][37][38]. Examining whether real estate prices could add to the explanatory power of our model, we augment the dataset by the index of real estate prices (value for 2015 equals 100; source: Croatian National Bank; real hereinafter). All examined variables are in quarterly frequencies, spanning from 2005 Q2 (conditioned by the introduction of Harmonized EU Consumer Surveys in Croatia) to 2019 Q2. The dataset is seasonally adjusted using the ARIMA X12 method. We graphically depict the examined time series in Figure 1, showing all variables in relation to CCI as the goal variable in the article. This should enable a visual approximation of the potential coevolution of CCI and its each particular determinant. METHODS To this end, we apply ARDL methodology[49] to examine the relationships between the observed variables. ARDL methodology has some important advantages in comparison to standard VAR models and mainstream cointegration tests. Namely, it is well suited for small samples since it allows for different lag orders for each considered variable. Moreover, it is more efficient than the Engle and Granger[50] approach to testing cointegration. Finally, ARDL modelling allows for a combination of I(0) and I(1) variables, without the restrictive assumption that all variables are of the same order of integration. In the vein of[49], we estimate the following ARDL model:

where 𝑿𝑡=[𝑠𝑡𝑜𝑐𝑘𝑡 𝐺𝐷𝑃𝑡 𝐶𝑃𝐼𝑡 𝑖𝑛𝑡𝑡 𝑟𝑤𝑎𝑔𝑒𝑡 𝑢𝑡]′ and 𝑒𝑡 is a white noise error term. The lag order of the ARDL model (𝑝 and 𝑞, where we allow for different 𝑞 for each independent variable) is determined on the basis of the Akaike information criterion. The following diagnostic tests are
Figure 1. Graphical presentations of the examined time series. CCI is depicted on the left ordinate axis, while other examined variables are shown on the right ordinate axis.
carried out for each ARDL model: autocorrelation Lagrange Multiplier (LM) test of 4th order, the Jarque-Bera normality test and White’s heteroskedasticity test. Whenever the residuals turned out to be characterized by autocorrelation or heteroskedasticity (at the 5 % significance level), the Newey-West autocorrelation- and heteroskedasticity--consistent (HAC) estimator is utilized. Cointegration among the examined variables is tested according to the bounds test procedure[51]. To be specific, Pesaran, Shin, and Smith[49] define the cointegration test through a null hypothesis of lagged levels of variables in equation (1) being jointly equal to zero (𝜌=𝜃1=⋯=𝜃6=0). A modified F-test is applied (details given in[49]], while the employed lower and upper critical values for the cointegration test are generated for smaller sample sizes of 30 to 80 observations[51]. In the next step, we re-estimate equation (1) adding 𝑟𝑒𝑎𝑙 to the model in order to question if real estate prices are able to explain a considerable portion of CCI’s variability. The relationship between consumer confidence and its determinants does not necessarily have to be purely linear or symmetric. Namely, consumers react to bad news more strongly than to gnews[52] ood[53]. To account for possible asymmetric dynamics, we employ the nonlinear ARDL (NARDL) framewor[54]. Just as for the linear ARDL modelling, the lag order of the NARDL model was determined on the basis of the Akaike information criterion. Whenever the residuals turned out to be characterized by autocorrelation or heteroskedasticity (at the 5 % significance level), the Newey-West autocorrelation- and heteroskedasticity-consistent (HAC) estimator is utilized. The model comes down to:


where
and
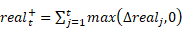
The point of this transformation is to discriminate between positive and negative changes in 𝑟𝑒𝑎𝑙. In both equations (1) and (2), we allow for a maximum of 4 lags for each particular regressor, as a compromise between precision and preserving an adequate sample size. The null hypothesis of no cointegration

is again tested by a standard Wald test. A novelty of NARDL in comparison to linear ARDL is the necessity to test for long run (LR) symmetry (𝑯𝟎:

and short run (SR) symmetry
again by means of a Wald test. It is suggested to test for both types of (a)symmetries (LR and SR) and to re-estimate equation (2) if only one type of asymmetry or none is found[55]. This should prevent the researcher from obtaining biased results due to model misspecifications. If the null hypothesis of LR symmetry cannot be rejected, we re-estimate equation by inserting the level of 𝑟𝑒𝑎𝑙𝑡 instead of 𝑟𝑒𝑎𝑙𝑡+ and 𝑟𝑒𝑎𝑙𝑡−. Similarly, in case the SR symmetry cannot be rejected, we re-estimate model (2) using first difference lags Δ𝑟𝑒𝑎𝑙𝑡−𝑗 instead of Δ𝑟𝑒𝑎𝑙𝑡−𝑗+ and Δ𝑟𝑒𝑎𝑙𝑡−𝑗−. Finally, if both types of symmetries are rejected, we re-estimate the initial linear ARDL model, expression (1). As the final robustness check, we apply a reduced VAR model. Since in our initial calculations we were not able to obtain a unique cointegration vector using the Johansen procedure, we opt for the Toda and Yamamoto[56] procedure for causality testing in the presence o nonstationary variables. The procedure entails adding m additional lags to the VAR model (where m is the maximum order of integration in the observed dataset) to the p lags indicated by the Akaike information criterion. In the subsequent Granger causality test, only the initial p lags of the observed variables are utilized.
EMPIRICAL RESULTS
With the possible exception of 𝑠𝑡𝑜𝑐𝑘, most variables seem not to exhibit mean-reverting properties. This is formally tested using the Augmented Dickey-Fuller (ADF) test. The obtained results are presented in Appendix A. None of the examined variables are integrated of order higher than one, which is a prerequisite for utilizing the ARDL bounds testing procedure[49]. For the vast majority of assessed variables, it is quite clear that they are I(1). Variable 𝑠𝑡𝑜𝑐𝑘 seems to reject the null hypothesis even in levels (in the test specification with only constant included), but since the ARDL bounds test procedure allows for a mixture of I(0) and I(1) variables, the final verdict in this particular case is not of such importance. The results of estimating equation (1) are presented in Table 1. The utilized lag orders are chosen by the Akaike information criterion. Since it is obvious from Table 1 that the model suffers from autocorrelation at the 1 % significance level, robust (HAC) standard errors are applied.
*table entries for the diagnostic tests are the corresponding p-values
Long run parameters for the six independent variables (presented in Table 1) are obtained as
[57]. It is easily observable that the assessed variables are cointegrated at the 1 % significance level. The long run parameters reveal a significant positive relationship between CCI and the CPI, int, and rwage. One should interpret these results with some caution. Without insisting on explicit causal claims, we are prone to interpreting this as a sign that the general growth of the economy (as usually characterized by inflation, interest rate growth and real wage increase) stimulates consumer to perceive their economic environment in a more optimistic manner. The insignificant effect of 𝑠𝑡𝑜𝑐𝑘 is somewhat expected since the domestic stock market is quite illiquid and characterized by a very small number of traders. Some authors even call the Zagreb Stock exchange an “almost exclusive platform for institutional investor actions” [58]. It is therefore no surprise that consumers do not psychologically respond to stock market developments. In the short run, CCI seems to be much more responsive to GDP, 𝑠𝑡𝑜𝑐𝑘, and 𝑢, while the significance of other variables greatly varies across lags. In the next step, we augment expression (1) by 𝑟𝑒𝑎𝑙. The obtained results are presented in Table 2. Although the augmented model presented in Table 2 also reveals significant cointegration (at the 5 % significance level), the goodness of fit of this model has not increased. On the contrary, the adjusted R square has even diminished from 0,7216 to 0,686. Therefore, it seems that real estate prices in Croatia do not significantly feed into consumer confidence. The same conclusion can be drawn by noticing that 𝑟𝑒𝑎𝑙 is not significant neither in the long run nor in the short run. These results are in line with[41]].
*table entries for the diagnostic tests are the corresponding p-values
In the short run, CCI is significantly affected mostly by GDP and 𝑢, and for individual time lags by the 𝑠𝑡𝑜𝑐𝑘 and rwage , corresponding to the fiis i[[n[31], 32, 38, 39]. We also tried to discern if the effect of 𝑟𝑒𝑎𝑙 is asymmetric. Could it be that the sign and/or magnitude of its impact on CCI is different for positive and negative changes in 𝑟𝑒𝑎𝑙? After estimating equation (2) and allowing for asymmetries in all considered regressors, we tested for both LR and SR types of asymmetries (as suggested in [55]). However, the null hypothesis of LR symmetry could not be rejected at any conventional significance level (p-value = 0,4257). The same conclusion was also drawn for the SR symmetry, with a p-value of 0,1074. Therefore, the model presented in equation (2) clearly breaks down to the conventional ARDL specification. The goodness of fit obtained for the model presented in Table 3 cannot be enhanced by introducing asymmetries in the specification. Finally, the results of the Toda and Yamamoto[56] Granger causality testing procedure are given in Table 3. In the underlying calculations, four lags are chosen as the optimal lag order (according to the Akaike criterion), and one additional lag is fitted to the variables at hand to fix the asymptotic properties of the estimator by taking into account data nonstationarity. CCI is treated as the dependent variable in the model.
| Variable | 2 test statistics | ||||
|---|---|---|---|---|---|
| stock | 13,4591*** | ||||
| GDP | 3,6888 | ||||
| CPI | 7,5538 | ||||
| int | 5,4894 | ||||
| rwage | 3,8665 | ||||
| u | 9,9886** | ||||
| real | 3,0821 |
*significant at 10 % probability level **significant at 5 % probability level ***significant at 1 % probability level The results presented in Table 3 are quite similar to the short-run results of ARDL models (Tables 1 and 2). CCI seems to be highly responsive to 𝑠𝑡𝑜𝑐𝑘 and 𝑢. This article is merely the starting point for analysing CCI’s determinants in Croatia. The hereby observed macroeconomic variables were able to explain around 70 % of variability in CCI (adjusted R-squares of the estimated ARDL models are equal to 0,7216 and 0,6868). This encouraging finding does not leave very much room for improvement in the goodness of fit, but it can be speculated that some of the potentially relevant variables (that were left out here) might include political factors or latent egotropic variables such as the level of societal pessimism/optimism.
DISCUSSION AND CONCLUSION
Although the literature robustly shows that consumer confidence can be used as a leading indicator of the macroeconomy, not much has been written insofar on the driving forces of CCI itself. This statement holds even for the developed countries, but the literature is almost completely silent on this topic in the developing economies. This article provides an initial attempt to discern the determinants of CCI in Croatia, a country with an economic system extremely dependent on the real estate sector. In accordance with the previous literature, we assess a wide set of CCI determinants for Croatia. These include the stock market index, GDP, consumer price index, interest rate, real net wage, and unemployment rate. Those variables form our first model, which we further augment by the index of real estate prices. We employ ARDL and NARDL methodology to examine the relationships between the observed variables. The long run parameters reveal a significant relationship between CCI and general price level, interest rates, and real wages. Our results are in line with[36] and[38]. Insignificant stock market effect is somewhat expected since the domestic stock market is quite illiquid and characterized by a very small number of traders, as opposed to highly developed markets considered in similar studies[31][32][33][34][35],[39]. In the short run, CCI seems to be much more responsive to stock market developments and unemployment. Depending on the chosen lag, our results are in line with[36][37][38], and[39]. In both model specifications (with and without real estate prices), the unemployment rate exerts strong negative pressure on consumer confidence. With respect to the stock market index, in both model specifications, the parameter is positive but relatively smaller in comparison to other significant parameters. Its positive impact is validated since in all cited articles[31][32][33][34][35][39], the effect is statistically significant and positive. However, its relative size could be interpreted similar to[33], where the authors accentuate that only a minor part of households’ wealth in Belgium consists of stocks. A similar explanation can be offered here. Due to historical Croatian investment patterns of preserving wealth in real estate, a considerable portion of wealth is being held in the form of bank account deposits or cash-at-hand. Combining this with a relatively low level of financial literacy, it is no wonder that the general level of consumer confidence is irresponsive to stock market movements. Within the augumented model, Croatian CCI seems not to be significantly influenced by real estate prices. This finding is valid both in the short and long run, and both in linear and asymmetric ARDL specifications. Our findings conform to[41] in that sense. Consumers seem to considerably boost their sentiment in reaction to increases in interest rates. The documented positive link between interest rates and consumer confidence is in strong contrast with previous literature. We interpret these findings as the consumers observing improvements in the general economic outlook. The final manifestation of such tendencies is the accompanying growth of consumer confidence. We have stated that the periods of rising interest rates are characteristic for expansionary economic periods with monetary authorities aiming to cool down the economy. Additional rationale for a positive relationship between consumer confidence and interest rates could be related to the wealth effect. In a rising interest rate environment, households with a significant amount of cash at hand (both physical cash and in deposits-a-vista) might opt for a relatively safe investment in the form of long-term deposits that guarantee certain return and are to some extent secured by the Government. The wealth increase in the form of capital gains due to rising interest rates would result in rising consumer confidence, unless it is offset by a relatively stronger negative effect on the current disposable income through increased interest rate expenses. Finally, the most striking result is the consistenly positive and significant long-term impact of inflation on consumer confidence, which is in contrast with all previous research. As stated, rising inflation is commonly a tell-tale sign of growing economy, with a certain threshold representing “healthy” inflation. Previous studies mostly interpret the observed negative link between inflation and consumer confidence in relation to financial or economic instability reflected in inflation. Bearing in mind that prices should not be prevalent in determining long-term economic factors, further research is required to disentangle their impact on consumer confidence. All of these findings could be of great importance for policy makers. Boosting consumer sentiment could result in consumption growth, and consequently in the growth of economic output. It is important for any economic policyholder to have a thorough understanding of the functioning mechanisms of the economic system, regardless of the final goal of the underlying policy. Knowing that CCI is significantly determined by e.g. unemployment and real wages makes it easier for the Government to adequately manage possible economic crises and set up coherent countercyclical policies to boost the economy. Like any novel economic research, especially one concerning a country such as Croatia, characterized by peculiar investment patterns (underdeveloped capital markets with strong inclination to real estate investing) or inherited consumer behaviour patterns caused by historical hyperinflationary periods, our findings should be considered as a foundation stone of future research that would yield more robust results. In this research, the most significant short-term determinants of the CCI are GDP growth rate and unemployment rate, as well as the stock market index, although to a lesser extent. This is no surprise since the stated variables are among the widely most communicated economic indicators in the media, shaping the economic sentiment of the general public. Several implications for practice could be drawn, depending on the variable discussed and observed horizon, but the common denominator is expectations management and the generating process of consumer confidence. The need for methodological precision and consistency, coupled with timing and communication to the general public could be of outmost relevance to the short-term dynamics of the CCI. The unemployment rate, which exerts rather strong negative impact on CCI, is subject to methodological discussions. Firstly, the most widely publicly communicated unemployment rate, as well as the one used in this research, is the one calculated by the Croatian Bureau of Statistics, which reflects the registered number of unemployed persons. This indicator is usually higher than the one obtained through Labour Force Survey (Eurostat methodology) and is highly susceptible to registry guidelines (for instance, an individual is removed from the registry if she refuses prequalification or vacancy for three times). Secondly, the unemployment rate depends on the labour force figure that might be particularly challenging to estimate in an economy characterized by major emigration outflows and lack of systematic administrative procedures to determine individuals’ residence and/or labour status abroad. As news on unemployment rate dynamics shape consumer confidence, these shortcomings should be properly addressed. GDP growth rate stands out as the second most significant short-term determinant of the CCI. Due to the scope of the indicator, it is published two months following the reference period. Since it is highly unlikely that this lag could be reduced considerably without diminishing the quality of GDP calculation, communication of results by the decision-makers is essential for governing consumers’ expectations, especially if the results imply a negative growth rate. In the context of recent global epidemic outbreak or any other severe exogenous shock to the economy, a credible action plan backed by detailed set of economic measures could reaffirm consumers’ confidence or alleviate its downfall which would further deteriorate the economic growth rate. Finally, CROBEX index also positively affects consumers’ confidence through the expectations of higher personal wealth and future consumption. The periods of extraordinary price volatility in a relatively illiquid market fuel uncertainty, which could exert negative impact on the consumer confidence. Bearing this in mind, the stock exchange operator should encourage or even enforce the highest standards of corporate reporting among issuers in order to mitigate the information asymmetry. In addition to that, constant development of the trading protection mechanisms is much needed, such as stock trading suspension in case of major day-to-day drop of stock index, a capital markets equivalent to the bank run. With reference to the relevant long-run determinants of the CCI, as stated in the empirical results section, the interpretation of obtained results and consequently their practical implications should be taken with caution and should be the subject of further research. In this article, we add to the existing literature by analyzing strictly the economic determinants of consumer confidence. The interdependence of political and economic cycles is only marginally significant in Croatia, so those factors are out of the scope of this article. Institutional and culturological variables (such as those from the World Bank Doing Business database or the World Values Survey) might in some cases improve the model fit, and we recommend to add such variables in cases of analysing multiple countries in a panel framework. In this article we also do not consider the possible influence of geopolitical risks as potentially important factors of consumer sentiment. Fortunately, this can still be treated as a non-issue for Croatia, but multi-country evaluations might benefit from such concepts. However, an additional portion of CCI’s variability might be explained by assessing major political/cultural events. In case of Croatia, regarding the potential political events, one could hypothesize that the impact of corruptive affairs of the Government (arrest of the ex Prime Minister in 2010), the date of EU entry on 1st July 2013 or extraordinary parliamentary elections in 2016. We believe this article has initiated a novel branch of literature for the Croatian economy, and offered several implications for the academic community. When analysing the influence of real estate prices on consumer confidence, future research should certainly try to differentiate between the prices of existing housing and newly built real estate. Historical time series for the two stated categories are considerably shorter than the rest of the dataset analysed in this study, so adding them to our models would additionally shorten our already limited sample size. We would highlight this as the main limitation of the article, and leave that for some future study. Likewise, it might be beneficial to analyse if the result would change much if CCI would be replaced by some other economic sentiment measure, such as e.g. confidence indicator for the construction sector. A further research goal potentially worth pursuing is the quantification of specific news-based indices related to CCI and the real estate market. Nowadays quite a few web scraping tools are available, enabling researchers to quantify the intensity of media reports on specific topics such as e.g. changes of real estate prices. This type of indices derived from text-based media data might prove to be useful in terms of explaining and predicting CCI. Furthermore, it might be beneficial to utilize the Croatian Economic Policy Uncertainty Index[47], which might greatly impact the Croatian housing market and CCI. In periods of high economic policy uncertainty, consumers are less likely to buy dwellings due to the lower predictability of real estate prices, as well as the general economic situation and consumers’ personal financial situation. Economic news indices are out of the scope of this article, but could be viewed as a great potential for further research. Additionaly, further research could broaden the analysis by some additional macroeconomic indicators like e.g. the employment rate and real disposable income, although our analysis has shown that the chosen variables explain a lion’s share of variability in consumer confidence. It is notable that Croatia is one of the two European Union countries without a real estate tax. Still, it would be very interesting to investigate the impact of current government real estate subsidies on consumer confidence in Croatia (especially in terms of willingness to purchase dwellings) and consequentially on the real estate prices. Unfortunately, adequate micro data sources are not publicly available at the moment, but this would be a very interesting topic for further research. Finally, the behavior of economic agents is often more influenced by psihological factors in the crisis periods, so we recommend to replicate this analysis after a few years with a longer post-crisis time series to analyse the effects of house price index on consumer sentiment in the crisis and post-crisis period separately.
ACKNOWLEDGMENTS
This work has been partly supported by the Croatian Science Foundation under the project No. 4189, and is a part of the scientific project ”Behavioral aspects of the (non)introduction of real estate tax in Croatia”, supported by the University of Zagreb, Croatia.
REMARK
1It should be noted that the European Commission has recently altered the methodology of calculating CCI. To check the robustness of our results, we repeated our ARDL analysis using the “old” CCI data, but the main conclusions have remained intact. We leave out these results here for the sake of brevity.