
1. INTRODUCTION
Digital marketing experts estimate that an average American is exposed to around 4-10 thousand advertisements each day (RedCrow Marketing, 2015,https://www.redcrowmarketing.com/2015/09/10/many-ads-see-one-day/). Additionally, global consumers apathy remains, as almost half of them neither like nor dislike advertising, while 1/3 dislike it generally in 2019 and 2018 (Kantar Media, 2019:6). In today's economy of abundance, marketers are continually under pressure to justify market communication investments in the long run. They recognized brand equity as a unique marketing asset that can play a vital role in differentiating from competitors and ensuring long-term consumer loyalty.
The purpose of this paper encompasses verifying the applicability of the consumer-based brand equity model on the youth fashion (apparel and footwear) market in Croatia. Brand equity is considered a precious marketing and business concept for practitioners and scholars. This study is focused on the perceptual consumer-based brand equity approach and widely adopted Aaker's (1991) conceptualization with four primary dimensions: brand awareness, brand associations, perceived quality, and brand loyalty. The research's objectives encompass testing the associative and particularly causal relationship between these four components and the overall brand index construct to verify in the previous studies assumed hierarchy among these components. The results might suggest the possible path of marketing activities execution for practitioners and future validation of the results on other markets for scholars.
In the next section, a brief review of the topic's dominant views, with a short overview of the worldwide fashion market and hypotheses development, was given. Finally, the research framework, methodology and empirical results were displayed, followed by discussion and concluding remarks.
2. THEORETICAL FRAMEWORK AND HYPOTHESIS DEVELOPMENT
2.1. Brand equity
The high costs linked to the launch of the new products followed by high failure rates of new products and increasing costs of advertising and distribution represent some of the reasons for the continuous rise of interest in brand equity building (Crawford, 1993; Ourusoff, 1992,Aaker, 1991, cited inPappu et al., 2005:143). The advantages of brand equity are notorious. According to Aaker (1991:15), brand equity provides value to customers by enhancing their interpretation and processing of information, confidence in the purchase decision, and user satisfaction. It also provides value to the firm by enhancing the efficiency and effectiveness of marketing programs, brand loyalty, prices and margins, brand extensions, trade leverage, and competitive advantage. Previous research corroborated a positive impact of brand equity on consumer preference and purchase intention (Cobb-Walgren et al., 1995), market share (Agarwal & Rao, 1996), consumer perception of product quality (Dodds et al., 1991), consumer price sensitivity (Erdem et al., 2002) and resilience to the product-harm crisis (Dawar & Pillutla, 2000, cited in Chrostodoulides & de Chernatony, 2010:44).
Brand equity was conceptualized back in the late 1980s, but the researcher's interest remains dynamic (for instance, just the Scopus database records 68 articles considering consumer-based brand equity topic in 2019 and 2020). However, the issue of universally acceptable brand equity definition was not resolved yet. Brand equity is considered a very complex concept that some authors compared its various conceptualizations with an ancient Indian "blind men and elephant" story (Ambler, 2003:41). So far, Farquhar's definition of brand equity as the added value endowed by the brand to the product gained the most consensus (1989, cited inSu and Chang, 2018:92). One of the most cited, Aaker's definition of brand equity from a cognitive psychology approach (1991:27) as a set of brand assets and liabilities linked to a brand, its name and symbol, that add to or subtract from the value provided by a product or service to a firm and/or to that firm's customers, opened up two main streams of research: consumer-based and firm-based brand equity (Christodoulides et al., 2015:309). Firm-based brand equity is often perceived as an outcome of consumer-based brand equity. This study is focused on consumer-based brand equity, which Keller (1993:8) defines as the differential effect of brand knowledge on consumer response to the marketing of a brand.
2.2. Consumer-based brand equity
Aaker's (1991) and Keller's (1993) definitions of brand equity guided many empirical studies of consumer-based brand equity (CBBE) over the past three decades. Tasci literature review (2021:172-175) revealed 83 studies (conducted between 1991 and 2020), which followed Aaker's or Keller's proposed CBBE structure. The lack of consensus regarding brand equity definition transferred onto little agreement on its constituent dimensions (u & Chang, 2018:92) and lack of generally accepted scales to measure the brand assets (Christodoulides et al., 2015:308). Although numerous researchers somewhat changed the original components (Tasci, 2021: 171), Aaker's five assets of brand equity are the most commonly adopted model of CBBE (Aaker, 1991:15): brand loyalty, brand (name) awareness, perceived quality, brand associations in addition to perceived quality (as so-called primary or core assets) and other proprietary brand assets, like patents, trademarks, channel relationships, etc. Applying the consumer-based behavioural view of brand equity on these assets means measuring cognitive and behavioural brand equity at the individual consumer level through a consumer survey (Yoo and Donthu, 2001:2). This perception-based brand equity is measured from different perspectives, consumers (in general), customers (actual buyers), employees or residents (Tasci, 2021:170). Consequently, various CBBE measurement models were developed. For instance, a literature review by Szocs (2014:105-112) analyzed the 13 most essential models of CBBE measures, compiled from two (Chau and Ho, 2008) to seven brand equity dimensions (Erdem and Swait, 1998).
Brand equity topic gained moderate interest from Croatian scholars. For instance, Rajh (2002, 2006, 2009, 2019) researched a scale for customer-based brand equity measurement, Sinčić Ćorić and Jelić (2015), tested the applicability of Keller's concept in the B2B market, Vukasović (2016) researched CBBE on Croatian and Slovenian food market, etc.
2.3. Fashion industry
The value of brand equity is easily noticeable in the global fashion (apparel and footwear) market, which accounted for 2.5 trillion $ in 2017 (BoF McKinsey FashionScope, McKinsey&Company, 2018:64), 519.5 bn EUR of European consumer expenditures on textile and clothing in 2018 (https://www.statista.com/topics/3423/clothing-and-apparel-market-in-europe), and employs over 300 millions people worldwide (Gazzola et al., 2020:1). The global fashion industry was (pre-Covid-19 crisis) expected to grow steadily by 3 to 4% and 4.5 to 5.5% in emerging Europe (BoF McKinsey Global Fashion Index, McKinsey&Company, 2019:98).
One of the most prominent market segment for fashion, especially the fast fashion industry, is a large population of young people (approx. 3.78 bn aged 30 or below globally, or 242 mln in Europe in 2020, United Nations, World Population Prospects,https://population.un.org/wpp/DataQuery/). Within this age group, college students (surveyed in this study) easily and quickly adopt fast fashion products because of their limited financial resources and tendency to wear trendy and socially visible clothing (Su & Chang, 2018:91). Most survey participants belong to generations Y and Z, which accounted for 47% of worldwide luxury consumers and 33% of luxury purchases in 2018 (BCG-Altagamma, 2019: 19). The purchases of fashion luxury brands, account for over 30% of personal luxury goods (60 bln EUR worldwide purchases in 2018, D'Arpizio et al., Bain & Company, 2019:6;20).
2.4. Research hypothesis development
Following the most generally accepted Aaker's (1991) approach (Su and Chang, 2018:92), this study applies a CBBE model, which captures four (primary) constructs: brand loyalty, perceived quality, brand awareness, and brand associations. These four brand equity dimensions are widely accepted and used by numerous researchers (e.g. Yoo et al., 2000;Pappu et al., 2005;Pike et al., 2010;Kim and Hyun, 2011;Buil et al., 2013,Vukasović, 2016).
A broadly utilized Yoo and Donthu (2001:6-9)1 conceptualization of multidimensional brand equity construct proposed a three-dimensional model as a better fit than four-dimensional because a high correlation between brand awareness and brand associations suggested inseparability of those two constructs. However, these study combined Yoo and Donthu (2001:10-11) multidimensional brand equity (shortened: MBE) and unidimensional (overall) brand equity (shortened: OBE) framework with Buil et al. (2013:63-64) research of casual order among the dimensions of brand equity. According to the later framework, consumers' awareness of the brand leads to attitudes (e.g. perceived quality and brand associations), which in turn will influence attitudinal brand loyalty (Lavidge and Steiner, 1961; Gordon et al., 1993; Konecnik and Gartner, 2007, cited inBuil et al., 2013:63). Furthermore, some scholars (e.g. Brady et al., 2008; Chen, 2001; Nam et al., 2011, Cifci et al., 2016, cited inSu and Chang, 2018:95) argued that brand loyalty could be excluded from the brand equity construct as represents one of the consequences of brand equity. Therefore, the present study examines the view which considers brand loyalty as an outcome of brand equity. Furthermore, this research investigates the four dimensions CBBE model's causal relations, which emanated as a conclusion from Tasci (2021:186) meta-analysis.
Brand awareness refers to the strength of a brand's presence in the consumer mind. Aaker (1991:61-62) defines brand awareness as a potential buyer's ability to recognize or recall that a brand is a member of a certain product category. Aaker awareness pyramid suggests three levels of brand awareness, from simple brand recognition (aided recall test), brand recall (unaided recall) and top of the mind (first brand in the unaided recall). According to Rossiter and Percy (1987), brand awareness is the consumers' ability to identify or recognize the brand, while Keller (1993) composed brand awareness of both brand recognition and brand recall (Pappu et al., 2005:145). Following the Buil et al. (2013:63) and Su and Chang (2018:95) perspectives, the first three hypotheses examine the effect of brand awareness on perceived quality, brand associations, and brand loyalty:
H1. Brand awareness has a significant positive effect on brand associations.
H2. Brand awareness has a significant positive effect on perceived quality
H3. Brand awareness has a significant positive effect on brand loyalty.
Perceived quality, as defined by Zeithaml (1988:3), refers to "the consumer's judgment about an entity's (product's or service's) overall excellence or superiority." Within his CBBE framework, Aaker (1991:80-81) defines perceived quality as the customer's perception of the overall quality or superiority of a product or service concerning its intended purpose relative to alternatives. The results of the previous research suggests that high levels of perceived quality can enhance brand loyalty (e.g. Pike et al., 2010:444,Pike and Bianchi, 2016:127).
Brand associations were conceptualized by Aaker (1991:101) as "anything linked in memory to a brand." Brand associations represent the basis for purchase decisions and brand loyalty (Chen, 2001, cited inSu and Chang, 2018:96). The more brand associations embedded in a product, the more the product will be remembered by consumers. Brand associations may be derived from different sources, perceived value, brand personality and organizational associations being the essential predictor of brand equity (Su and Chang, 2018:93,Ahmad and Sherwani, 2015: 62). Perceived quality and brand associations precede and can enhance brand loyalty (Keller and Lehmann, 2003; Chaudhuri, 1999; Keller and Lehmann, 2003;Pike et al., 2010, cited inBuil et al., 2013:64); thus, the following hypotheses may be proposed:
H4. Brand associations have a significant positive effect on perceived quality.
H5. Brand associations have a significant positive effect on brand loyalty.
H6. Perceived quality has a significant positive effect on on brand loyalty.
Brand loyalty represents a measure of the customer's commitment to a brand, and it is considered the core of brand equity (Aaker, 1991:44). Oliver (1997, cited inPappu et al., 2005:145) followed the behavioural approach. He defined brand loyalty as: "a deeply held commitment to rebuy or repatronise a preferred product or service consistently in the future, despite situational influences and marketing efforts having the potential to cause switching behaviour". Yoo and Donthu (2001:3) study refers to the brand loyalty as "the tendency to be loyal to a focal brand, which is demonstrated by the intention to buy the brand as a primary choice." According to Solomon et al. (2006:289), a brand loyalty means that consumer is actively (sometimes even passionately) involved with a favourite brand. Brand loyalty represents one of the main drivers of brand equity (e.g.Yoo et al., 2000; Atilgan et al., 2005; Yasin et al., 2007, cited inBuil et al., 2013:64).
Consistent with Yoo et al. (2000:201) CBBE model, this study employs a separate construct, overall brand equity, which was designed to measure the incremental value of the focal brand due to the brand name. As emphasized earlier, brand awareness is a predecessor for brand equity since consumers must be aware of the brand existence in the first place. Furthermore, overall brand equity depends on perceived quality since it is crucial to develop a positive evaluation of the brand in consumers' memories (Farquhar, 1989:29). The higher perceived quality leads to higher brand equity (e.g. Yoo et al., 2000:205;Kim and Hyun, 2011:434,Buil et al., 2013:64). However, some researchers consider brand awareness as a necessary but not sufficient condition to create value. Therefore, they propose that brand awareness has a positive, though indirect, influence on brand equity (e.g.Buil et al., 2013:64,Vukasović, 2016:262). Consequently, the following hypothesis were proposed:
H7. Multidimensional brand equity components a) brand awareness; b) brand associations; c) perceived quality, and d) brand loyalty has a significant positive effect on the overall brand equity.
3. RESEARCH METHODOLOGY
As intimated before, Yoo and Donthu (2001:14) developed a multidimensional brand equity scale (MBE), for CBBE measurement, with ten items and an additional unidimensional measure of overall brand equity (OBE) consisting of four items, intended for a convergent validity check of the MBE. The OBE instrument was operationalized similar to the brand loyalty construct (Tasci, 2021:171). Yoo and Donthu (2001) scale followed Aaker's four (primary) assets but proved a three-dimensional model (brand awareness and brand association combined in one dimension) as the best fit. These scales were adopted and validated empirically by Washburn and Plank (2002:48, 59), who provided results supporting this three-factor model in the context of co-branded products and suggested more discriminant indicators improve the measurement of CBBE. However, other evidence says that brand awareness and brand association are distinctive dimensions of brand equity (e.g. Sinha et al., 2000; Sinha and Pappu,1998, cited inPappu et al., 2005:144). Numerous researchers have successfully applied Yoo and Donthu (2001) compact fourteen items scale (e.g.Lökken et al., 2012:25,Ahmad and Sherwani, 2015:64). Consequently, it was translated and adapted for this research, including brand awareness and brand associations as separate dimensions.Figure 1. displays the conceptual model based on the associative relationships between CBBE dimensions (followingYou and Donthu, 2001:10) and the casual order perspective (followingBuil et al., 2013:64 andTasci, 2021:186) with brand loyalty as an outcome of brand equity. Furthermore, it involves the OBE construct designed by Yoo and Donthu (2001:11) for the MBE index's convergent validity.
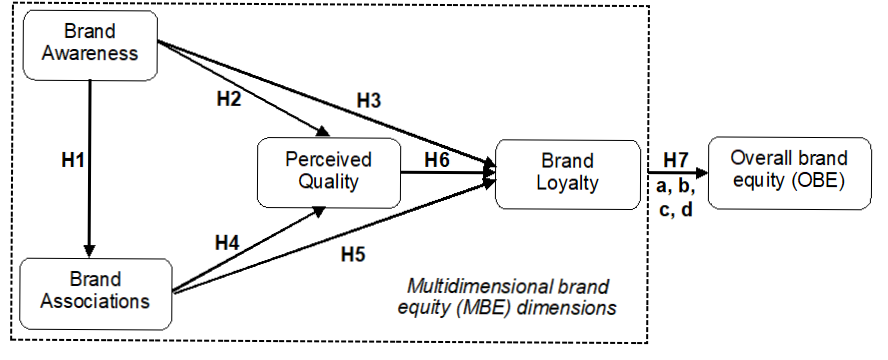
Source: Research; adapted from Yoo and Donthu (2001), Buil et al. (2013), and Tasci (2021)
This study was conducted by asking respondents to evaluate the specific constructs with regard to their most prefered brand (within the apparel and footwear product categories), rather than a set of pre-specified brands (similar approach as inChristodoulides et al., 2015:314). Each respondent's top three favourite brands were extracted separately from a list of 13 apparel and 11 footwear brands. The final questionnaire also included five demographic variables (sex, age, occupation, education level, and household income). A seven-grade continuous Likert scale (1 = totally disagree, to 7 = totally agree) was employed to measure brand equity constructs. The online survey was performed among college students who represent a suitable sample of young fashion consumers. The data collection took place between May 11th and June 05th, 2020, and produced 203 valid responses. The final sample included only 167 observations from the young respondent's age less than 30, as reported in Table 1.
Source: Research
The measurement scales were assessed for reliability via Cronbach (1979) coefficient (results of the analysis performed by the GNU PSPP Statistical Analysis Software inTable 2.).
| Concept | No. of items | Cronbach |
|---|---|---|
| Brand loyalty | 4 | 0.84 |
| Perceived quality | 2 | 0.84 |
| Brand awareness | 2 | 0.69 |
| Brand associations | 2 | 0.67 |
| Multidimensional brand equity (MBE) | 10 | 0.90 |
| Overall brand equity (OBE) | 4 | 0.84 |
Source: Research
The reliability analysis shows that the Cronbach alpha coefficient's value varies between 0.67 and 0.90 for each concept in the measurement instrument. The value of the Cronbach alpha coefficient for brand associations concept has to be calculated without the third reversely coded variable; however, it indicates an acceptable level of reliability2.
4. RESULTS
The statistical tool JASP (Version 0.14.1) JASP Team (2020,https://jasp-stats.org) was employed for descriptive and inferential statistical methods. ANOVA (for employment status) and t-test analyses (for other demographic characteristics) were performed to examine the differences regarding demographic variables, but no statistically significant results emerged.
Following the Yoo and Donthu (2001:11) analysis MBE index strongly correlates to a composite score computed from a simple sum of the mean scores of the brand equity dimensions. In this study, the MBE dimensions' composite score was 4.37 (or 61.37% of maximum grade). These results correspond with Yoo and Donthu (2001:10) score of 58.48% of the maximum grade for athletic shoes (four out of six brands matches in both studies). Comparatively, the mean values of MBE dimensions correspond, as well. Brand loyalty gained 47.39% of the maximum grade in this study, whereas Yoo and Donthu (2001:10) found 41.07%; perceived quality 70.74% versus 65.07% and brand awareness/brand associations (combined), 68.09% in this study versus 69.31% from Yoo and Donthu results.
The correlation analysis was performed to determine the variables' associative relationships (results inTable 3.).
| Variables | BL | PQ | BAW | BAS | MBE | OBE |
|---|---|---|---|---|---|---|
| BL | 1.0 | |||||
| PQ | 0.603*** | 1.0 | ||||
| BAW | 0.684*** | 0.656*** | 1.0 | |||
| BAS | 0.471*** | 0.518*** | 0.659*** | 1.0 | ||
| MBE | 0.881*** | 0.787*** | 0.877*** | 0.744*** | 1.0 | |
| OBE | 0.601*** | 0.574*** | 0.636*** | 0.495*** | 0.675*** | 1.0 |
Source: Research
Notes: BL = Brand Loyalty; PQ = Perceived Quality; BAW = Brand Awareness; BAS = Brand Associations; MBE = Multidimensional Brand Index; OBE = Overall Brand Index; *** All correlations are significant at p < .001
The results inTable 3. indicate that brand loyalty and brand awareness serve as the essential MBE index dimensions, followed by perceived quality and brand associations. Similar relations were determined considering the OBE index. Medium level of correlation coefficient (0.675 at p < 0,001) corroborates the Yoo and Donthu (2001:11) conceptualization of the OBE index for a convergent validity check of the MBE index (correlation coefficient were from 0.59 to 0.63 at p < 0.0001 in Yoo and Donthu study).
Apart from associative relationship check, this study aimed to examine the causal relations among the original Aaker's consumer-based brand equity dimensions (i.e. MBE index). Keller's customer-based brand equity pyramid (2001:7) set the path toward causal relationship investigation (although with different brand equity dimensions focus). This kind of relationship attracted less interest from scholars (e.g.Yoo and Donthu, 2001:12,Vázquez et al., 2002:40,Buil et al., 2013:64,Girrard et al., 2017:44).
The regression analysis was employed to determine the variables' causal relations (results inTable 4.). The representativeness requirement of the multiple regression analysis was verified via distribution normality analysis. The results pointed out that all skewness coefficients range between -1.091 and 0.322, i.e. within acceptable referential limits for normal distribution. The values of the kurtosis coefficient are within the +/- 1 range.
Source: Research
Notes: OBE = Overall Brand Index; Sig.=significance; *** significance level at p < 0.001; ** significance level at p < 0.01; * significance level at p < 0.05
Examination of causal relations followed the model of CBBE with the most commonly used components and relations suggested by Tasci meta-analysis (2021:186), which consider brand loyalty as an outcome of brand equity. These relations were assumed with the first six hypotheses. The regression analysis results confirmed all hypotheses, except H5, i.e. that "brand associations has a significant positive effect on brand loyalty", which has to be rejected. The regression model demonstrated a high 'R' value (0.956), so there is a very high (strong) positive relationship between predictor variables (perceived quality, brand awareness and brand associations) and regressand (brand loyalty). The determination coefficient value (R2 = 0.915) indicates that 91.5% of brand equity variance can be predicted (explained) with independent variables. Furthermore, ANOVA analysis confirmed that the results are statistically significant, F(3, 164) = 586.865, at p < 0.001.3
Following the Yoo and Donthu (2001:11) and partly Buil et al. (2013:64) approach, the MBE components were tested as a predictor of an OBE construct. Multiple regression analysis confirmed all hypotheses, except H7b, that "brand associations have a significant effect on overall brand equity (OBE)." Consequently, hypothesis H7b have to be rejected. Multiple regression analysis included a model with perceived quality, brand awareness, brand associations and brand loyalty as predictors of overall brand equity (OBE). The regression model demonstrated an 'R' value of 0.960 and a very high (strong) positive relationship between predictors and regressand (OBE). The determination coefficient value (R2 = 0.922) indicates that 92.2% of brand equity variance can be predicted (explained) with independent variables. Furthermore, ANOVA analysis confirmed that the results are statistically significant, F(3, 164) = 479.113, at p < 0.001.
5. DISCUSSION
This study attempted to corroborate distinct yet compatible brand equity perspectives of Yoo and Donthu (2001), Buil et al. (2013) and Tasci (2021) four dimensions CBBE model. These perspectives explored associative and causal relationships among the original Aaker's (1991) four CBBE dimensions. By utilizing the 14-item Yoo and Donthu (2001:12) measurement instrument and correlation analysis, this study determined the associative relations between all multidimensional brand equity components (MBE).
The examination of the causal effects implied that brand awareness leads to a positive effect on perceived quality and brand associations, brand associations enhance perceived quality, while perceived quality has a significant and positive effect on brand loyalty. These findings are consistent with previous studies (e.g.Yoo et al., 2000:205;Su, 2016:475,Su and Chang 2018:97). However, the confirmation of causal effect between brand associations (as a separate dimension in a four-component CBBE model) and brand loyalty as an outcome of brand equity (following theBuil et al., 2013,Pappu et al., 2005, andTasci, 2021 approach) missed out. Probably, the low reliability of the brand associations part of the measurement scale (despite the item's exemption: "I have difficulty imagining my favourite brand in my mind") caused that brand associations do not affect the strength of brand equity, as found previously by various authors (e.g. Bridges et al., 2000, Ye and van Raaij, 2004; Pappu and Quester, 2006; Tong and Hawley, 2009; Kumar et al., 2013, cited inAhmad and Sherwani, 2015:62). It also implies that a more appropriate measure of brand associations should be applied to separately analyze the influence of brand awareness and brand associations concept.
This research also found positive causal relationships among three brand equity dimensions (perceived quality, brand loyalty and brand awareness) and the OBE index (the regression coefficient vary between 0.248 and 0.279, all statistically significant at p < 0.01). The relation between brand associations and brand loyalty was found non-significant. Consequently, the convergent validity check of the MBE index, confirmed via correlation analysis, was not repeated by regression analysis results.
Additionally, these results are comparable to studies conducted in similar industries. Buil et al. (2013:68) studied six brands in three categories (including shoes) and determined statistically significant low to high causal relations (from 0.083 to 0.704) among brand awareness, perceived quality, and brand associations (with three sub-dimensions), brand associations and brand loyalty, as well as between perceived quality, brand association and brand loyalty and overall brand equity (OBE). However, the existence of a causal relationship between perceived quality and brand loyalty was omitted. Comparatively, Vukasović (2016:262) tested Croatian and Slovenian food consumers and found no causal relationship between perceived quality and brand loyalty. The values of comparable coefficients among other brand equity dimensions and OBE index were established between 0.053 and 0.709 (statistically significant).
6. CONCLUDING REMARKS
The components (and sub-components) of the CBBE model varies considerably between researchers within the brand equity field, although the majority rely on Aaker's (1991) and Keller's (1993) conceptualizations. Consequently, various measurement scales were tested and (re)validated. However, various research instrument and models' application caused a deficiency in comparison opportunities and further application among scholars and practitioners. The lack of reliability for measuring the brand associations concept in this research might further improve the Yoo and Donthu based scales.
This study contributed to the CBBE model's research with the most commonly used (four) components and the proposed causal relations by the comprehensive, contemporary meta-analysis results (Tasci, 2021). The research results confirmed the causal relations between brand awareness, perceived quality and brand loyalty, and brand associations and perceived quality. These results also indicate the possible practitioners' path, e.g., enhancing promotion, storytelling, or referral programs, may lead to broader brand awareness and, consequently, improve organizational (brand) associations. Superior brand associations precede favourable brand quality perceptions, and finally, more brand loyalty from the consumers. These conclusions may be helpful to marketers in the youth fashion market but presumably, quickly transferred to other retail markets.
Limitations of the current study refer to the student sample, which prevents generalization of the results on actual consumers. Future research might consider the more consistent implementation of already widely adopted Aaker's (1991) and Keller's (1993) conceptualizations to achieve a similar level of accordance in the CBBE measurement instrument. The other suggestions for future research involve replicating the current study with actual young consumers and steering more attention to the fast fashion market.