
1. INTRODUCTION
R&D activities have a key role in enhancing the ability of a certain country to achieve economic growth and development. Resources that countries allocate to R&D are scarce and therefore should be used as efficient as possible. In order to achieve competitive advantage, efficiency and productivity of R&D operation is acquired (Werner and Souder, 1997). Although some empirical studies argue that expenditures on R&D have an immediate positive impact on current operating performance (Apergis and Sorros, 2014), while other studies argue that benefits can be visible in the long run (Gumus and Celikay, 2015;Ravšelj and Aristovnik, 2020), general opinion is that expenditures on R&D positively affect modern businesses and economic growth. One of the most important components of economic growth is technological development and therefore efficiency of R&D operations is crucial for companies, institutions and countries to be competitive and to contribute to economic growth. That is why barriers to entry market should be more relaxed because due to research results of Cullmann, Schmidt-Ehmcke snd Petra Zloczysti (2009), they negatively affect market by reducing competition, lowering research efficiency and reducing the incentive for efficient innovation and allocation of resources. In addition, there is a positive relationship between innovation and migration inflows since workers from different cultural background possess different knowledge and capabilities. (Aldieri, Kotsemir, and Vinci (2020),Niebuhr (2010)). Since governments and their regulation play a key role in R&D activity of every country, they have to re-evaluate their regulatory environment.
Importance of education and technology is constantly growing, especially nowadays when global pandemic took it to a new level. In the world where many businesses, including schools and universities, “overnight” started to operate in on-line environment and where huge amount of finances turned forward researches dealing with COVID 19, efficiency in area of technology and researches became even more important. Although R&D activities have been recognized as an important factor for economic development, publications dealing with this subject are limited. Different methods are used to asses R&D efficiency, but since most of them cannot deal with multiple outputs, DEA has been imposed as an appropriate technique. In addition, most researches approach the problem from company or industry level. There are not many papers that attempted to evaluate R&D efficiency or productivity on national level. However, this aspect is crucial to obtain policy implications that can be used in designing policy for specific country.
Different studies of R&D efficiency usually use expenditures on R&D and number of R&D personnel for inputs and number of patents as output variable (Werner and Souder, 1997). Choi and Hwang (2014) consider patents to be fundamental indicators of technology development efficiency. Since patents on its on cannot be considered to be the sole output, different types of output should be included in a research (Tsai, 1995). Building on it, Park (2015) accentuated that output that is intellectually property-related, include both, patents and publications. Chen, Hu and Yang (2011) highlighted the existence of different composition within every nations R&D. In such a way, private sector R&D, especially if funded by either foreign sources or by private businesses, plays a crucial role in improving scores of efficiency index in area of R&D that is patent oriented. On the other hand, journal-oriented (publication or article) R&D efficiency index is highly affected by performance of higher education institutions since their main objective is the publication of more academic papers.
Lee and Park (2005) identified characteristics of 27 Asian countries with respect to R&D efficiency. They created multiple R&D DEA models, one basic that includes all inputs and outputs and five additional that combine one input with all outputs and one output with all inputs. This allowed them to identify R&D characteristics of each of observed country. Wang and Huang (2007) evaluated relative efficiency of R&D activities across different countries. They suggested a model that measures overall R&D containing patents as well as academic publications as output variables. Research results indicate that more than one-half of the countries are not efficient in R&D activities. In addition, most of observed countries performed better in producing academic publications than in generating patents. Aristovnik (2012) evaluated relative efficiency of public education and R&D expenditures in selected EU and OECD countries. Research findings indicate that, generally, less efficient, especially in R&D sector, are emerging market economies in the EU and OECD regions. This results support later research of the same author (Aristovnik, 2014) where relative efficiency of the R&D sector in the EU-27 is measured at the regional level. Regions from Netherlands, Germany and Austria showed highest relative efficiency opposed to regions from the Baltics, Eastern and Southern Europe where extremely low rate of knowledge production and efficiency is found. Kou, Zhang, Zhang, et al (2019) research was focused on influence of gender structure on R&D efficiency in China. They used four types of R&D outputs (papers, books, patents and standards). This R&D outputs are used together as well as individually in order to measure R&D efficiency based on gender structure. They used the multi-output stochastic frontier analysis and in general, when all four R&D outputs are considered jointly, R&D efficiency is higher when there is higher proportion of male R&D personnel. Despite that, when measuring R&D outputs individually, in case of papers and books, the higher proportion of female R&D personnel is positively related with higher R&D efficiency. When R&D efficiency is evaluated individually for patents and standards as R&D outputs, higher proportion of male personnel leads to higher R&D efficiency. Dobrzanski (2020) analysed the efficiency of spending on R&D in Latin America region and research results indicate that, higher spending on R&D in observed countries does not generate a proportional increase in innovative results. In addition, results show that more efficient countries in using resources are small, higher developed countries.
In this paper, relative R&D efficiency is measured at the level of 34 European countries (Austria, Belgium, Bulgaria, Croatia, Cyprus, Czech Republic, Denmark, Estonia, Finland, France, Germany, Greece, Hungary, Iceland, Ireland, Italy, Latvia, Lithuania, Luxembourg, Malta, Netherlands, North Macedonia, Norway, Poland, Portugal, Romania, Serbia, Slovakia, Slovenia, Spain, Sweden, Switzerland, Turkey and United Kingdom). Additionally, to define sources of (in)efficiency, two additional specialized models are presented – patent and article oriented models that serve as a base for stage two where specialized clusters of countries depending of their orientation are created. Furthermore, evaluation of R&D efficiency and its understanding and application is important for decision-makers in improving resource allocation and designing R&D policies. The aim of this paper is to evaluate relative R&D efficiency of selected European countries and group them based on their efficiency results to assess their R&D orientation in order to provide information to policy makers.
This paper contains 5 sections. After the Introduction, where in addition to presenting the aim of this paper, literature on efficiency evaluation in R&D is reviewed, the rest of the paper is organized as follows; Section 2 presents used methodology, i.e. data envelopment analysis (DEA) and cluster analysis, while Section 3 focuses on the model specification and data selection. Section 4 contain empirical research results from the two-stage approach. Section 5 concludes the paper.
2. METHODOLOGY
This study is conducted in two stages. In stage 1, DEA is used in order to evaluate relative R&D efficiency of 34 European countries. Additionally, DEA is used not only for overall R&D model, but also for two specific R&D models – patent oriented and article oriented. The results of the relative efficiency of the specialized models were used as the input of the next stage. In stage 2, cluster analysis is used to group countries based on their patent and article relative efficiency results.
2.1. Data envelopment analysis
DEA is a linear programming method that is originally presented by Charnes, Cooper and Rhodes (1978) based on production function estimation. It is used for evaluation of relative efficiency of homogeneous decision making units (DMUs). For every single DMU ratio between weighted inputs and weighted outputs is calculated. Result can vary between 0 and 1 where = 1 indicates 100% of relative efficiency, while result lower than 1 (0 < 1) indicates relatively inefficient operation. DMUs that are find to be relatively inefficient are compared to the efficient ones. Efficiency frontier is also known as the best practice frontier. DMUs that are relatively efficient are positioned on a frontier and are unable to increase any output, without at the same time increasing any of their inputs or reducing any of the outputs remaining and vice versa, are unable to reduce any input, without at the same time reducing any of the outputs or increasing any of the inputs remaining. One of the main advantage of DEA is the capability of handling both, multiple inputs as well as multiple outputs. However, its main downside is sensitivity to variable selection. Any increase in number of inputs or outputs results in more DMUs positioned on efficiency frontier. With careful selection of only crucial variables, this limitation can be overcome.
There are two basic DEA models, CCR and BCC model. CCR model (Charnes, Cooper and Rhodes, 1978) is basic DEA model that assumes constant returns to scale (CRS) opposed to BCC model (Banker, Charnes and Cooper, 1984) that assumes variable returns to scale (VRS). While CRS implies that for each DMU, increase of each input causes proportional increase of each output, VRS implies that this connection does not necessary has to be proportional. Additionally, when building a model, beside returns to scale, model orientation should be chosen. There are input and output orientation in DEA models and selection depends on the goals of observed set of evaluated DMUs.
Although, DEA is originally developed for relative efficiency evaluation of DMUs from public sector, its application has soon been extended also in non-public sector because it can accommodate multiple inputs and outputs that are expressed in different units.. Nowadays, DEA application can be found in efficiency evaluation in healthcare (Dukić Samaržija, Arbula Blecich and Najdek (2018),Ozcan (2017), education (Arbula (2012),Arbula Blecich (2020),Arbula Blecich and Tomas Žiković (2016),Sîrbu, Cimpoieş and Racul, (2016), R&D (Dočekalová and Bočková (2013),Lee and Park (2005), banking industry (Tuškan and Stojanović, 2016) and many other areas.
Since in this paper output oriented BCC (VRS) model is used, it can be expressed as follows (Zhu, 2009, p. 15):
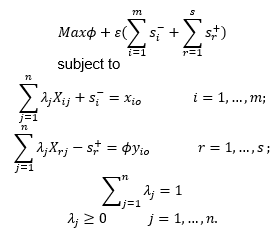
Where X_ij is ith input from jth DMU, X_rj is rth output produced by jth DMU and s_i^- and s_r^+ are inputs and outputs slacks. Output efficiency is defined with the value ϕ and the DMU is efficient if if and only if ϕ = 1 and s_i^- and s_r^+ =0 for all i and r.
2.2. Cluster analysis
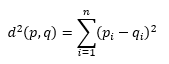
Cluster analysis is a multivariate statistical method that is used to group a sample of subjects based on a set of different variables in a way that similar subjects are members of the same group. In this study, countries are subjects and are grouped based on relative efficiency results of two specialised R&D models (patent and article oriented). After subject and variable selection, distance measure or measure of similarity has to be defined. Several different methods calculate the similarity or distance between the vector x=(x1,x2,...xp) and the vector y=(y1,y2,...yp). Squared Euclidean distance is frequently used distance measure in cluster analysis that can be expressed as follows:
Hierarchical methods treat every data point individually as a separate cluster. Agglomerative hierarchical method starts with individual objects as initial clusters and with each subsequent step merges two nearest clusters (bottom-up approach). Opposite to this method is divisive hierarchical method where all observations are at first contained in one cluster and with each subsequent step are split recursively (top-down approach). Given the nature of the research, this study uses hierarchical agglomerative method to form different R&D clusters from efficiency results of individual subjects. Starting point in this method are individual subjects (DMUs) that are treated as the initial individual clusters. In each step that follows, two clusters that are the closest connect. Connecting continues until the stop criteria is reached (Kaufman, Rousseeuw, 1990, 2005). In the paper hierarchical agglomerative clustering is conducted based on Ward's linkage method. At the beginning of the process, mean for each variable of each cluster is calculated. After that, calculation of the squared Euclidean distance to the arithmetic mean of each cluster for each subject is being made. After that, for all cluster members, the distances sum up. The clusters form in a way that clusters merge when their overall sum of deviation is the smallest. Process of cluster analysis can be shown through dendrogram. Main advantages of hierarchical cluster analysis is that it is easy to implement and it can be widely used in different scientific areas, number of clusters that is required for the algorithm does not have to be specified and result of this analysis is dendrogram that is useful in understanding data and process of analysis. Limitations of this method are that it cannot deal with missing data, it does not work well with different data types as well as on data sets that are very large.
3. EMPIRICAL DATA
In accordance with relevant literature (Cullman, Schmidt – Ehmcke and Zloczysti, 2009;Lee and Park, 2005;Hall et al., 1986), since investments in R&D do not have immediate effect on R&D output, lag structure on inputs is used. Previous studies in generally agree that, between R&D inputs and outputs, there is a lag of three-to-five years (Lee and Park, 2005;Acs and Audretsch, 1991) wherefore in this paper inputs are averaged for the period from 2015 to 2018. Accordingly, for outputs data form 2019 is used. In analysis, for evaluation of relative efficiency is used software DEA Solver Pro 11.0, while for cluster analysis is used Stata I/C 15.0.
Three R&D models are presented (Overall model and two specialized models – the article oriented model and the patent oriented model) that provide insight into strengths and weaknesses of each observed country with respect to obtained R&D relative efficiency results. In R&D models, two input and four output variables are used that vary depending on model specifics. Combination of input and output variables for each model are presented inTable 1.
Source: Authors’ calculation
Input variables are collected via Eurostat. GERD (Gross domestic expenditure on R&D in mil. EUR) represents aggregate R&D for a certain country. Total R&D personnel is measured in full time equivalent (FTE). Patent application (number of patent application by country of origin) and patent granted (patent granted by country of origin) are output variables collected from European patent office, while citable documents (citable documents include articles, reviews and conference papers) and citations (All period country citations to documents published in 2019) are collected from Scimago Journal & Country Rank. Statistics for input and output variables is presented inTable 2.
Source: Authors’ calculation
When using DEA, it is important that all input and output variables have non-negative values. In addition, during the selection of appropriate inputs and outputs, positive correlation is mandatory. Input and output correlations are presented in Table 3.
Source: Authors’ calculation
Previous table shows presence of high positive correlation among all input and output variables. In DEA, highly correlated variables are common. Dyson et al. (2001), Ramirez Hassan (2008) argue that omission of highly correlated relevant variables can cause inconsistency of efficiency estimates of some DMUs. After selecting inputs and outputs, it is necessary to define an appropriate DEA model.
4. RESULTS AND DISCUSSION
Since analysis is conducted in 2 phases, results and discussion will also be presented in 2 phases that follow the research process.
4.1. DEA R&D relative efficiency results
In selecting appropriate model in section 3, orientation and returns to scale have to be specified. Model orientation is selected based on specific DMU goals. In this paper output orientation is selected. Output-oriented approach is generally more appropriate when estimating R&D efficiency because countries tend to maximize their R&D outputs with disposable inputs. Beside orientation, in model selection appropriate returns to scale have to be chosen. The CCR model assumes constant returns to scale (CRS), while the BCC model assumes variable returns to scale (VRS). To decide what model is appropriate, data for Overall, Article oriented and Patent oriented models is tested with both, CCR and BCC models. Comparison of the results of CCR (CRS) – output-oriented and BCC (VRS) – output-oriented models is presented in following table. Results show substantial differences for all three tested models.
| Overall | Article oriented | Patent oriented | ||||
|---|---|---|---|---|---|---|
| CCR-O | BCC-O | CCR-O | BCC-O | CCR-O | BCC-O | |
| No of efficient DMUs | 4 | 14 | 1 | 10 | 3 | 6 |
| No of inefficient DMUs | 30 | 20 | 33 | 24 | 31 | 28 |
| Average efficiency | 0.5115 | 0.8838 | 0.3608 | 0.8472 | 0.3142 | 0.4612 |
Source: Authors’ calculation
Results for all three models show considerably higher average results with BCC than with CCR models. Additionally, the number of efficient DMUs with the BCC model for all three tested models is considerably larger than with the CCR model. Results indicate that VRS are present in R&D in selected European countries. Consequently, use of BCC model is recommended.
Source: Authors’ calculation
If only overall model was observed, specific characteristics of different countries regarding article and patent orientation would not be revealed. Countries that achieved θ = 1 (100% relative efficiency) where θ indicates the level of efficiency are relatively efficient while countries where 0 ≤ θ < 1 are inefficient. It can be noticed that some countries are ranked relatively efficient in overall model, but are ranked inefficient in one or even all both model orientation. Likewise, Italy is evaluated to be relatively inefficient in both, article and patent orientation, but based on overall model is relatively efficient. It is due to new combination of inputs and outputs that form the new frontier of relative efficiency. These results confirm that analysis has to be carried out on each model orientation separately to provide results that are more accurate and detail.
4.2. Cluster analysis based on specific R&D relative efficiency results
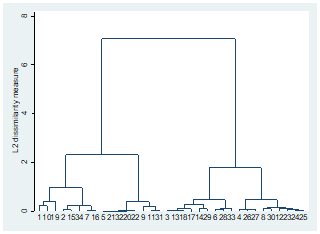
In the second stage of the analysis, cluster analysis is conducted in order to group different countries based on relative R&D efficiency results. Thus, strengths and weaknesses of countries will be revealed based on their R&D specialization. Results of relative efficiency obtained from specialized models (patent and article oriented) serve as an input for cluster analysis. This way, it is possible to separate groups of countries depending on their R&D orientation. To identify clusters, Ward’s hierarchical clustering method is used to calculate the mean of each variable for each cluster. Cluster distances to the mean of the cluster are defined to be the squared Euclidean distance between countries. The process of successive clustering based on similarity of data is presented on the dendrogram below. On x-axis are countries (DMUs), and on the y-axis are distances.
Three clusters are identified based on results of relative efficiency of article and patent oriented R&D. Characteristics and member of clusters are presented inTable 6. Cluster 1 has 8, cluster 2 8 and cluster 3 18 members. Cluster 1 contains countries that are relatively in the middle according to patent orientation (mean = .6213625) and relatively least efficient according to article orientation (mean = .7882). In cluster 2 are positioned countries that are relatively most efficient in both, article orientation (mean = .9509125) and in patent orientation (mean = .9829875). Cluster 3 encompasses countries that are slightly more efficient in article orientation than countries positioned in cluster 1 and slightly less than countries positioned in cluster 2 (mean = .8472412), but are relatively least efficient in patent orientation (mean = .0741412).
Source: Authors’ calculation
Note: ***, **, * denote significance at the 1%, 5% and 10% significance level.
Since data do not follow the normal distribution, nonparametric Kruskal–Wallis test (K-W) is used to determine whether there are differences between mean ranks of the clusters for both specific R&D orientations. K-W is used when we want to compare more than two groups. Based on the results, we can conclude that there is a significant difference between all three clusters for, patent oriented efficiency results, while for article oriented efficiency results this cannot be stated on 10% significance level because p value is slightly over that value. The results are opposite to research of Chen, Hu and Yang (2011) that found that different nations have similar level of R&D efficiency when it comes to patents, while for journal publications their performance is quite different. After K-W nonparametric test, post hoc Dunn’s pairwise comparison test is used to accurately determine which specific group means are significantly different from the others. Dunn’s test confirms significant difference between all clusters pairwise for patent oriented efficiency. For Article oriented efficiency, if we take results into consideration, since p value is on 10% mark, there is significant difference between cluster 1 and 2 as well as between cluster 1 and 3, but between cluster 2 and 3 we cannot confirm that there is significant difference. Countries positioned in cluster 2 and 3 have similar mean rank for patent orientation and they differ among themselves in article orientation that is significantly higher for countries in cluster 3. Cluster 1 has significantly higher results than cluster 2 in both, patent and article orientation, while in comparison with cluster 3 has significantly higher results for patent orientation and significantly lower results for article orientation. Above mentioned can be presented in form of box plot graph.
Source: Author
Results presented show us that countries are more focused on article publication, rather on patent application and patent granted that is also discussed by Wang and Huang (2006). This is even more pronounced when observing mean rank of relative efficiency results of three clusters (article orientation - mean = .8472412); patent orientation - mean = .4611618). Although cluster 1 is relatively least efficient in article orientation (mean = .7882) its efficiency score is not that low compared to other two clusters (cluster 2 – mean =.9509125; cluster 3 – mean = .8274056). Regarding patent orientation, cluster 2 is most efficient (mean = .9829875) compared to cluster 1 (mean = .6213625) and cluster 3 (mean = .1580389). These results should point out how more attention needs to be focused on patents, especially in countries ranked in cluster 3. Patents (application and granted) are among main R&D outputs and countries should make effort in this direction since previous research indicate that investment in R&D positively affects economic growth.
5. CONCLUSIONS
One of the indicators that reveals the competitiveness of a certain country is level of investments in R&D. Nevertheless, not only high level of investment is important, but its efficient usage. R&D resources are limited and, in order to use their full potential in boosting economic growth, they have to be used efficiently, especially nowadays when world is faced with global pandemic. Pandemic pushed educational, technical and research limits worldwide to a new level and forced countries, as well as private and public businesses to find new ways of operation.
This paper uses DEA to evaluate relative R&D efficiency in European countries. In addition to the overall DEA model that includes two inputs and four outputs, two additional R&D specialized models are presented – patent oriented and article oriented. This models share inputs (GERD and researchers), but based on their specialization, they have different outputs. For patent oriented model outputs are patent applications and patent granted, while for article oriented model they are citable documents and citations. In line with previous research, since the effect that investments in R&D have on R&D output is not immediate, lag structure on inputs is used. The empirical analysis is conducted in two stages. In stage 1, DEA is used in order to get R&D efficiency results for 34 countries. In addition to overall model, with two specialized models, relative efficiency results are also presented. In second stage cluster analysis is carried out to group countries based on their relative efficiency results of specialized models. Three different clusters are identified from which the countries' R&D orientation based on their relative efficiency results can be identified.
The research results reveal that, in general, countries are more efficient in article publishing rather than patent granted and application that is in line with research results of Wang and Huang (2006). Countries can be divided in tree groups. Group 1 represents countries that are least efficient in article orientation (although their results are close to results of group 2 and 3) and better than group 3, but worse than group 2 in efficiency of patent orientation. Generally, this group contains Central and Western European countries. Group 2 represents countries that are most efficient in both orientation and contains mostly developed Scandinavian countries and countries from Western Europe with addition of Cyprus, Malta and North Macedonia. Group 3 have low patent efficiency results and in the same way relatively high article efficiency. This group contains mostly Baltic countries as well as countries from Central and Southern (Mediterranean countries) Europe that is, regarding patent orientation in line with Aristovnik (2014) since his model contain patent applications and high tech patent applications as output variables. Research results can help decision-makers to get insight into sources of inefficiency. Although results, especially for some members of group 3 (eg. Norway), are not in line with expectations, this paper deals with efficiency, not quality evaluation. Some of these countries deliver large output, but not large enough regarding resources used in output production.
However, this study has some limitations that should be addressed. When choosing inputs and outputs, quality of some data was unavailable. For example, citable documents are not divided based on quality of publication (indexation) because that kind of data was unavailable. Also, patent application and patent granted is available only as whole number, but monetary value of each patent or earnings arising from their application is not available. Other limitations derive from limitations of the methodology used. Sensitivity of efficiency results on selection of inputs and outputs, sensitivity of sample size as well as fact that results represent relative, not absolute efficiency are main limitations of DEA. Nevertheless, methodology limitations can be overcome by including only key inputs and outputs in the empirical analysis and by approaching to a specific problem consciously and carefully. Although applied to European country level, this model could be adapted to the needs of other countries as well as on regional or company level if implemented some adjustments. Future research should be directed towards finding ways to direct individual, company and country interest onto patent application and patent granted since this part of R&D is important for competiveness, as well as for economic growth, but based on research results, many countries underestimate its importance.
* This scientific article was created as a part of the project "MI - yesterday, today, tomorrow" (UP.04.2.1.06.0018) financially supported by the European union within the European social fund, and as a part of the project "Impact of Intangible Capital in Croatian Economy" [uniri-drustv-18-166] financially supported by the University of Rijeka.