
1. INTRODUCTION
There is a proven need for methods, techniques and tools that can store and search huge amounts of data, identify patterns among them and present them at the level of specific reports, representing an analytical process that results in new knowledge (Ćukušić, 2011). The term Sports Analytics, also referred to as Statistics in Sports, denotes various processes and solutions related to data collection and management, predictive modelling and algorithms that facilitate finding valuable data for decision-making in sports. As a scientific field, Sports Analytics deals with the collection and analysis of past and real-time data on sports in general (Sarlis, Tjortjis, 2020). Analytics, in one form or another, has always been a part of sports – general statistics, such as the results of matches, or the number of passes or goals, provide the basis for reporting on various sports competitions. Recently, the importance of statistics and analytics in sports has increased, with an emphasis on measures that improve the likelihood of winning or may provide an "advantage" over the competition that has not yet revealed the value of those measures. Today, data on physical location, frequency of injuries and measurement of physical performance, as well as business values, are also collected (Wasserman et al., 2018). Analytics is widely used by professional sports teams to improve their field results. It is less apparent that the same organisations use analytics to enhance their business performance as well. On that topic, a survey by Troilo et al. (2016) focusing on the level of adoption of business analytics in professional sports organisations found that the use of analytics resulted in significant revenue growth. This particular domain of sports analytics is closely connected to increasing the efficiency and relevance in business-related decision-making to which this paper aims to contribute.
The contribution that this paper brings in this regard is elaborated in section 2. In section 3, the theoretical basis for the identification of relevant factors in one specific area of research and use of sports analytics – basketball-related business decisions are presented in section 3, while section 4 describes the methodology of data collection and processing. In section 5, insights are presented and discussed. In the concluding section 6, limitations and future research directions are presented along with trends and the managerial implications.
2. RESEARCH BACKGROUND AND CONTRIBUTION
In recent years, the availability of data and the complexity of data management boosted the development of areas such as data science, business intelligence, business analytics, data mining (DM), and data-driven decision making. It caused the advent of novel technical solutions, such as the ones that tackle big data management and artificial intelligence, also in sports (Ratten, 2020). Further to that, a trend of widening access to stored data has gained momentum with the availability of open data. Published by various institutions and organisations, open data is free to use by governments, businesses and individuals that look for social, economic and environmental benefits (European Data Portal, n.d.). To use this data, good knowledge of DM and machine learning (ML) techniques is a prerequisite. Modern DM and ML algorithms used in sports analytics include (Sarlis, Tjortjis, 2020) neural networks (NN) used for classification and prediction purposes, decision trees for predictive modelling, probabilistic classifiers and so on. This paper aims to contribute to the growing number of studies focusing on the potential of DM in sports.
More specifically, the potential of sports analytics and DM is explored here in one particular domain. As a team sport, basketball requires a comprehensive analysis of a significant number of parameters not only to understand the game but also to analyse strategies and business-related decisions. The National Basketball Association (NBA) is considered the world's leading professional basketball league and one of the most popular sports leagues in general worldwide. Since the income of each team in the league depends on its performance in the regular season and playoffs and its players, the tools that can aid in performance tracking and value analysis are of paramount importance. One of the most critical factors for a team's success is the performance of individual players (Chen et al., 2017). Understandably so, to help manage the individual and team performances, the league has attracted the attention of a high number of researchers and practitioners. One of the papers addressing the performance prediction of sports teams provides a good overview of the growing body of literature dealing with performance in the NBA (Li et al., 2019). Studies that aim to determine the effect of analytics on the team and player evaluation also emerge, e.g., Sarlis and Tjortjis (2020) analyse the background and indicators used in basketball federations and Euroleague games. The study demonstrates that basketball analytics can be used to understand the game and team performance. Similarly, Li et al. (2019) propose an approach to predicting the performance of a team based on data envelopment analysis coupled with a data-driven approach. Specifically, they present the analysis in two steps: the multivariate regression analysis to examine the relationship between the probability of winning and the outcome of a game, and then using the historical data for the player portfolio performance analysis to optimally select players and plan their playing time. The three studies (Chen et al., 2017;Li et al. 2019;Sarlis, Tjortjis 2020) focus on players' characteristics in relation to decisions about their contracts that include significant financial provisions. However, the authors focus either on one particular aspect or use a single method to confirm their theses. For example, Paulauskas et al. (2018), focus on players' performance variables and detect variability in performance as an essential aspect that coaches and recruiters analyse. Oved et al. (2020) analyse interviews and enrich performance metrics by using text classification to uncover player behaviour and risk aversion.
However, this paper takes on a broader, exploratory approach, starting from collecting a dataset containing almost 50 attributes to employing the most common data mining methods for both classification and prediction with a view to promote their use for business value analysis in sports. In that regard, it complements the listed studies that focus on optimising individual or team sports performance, by focusing on the potential for supporting business-related decisions and performance in sports. Consequently, the primary goal is to identify relevant factors that can affect the decision-making process of NBA teams' contractual provisions. Here, relevant factors are the elements for which there is a representative value that proves the existence of a relationship between the contracted salary and the personal or performance characteristics of the players. The secondary focus stems from the primary; it involves examining deviations in the results in an attempt to analyse the direction of development of the league. In that, the effect of physical characteristics on individual performance, changes in player selection preferences in the NBA draft, changes in player selection and other trends are discussed.
3. SETTING THE RESEARCH DOMAIN: DEFINING BUSINESS VALUE IN BASKETBALL
NBA is a professional basketball association that manages a competition under the same name. The association has been operating since 1946 and is considered one of the largest sports associations in the world. The competition is open to 30 teams/franchises from across North America organised into two conferences (western and eastern) (NBA.com, n.d.). It is divided into regular and elimination parts where the regular part has 82 games. In the elimination part, 15 best-placed teams per conference are involved. The teams with four elimination matches won continue, and the final game is played between the winners of the conferences. This event is one of the most-watched sporting events in the world.
The average value of an NBA team/franchise is estimated at $2.12B (Badenhausen, 2020) with an increase of 14% over the same period last year. Up to February 2020, there was no decline in value for any of the teams/franchises. The Golden State Warriors franchise had the highest growth in value (23%), while the Brooklyn Nets had the lowest (6%). Depending on the result achieved in the current competition year, teams are assigned corresponding probabilities and the rights to select young players entering the NBA Draft. The worse a team's score is in the current competitive year, the more likely it is to achieve a higher preferential position when selecting players in the NBA Draft (NBA.com, n.d.).
The intricate details and rules of the selection, player exchanges and preferential positions, transfers of rights to future contracts with players and other strategic decisions are exceptionally complicated. Only fundamentals of the process are taken into account here to demonstrate the effects and the potential of DM in strategic decision-making. What is essential are the guaranteed salaries in professional contracts that teams are obliged to pay during the contract term under predefined stipulations for a limited period with the possibility of extension. Guaranteed salaries for the first 14 positions in the NBA Draft for 2019, to provide an insight into the level of importance of related salary guarantee decisions are available in (RealGm.com, 2019). These positions are the so-called lottery pick (NBA.com, 2020) representing a selection of players to which the team that won the elimination phase of the competition is not entitled unless it is allowed by a previously signed contract with a team that can exercise its right to select from the lottery pick in the observed year. When signing professional contracts with players, the team must ensure financial value for the payment of the contractual obligation within a predefined range. This financial framework is called the Salary Cap (Miller, 2018). It represents the ceiling on the contractual obligations of the teams plus the Luxury Tax (for cases where the upper limit of the range is exceeded). These provisions ensure the liquidity of the teams and fair play but also control the competitiveness of competition. As of 2017, the defined ceiling is a salary of $109.14 million. Teams' contractual obligations for the next five competition seasons are available in Basketball Reference Contracts (2019).
Strategy-wise, it is interesting to review the financial situation of the Philadelphia 76ers and the reasons for the high contractual obligations over a long period. Namely, under the slogan "Trust the Process", the team has been targeting poor results in the competition seasons for years to secure the options for high-ranking lottery picks in the draft. Consequently, by selecting the best young players, the club activated the then empty salary cap by signing those young players for an extended period and with high salaries to ensure the team achieved exceptional results in the future. The team's business strategy was under the scrutiny of the league's committees and possible future restrictions for such actions were considered but not imposed.
4. DATA COLLECTION AND METHODOLOGY
4.1. Data
The goals of the study have been presented in sections 1 and 2 already. In the data preparation phase, 22 datasets were identified as relevant and downloaded from different sources,kaggle.com,data.world,datahub.io,glassdoor.com, andbasketball-reference.com (listed inFigure 1). It was then integrated into a unique dataset that provides a relevant basis considering the study's purposes. After a series of data transformations, the set contains three different databases:
1. Statistics throughout an NBA career - averages and absolute values,
2. Time series of contracted salaries by players and teams, and
3. Time series and statistics by players - coefficients of efficiency and contributions to the results.

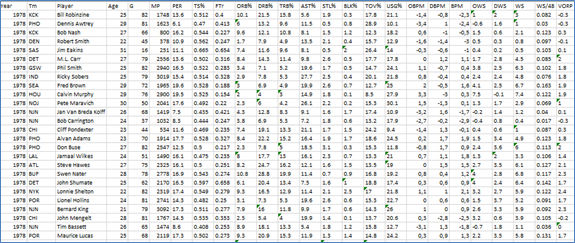
Following the transformations, the accuracy of individual data was verified through a random selection process. The accuracy of randomly selected rows was verified by comparing the corresponding score values with the values from the representative online data source for NBA statistics (Basketball Reference, n.d.). In the process, the success of data transformations, merging and calculations was confirmed, making sure there were no deviations or inconsistencies. The final data set contains a total of 793.581 observations. The list of some of the attributes contained in the first database with explanations (taken fromBasketball Reference Glossary, n.d.), where needed, is given inTable 1. The structure and the list of attributes in the second database are straightforward, pertaining only to players, their salaries in each season and the teams they played in. An excerpt of the third database is presented inFigure 2, while attributes are listed inTable 1.
Izvor: Autori
Source: Compiled by authors
4.2. Methods
Standard DM projects progress through the following phases (Ćukušić, 2011): determining the goal of the study, data preparation, data mining, and evaluation and use of the knowledge. This good practice was followed here, whereby for the third phase – DM, several methods were used, specifically correlation analysis, regression analysis, cluster analysis and neural networks. Specifics of the methods are presented in Section 5.
4.3. Data validity and restrictions
First insights pointed to some deviations in the data's representativeness as can be expected given this is a large dataset and the range of information it represents. Some of the variations can be excluded, having no statistical significance, while others are outliers, e.g.:
• Data without statistical value. In 2013/14 DeAndre Liggins played one game and spent one minute in the field during which he recorded one jump and one hit from one attempt (2 points scored for %FG=100). He thus logged the highest individual seasonal PER (129.1). To compare, Michael Jordan's highest PER is 31.7, and according to statistically significant data, it is still the highest PER in the league. DeAndre Liggins's PER (but also of some others) has no statistical value due to too few games and minutes played in the observed season.
• Outlier. The correlation between height and weight is +0.819 denoting a strong positive relationship. Correlation between weight and BMI index is +0.69 representing a medium-strong positive relationship; average BMI is 24.045. However, M.Bol with a height of 230 cm is the second tallest player in the history of the league, but with a weight of 91 kg, he has the lowest BMI index (16.98) in history. Another example is L.Orr, whose BMI index is 19.225 while his height is 203 cm. The difference between the two players' BMIs is 2.245, while the standard deviation of the population is 1.73.
For easier data management and to avoid contradictory conclusions, restrictions were set for including data into a statistically significant sample:
• Minimum number of matches played per observed season in the time series must be greater than 20 (G>20).
• Total number of games played in a career must be greater than 120, equivalent to 1.5 regular seasons (G>120).
• Effects on the team's results in terms of efficiency and result contribution coefficients are observed from 1979/80 onwards due to a lack of data used to calculate the coefficients:
o In 1973/74 the league started logging offensive jumps (ORB), stolen balls (STL) and blocked shots (BLK).
o In 1977/78 the league started logging lost balls (TOV).
o In 1979/80 a 3-point line was introduced (3FGA, %3FGA, 3FG, %3FG).
Based on the insights into the effects of physical characteristics of the players on the decision-making on contracted salaries and selection of players, no restrictive conditions were set.
5. RESULTS AND DISCUSSION
5.1. Correlation analysis
For the interpretation of correlation analysis, ranges as in Asuero et al. (2006) were taken as a reference: correlation 0.0-0.29 (non-existent); 0.3-0.49 (weak); 0.5-0.69 (medium-strong); 0.7-0.89 (strong); and 0.9-1 (very strong). Several relationships between the attributes were analysed and are presented hereinafter.
Correlation between physical characteristics of the players and salaries
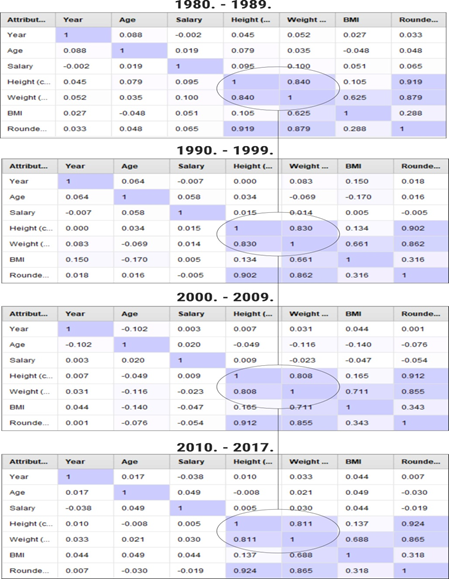
The results indicate that there is no correlation between the physical characteristics of the players and their salary. While some analyses (e.g.Lam, 2012;Groothuis, Hill, 2013) consider that height is a determining factor for how much a player is paid, recent ones that take into account longer periods demonstrate that the correlation has become non-existent as the game changed (Curcic, 2019). A gradual decline in the correlation between height and weight is observed in four different decades, with a slight increase recently (Figure 3). Although the correlation coefficient does not indicate massive changes, considering the size of the database and the number of observations, this may point to more significant changes. Specifically, the physicalities of the players are of paramount importance for their position on the field (shorter players play guard position, forward position is played by medium-height players, and centre by higher players) (cf.Xiong et al., 2017). It led to examining how the changes in the physicalities and related field positions may have affected players' contribution to results.
Source: Authors
The analysis of the relationship between the physical characteristics, field positions and the results further revealed that:
• Over time, there is a decrease in the correlation coefficients between the position of the player on the field and the results-related variables %DRB, %TRB, %AST, %STL. The most significant is the decrease in correlation between a player's position and the percentage of stolen balls (%STL) equal to 0.178, representing a relative change of 32%. This indicates a decline in the strict differentiation between the positions they play and their roles.
• Further, in the four decades, a significant increase in average body weight was found, increasing from an average of 93.56kg (1980-1989) to 99.51kg (2010-2017), equivalent to +6kg or 6.36%. It is a significant increase, considering that the players' average height for the same periods has not changed much. It demonstrates an increase in physical fitness in response to demandingness of the league.
• There were pronounced changes in player selection preferences in the draft, e.g. from 2000 to 2009, of the 30 lottery picks of the first three preferential positions, 20 selected young players were reported as power forwards and/or centre positions with a height listed as 205 cm or more. This makes up 66.67% of the selected players in the top positions. From 2010 to 2019, out of 30 lottery picks of the first three preferential positions, ten players reported positions of power forward and/or centre, 33.33% of the selected players in the top positions in the draft. There is a pronounced decline in the selection of players in centre positions from the highest preferential positions (-50%). Important to note is that four players in the observed years are highly versatile players meaning they can play both power forward/centre position and guard positions. Demonstrating this shift, is, e.g., a decision by the Houston Rockets in 2019 to play with the starting lineup without a standard centre position. Teams are less and less trusting of centre position players who dominate the physical aspect of the game under the basket and are more oriented towards players from outside positions. It leads to an analysis of the potentials and probabilities for introducing a 4-point throw line as of recently. That would significantly change the game and would represent the biggest change since introducing the 3-point line in 1979/80.
Correlation between players' contribution to results and salaries
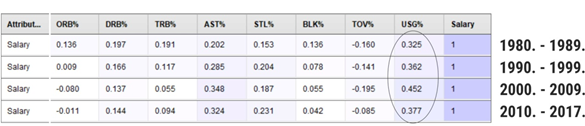
There is a weak to a medium-strong correlation between the salary and %USG (illustrated inFigure 4). Usage percentage defined as a mix of free throw attempts, field goal attempts and turnovers a player takes in relation to the amount of these the whole team takes, has been identified as one of the performance measures that somewhat affected the salary of NBA player already (Louivion, Pettersson, 2017). The correlation is more pronounced but still weak (0.452) from 2000 to 2009.
Source: Authors
Correlation between coefficients of efficiency and salaries
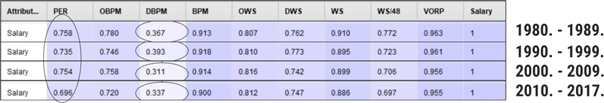
Correlations between coefficients of efficiency and salaries (Figure 5) can be observed over time; specifically, there is:
• a weak positive correlation between individual result contribution of a player for time spent on the field (defensive) and salaries;
• a strong positive correlation between Player Efficiency Rating, individual result contribution of a player for time spent on the field (offensive), offensive and defensive Win Shares, Win Shares Per 48 Minutes (WS/48) and salaries;
• a very strong correlation between individual result contribution of a player for time spent on the field (BPM), Win Shares (WS), Value Over Replacement Player (VORP) and salaries.
Source: Authors
Interestingly, the PER coefficient showing attacking efficiency has a weaker correlation with salary than some coefficients that take into account defense play. The DBPM coefficient is also weakly correlated to salary, indicating that the BPM coefficient may not be entirely suitable in defining key factors in defence play result contribution in relation to contracted salaries. In contrast, DWS being strongly correlated provides more precise insights into player-related defence performance contributing to results. One of the reasons can be the way the observed coefficients are calculated. Another surprising point is the strength of the correlation between the VORP coefficient and the salary, also analysed in a study by Wu et al. (2018). Several explanations can justify the strong correlation, one of which may be the team's decision to encourage a player who contributes more to the team than his predecessor to extend the contract for a longer period and for a higher salary to ensure long-term cooperation. The longer a player stays in the team, and his result contribution does not decrease, the VORP increases cumulatively with his contract's longer duration. Note that VORP is an upgrade of BPM (as discussed inMyers, 2020) which is also strongly correlated and so the observed result is logical. Therefore, there is no need for separate analysis of the effects of these two coefficients. Finally, when signing contracts with young players, the teams' policy is to offer them new deals after the first two years to ensure they stay with the team if he meets the criteria, this being characteristic for franchisees with high business value.
5.2. Linear regression analysis
By examining contracted salaries since the 1980s, it is evident that salary growth is continuous following the trend of economic changes in the market. Here, the aim is to find a regression model focusing on the effects of changing independent variables on contracted salary over four decades. An attempt is made to define the parameters that affect the contracted salaries over time by observing exclusively the coefficients of individual and result contribution that have proven to be a strong indicator of salary increase. Special attention is given to multicollinearity as some of the observed coefficients are derivatives (BPM -> VORP). The model contains PER and VORP coefficients. It is important to reiterate that only data for players who meet the set restrictions are considered to, e.g., avoid short 10-day contracts signed due to unexpected circumstances that could alter the results and lead to erroneous conclusions. The results are:
Salary (1980-1989) = 169.064,12 + 153.510,436*PER + 3.450.148,353*VORP
Salary (1990-1999) = 1.225.926,703 + 75.578,015*PER + 3.533.683,621*VORP
Salary (2000-2009) = 713.588,421 + 121.773,908*PER + 3.494.101,867*VORP
Salary (2010-2017) = 888.584,937 + 89.381,649*PER + 3.825.705,414*VORP
Several conclusions could be drawn:
• There is a large increase in the constant (base value) of the contracted salary in conditions when the value of the coefficients is zero. This sudden growth began in 1987 due to an increase in the Salary Cap (from 1987 to 1990 by 180%). It continued into the 1990s when it was 199% by the end of the decade. The teams started signing "lifetime" contracts with key players. The growth continued to this day but never again at such progressive rates.
• PER proves to be a volatile parameter for decisions related to salaries. It is less used due to the popularisation of other efficiency measures that include the player's defensive performance. PER accounts for all player's contributions using one number. Its peak is its beginning (1980s), but it remains a popular statistic for monitoring the attacking performance of players even though studies (Sigler, Compton, 2018) show it may be insignificant concerning salary.
• VORP as an indicator gains in importance. It has a very strong impact on the contracted salaries (as presented and discussed already). By all accounts, it is a very interesting coefficient of individual contribution with high statistical value, see e.g. (Sawant et al., 2019).
5.3. Cluster analysis
Cluster analysis was performed as a classification method to identify very good and extraordinary (all-stars) players in particular. This method has been used, e.g. in deliberations about new positions in the field differentiating between up to nine positions/clusters (Hussain, 2019;Kalman, Bosch, 2020) and to determine which NBA superstars are the most alike (Nibras, 2018). Standard k-means method was used with the number of clusters set to four, representing:
• below-average individual seasonal results,
• average and good individual seasonal results,
• very good and excellent individual seasonal results and
• extraordinary individual seasonal results.
The attributes used for classification into clusters were: contracted salary, PER, BPM, WS and VORP coefficients. Salary is presented as an average value per cluster for all players in a specific cluster. For more straightforward interpretation and understanding, the minimum, maximum and average values for the observed attributes of all players are presented inTable 2 (note that restrictive conditions presented above also apply).
| Atribute | Minimum | Maximum | Average |
|---|---|---|---|
| PER | 3 | 31.7 | 14.44 |
| BPM | -5.9 | 12.2 | -0.25 |
| WS | -1.6 | 21.2 | 3.687 |
| VORP | -2 | 12 | 1.006 |
| Salary | $600.000 | $36.700.000 | $5.927.939,82 |
Source: Authors
The results of clustering (Table 3) and the number of player seasons per clusters:
• Cluster 1 (below-average): 5.855 (54%),
• Cluster 2 (average and good): 2.419 (20%),
• Cluster 3 (very good and excellent): 1.885 (17%),
• Cluster 4 (extraordinary): 675 (9%).
Source: Authors
Surprisingly, as many as 54% of players whose data meet the restrictive conditions achieve below-average results. This percentage would have been even higher if the restrictions had not been set as it would have included players from the development league and players without permanent contracts. Since 1980, only 675 franchise player seasons have been achieved by individual players - the term franchise player stands for a key player that the whole franchise builds their game and business opportunities upon. Considering that most of these players achieve exceptional results over time (season after season), if the actual number of players who achieved this level of results were further examined, the number of franchise players would not exceed 100.
5.4. Predictive analysis using artificial neural network
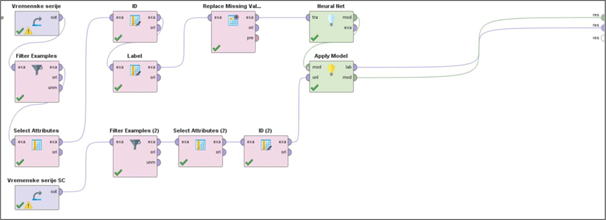
Predictive modelling is based on the results presented so far: the correlation between the players' salaries is the strongest with the coefficients of efficiency and individual contribution to results. The linear regression model directed the focus to main coefficients that affect the salaries meeting the conditions of statistical significance, but also the conditions of multicollinearity. In cluster analysis, four player groupings were formed based on their salary, coefficients of efficiency and contribution to results. Finally, the model based on NN algorithms seeks to determine the conditions for an increase or decrease in salaries for active players based on their performance contributions. NN feature is available in RapidMiner Studio with a basic setup for a deep learning artificial NN (Hai-Jew, 2018), providing a good environment for experimentation and salary prediction. The default settings were used (feed-forward neural network trained by a back-propagation algorithm) as described in RapidMiner Documentation (n.d.) In addition to the previously set restrictive conditions, to make the results more reliable and the decision-making potential of the model realistic, more criteria have been fixed:
• only active players are included in the analysis,
• only players from clusters 3 and 4 are included,
• individual result contribution is set starting from 2010,
• in addition to the attributes salaries, PER and VORP, the model takes into account other attributes such as Usage Percentage and True Shooting Percentage to reduce the effect of the VORP coefficient on the salary.
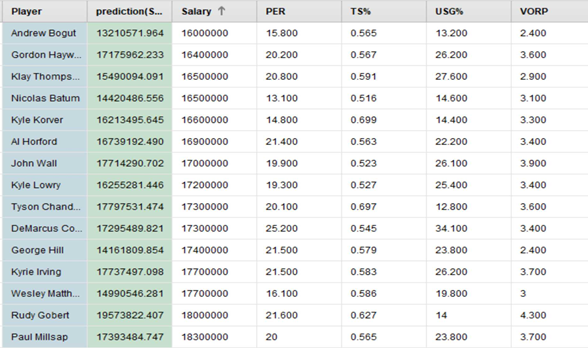
The DM model predicting the salary per player (illustrated inFigure 6) yielded some interesting results (excerpt inFigure 7). Out of the high-performing active players in clusters 3 and 4, the players with the highest recommended contract reduction are T.Allen (-1.5M$), B.Wright (-1.72M$), C.Parsons (-1.29M$), JR Smith (-3.28M$), J.Noah (-1.86M$), N.Batum (-2.08M$), G.Hill (-3.24M$), B.Griffin (-1.72M$), A.Bogut (-2.79M$), and W.Matthews (-2.71M$) among others. Interestingly, in the following seasons, they all achieved a significant decline in individual score contribution over the next few seasons. The prediction based on the NN algorithms to reduce contracted salaries proved to be accurate (supported by some popular sources, e.g.Nerkar, 2019).
The basketball player with the highest recommended cut is surprising – it is suggested that K.Durant's salary be reduced by $5.4M. The reason is that he was injured for a long time, so his contribution is 0. Consequently, the results cannot be considered statistically significant because the model does not reflect all relevant decision-making data as it lacks injury-related statistics. Players who were also recommended reduced salaries, but who did not achieve a decline in the following seasons are K.Leonard (-2.79M$) and R.Westbrook (-2.55M$). The reason for the recommendation is that the two players did not manage to achieve result contributions on par to their high salaries according to the model until 2014/15 (not including the observed season). R.Westbrook was mostly injured earlier in the season (similar to K.Durant), while K.Leonard only met the conditions for entering the cluster 4 (extraordinary players) in 2014/15 (his salary was as high as for players in cluster 4, yet his result contribution was sub-par). Some of the players with the highest recommended salary increase are K.Middleton (+2.04M$), M.Gortat (+2.29M$), R.Gobert (+1.57M$), J.Harden (+1M$), and G.Monroe (+1.9M$), among others. Looking at their performance, Middleton, Gobert, and Harden justified the recommended increase in salaries. After several good competitive seasons, Monroe achieved a sharp drop in the contribution to results, while Gortat, as a league veteran, made a good contribution to results for a short time, followed by a logical drop.
6. CONCLUSIONS
The study's primary aim was to showcase the potential of DM methods for identifying the key factors that may affect the decision-making process behind signing new or extending contracts with professional basketball players. As the compiled dataset was comprehensive, containing data from four decades, the analysis revealed several continuing trends that can also be of relevance to stakeholders in the basketball business, this being a secondary aim of the study. With these two aims in mind, standard research methods were employed, such as correlation analysis, linear regression modelling, k-means clustering, and NNs for prediction.
Positive correlations between the coefficients of efficiency of the players and the contributions to teams' results with contracted salaries were found albeit with different strengths of correlation. No significant relationship was found between players' physical characteristics and salaries, while weak positive correlations were observed with the attributes denoting contribution to results. In terms of physical characteristics, it is noteworthy that changes can be observed over time, and the highest-paid positions are not those typically dominated by highest players anymore. This, in turn, affects the preferences regarding the decisions about selection of new players, as well as the way the game takes place. PER and VORP proved to be the two main factors in the linear regression model. The effect of the PER coefficient on salaries decreases over time, while the effect of the VORP coefficient increases. VORP is also strongly correlated with salaries. Apart from the strong effect, VORP is characterised by stability, while the same cannot be confirmed for the PER coefficient. In terms of salaries, due attention has been given to a progressive increase in Salary Cap, particularly pronounced from the late 1980s to late 1990s. Particular groups from under-performing to over-performing players were then classified into four groups using cluster analysis using coefficients of efficiency and individual result contribution. This revealed that more than 50% of players achieve below-average results. In reality, the percentage is higher since restrictive conditions were set disregarding, e.g., development league players and players with short-term contracts. Apart from demonstrating the potential for player segmentation and classification, DM/deep learning algorithms for salary prediction were also presented. The NN algorithms predict future salaries for active players. Interesting discrepancies have been identified, especially for players with high-salary contracts where many do not meet high-performance requirements/standards. Still, the prediction model has an important shortcoming as it disregards player injuries and thus, cannot be used by sports managers and analysts as-is because the results can be skewed. Nevertheless, the prediction model proved to be accurate in estimating the decline in the result contribution of players approaching the end of their careers and younger players who just started their careers.
There are several other limitations to the study. It should be noted that conclusions about individual player results per season are not always easily quantifiable. For example, athlete B.Wallace is considered as one of the greatest defensive players of all times and the next Hall-of-Fame contender despite his average and/or very good individual career numbers (PER: 15.5; BPM: 2.5; WS: 6.23; VORP: 2.41). His contribution on the pitch and the general image of being a "driving force" (Paine, 2020) could not be comprehensively evaluated exclusively through statistics, also because the defense statistics inform coefficients like PER to al lesser degree. Consequently, future research should reconsider dividing players into categories of those who are more offensive- and those who are more defensive-oriented. Furthermore, to include more data in particular related to defense statistics, in-game player tracking data can be used to strengthen the conclusions related to individual differences and functional variability, as in Sampaio (2015). As mentioned already, important limitation relates to the NN algorithm used in this study that provides a good analytical environment for experimentation in terms of salary prediction, but only for those players who stayed healthy during observed seasons. The model cannot assume that some players had weaker results due to injury, and it can propose a significant wage drop which would be a wrong assumption. In future studies, injury-related data thus has to be taken into account. The algorithm also does not consider newly signed contracts for the same or new teams with apparent salary changes, "pulled-down or up" to player's older salary. It could assume that the player signed a new, improved contract for zero result progression, so these scenarios will have to be labelled in future studies.
In terms of implications of the study, and in line with the findings that the teams that employ analysts are more effective at scouting and compensating players (Huang, 2016), the paper provides an overview of the analytical process supported by data mining tools and possible research avenues. However, sports analysts and managers have to be aware that even with all the analyses, it is difficult to predict how a player's career will pan out (Weinberg, 2019). Yet, it is clear that there is considerable potential in using both the classification and prediction models based on NNs for salary-related decisions. Even with the set conditions and limited attributes selected, the open data served well the demonstrative purposes of this study.