
INTRODUCTION
Research and development (R&D) expenditures are currently often considered as one of the key drivers of economic growth and increasing productivity. Several studies found positive economic effects of R&D expenditure. From the macroeconomic point of view, most of the studies found evidence of the positive impact of R&D expenditure on economic growth[1][2][3] as well as on productivity[4][5]. Furthermore, innovation activities of enterprises are often considered as the key driver of technological change and long-term growth[6]. On contrary, the short-term effect on employment can be negative due to the potential substitution of labour for capital[7]. From the microeconomic point of view, business R&D expenditure, as well as other types of R&D expenditure, can act as the facilitator of business innovation, which is further reflected in better business economic performance and sustainability[8][9]. Innovativeness of the firm has also positive effect on its overall operational performance[10], Hence, based on the recent knowledge, we can say that business R&D expenditure is still perceived as a very desirable type of investments due to its assumed effect on businesses themselves and the economy in general. Business innovation activities can be to some extent determined by the amount of R&D spending. Firms with the intention to bring new innovative state-of-the-art goods or services to the market mostly need to apply the findings from R&D activities, which can be either performed in house by own capacities or acquire from other subjects such as public and private research institutions. However, this is not always necessary. First of all, many types of innovation do not necessarily require research and development. A large proportion of innovation activities can be considered as non-R&D innovation[11][12] and this is not only typical for the smaller firms or firms in the low-tech industries[13]. Secondly, financial support of R&D or direct investment into R&D not always turns into commercially successful innovation. The classic linear model of innovation assumed the existence of several intermediate steps leading from basic research to innovation and its diffusion while creating the invention represents one of these steps[14]. Hence, we can say that the innovation process is a rather complex issue and the way from funding to actual innovation is not always straightforward. There are several factors affecting successful innovation. Based on the Triple Helix and Quadruple helix model, we can assume that the cooperation between business, government, higher education and the public is crucial. The role of such cooperation in the innovation process has been emphasised for example by Stojcic[15]. According to Pegkas et al.[16] the EU should strengthen the cooperation between business, public and higher education R&D. However, less attention is paid to the transformation of R&D expenditure into innovation. In line with this fact, our research is primarily focused on the relationship between a firm’s commitment to research and development and its innovative outcomes. Hence, our main scientific aim is to examine the relationship between business R&D expenditure, invention and innovation. We assume that this kind of effects works mostly in the long run. Hence, we decided to use panel data and apply cointegration tests and linear cointegration regression models. Furthermore, we analyze the extent and structure of business R&D expenditure in the EU countries as well. Some of the recent studies found a positive effect of R&D financial support or R&D business expenditures on innovation using mostly micro-level data[16][17]. Most of the studies used patents as a proxy for innovation and only a few of them used the cointegration approach. In our case, we used macro-level panel data for EU countries and we combine the short-run and long-run approach in order to get more complex results. Moreover, we take into account labour productivity as one of the variables indirectly capturing the effects of R&D. The paper to some extent build on our previous results described in our conference paper[18]. The next section of the paper provides the literature review dealing with the problem so far. It is followed by a section that briefly describes the data and methodology applied in the analytical section. The results are further disused and conclusions are made in the final section of the paper.
LITERATURE REVIEW
As we mentioned several studies are dealing with R&D and its effects. R&D expenditure is the key input into the innovation process. In line with the triple helix model, the innovation itself can be seen as the results of activities and cooperation between business, universities and government[19]. Hence, there are at least three different types of subjects which are funding or providing R&D activities. R&D expenditure can be therefore classified according to the source of funds or based on the subject of performance. In our case, we take into account the second type of classification Hence, we are focused especially on R&D expenditure used in the business sector. These can be mostly founded from their own resources or government support. The potential relationship between these two sources of business R&D activities is often discussed in the literature. However, most of the studies found the complementarity between these two R&D funding sources[7][20][21]. The main goal of spending money on R&D in business is mostly to enhance innovation performance and finally improve the competitiveness of the firm in the market which can be reflected in firms’ economic situation. Some studies found a positive effect of R&D spending on the growth of the firm[22]. It is likely that business R&D expenditure also positively affects business economic and financial performance, such for example profitability[8][9][23] apparent labour productivity and value-added[24] or turnover[25]. R&D investment is crucial especially for the development of high-tech products[26]. Therefore, they are also considered as the main growth drivers of high-tech industries[27][28], which include for example aerospace, computers, pharmaceutical or electronics and telecommunications industries[25]. High technology companies are more dependent upon the intellectual property and except for their own sources, they are often using external sources[29]. These external sources can be provided to the business by universities, research institutions, or the government. Scientific knowledge provided by public researchers has a significantly positive effect on both inputs and outputs of the firms’ innovation process[30]. However, this is only true in the case when firms have enough research capabilities to absorb and use this knowledge. Hence, funding of in-house research capacities also enables a firm to use, and understand acquired knowledge[31]. Current trend of digital transformation describes for example in[32] involves usage of new digital technologies and their interconnections. For example, data mining[33] and blockchain technology[34] are becoming increasingly popular digital innovation in business processes in recent years. Hence, R&D expenditure are mostly inevitable for these types of digital business innovation. While business and government R&D expenditure can be measured directly, their effect on innovation performance is more difficult to capture. Zachariadis[35] argues that R&D expenditure is mostly reflected in the number of patents, and patents have a positive effect on the development of technologies which raises economic growth. A similar effect of patents on growth is also shown for example by Hudson and Minea[36]. Hasan and Tucci[37] base their research on a sample of 58 countries for the period 1980–2003 to indicate the positive effect of quality and quantity of patents on economic growth. Furthermore, the positive effect of patents on the development of new technologies and high technology exports has been shown by Orviska et al.[38]. However, in economic literature patents are often considered more as an invention rather than innovation itself. Grant[39] characterizes an invention as the creation of new products and processes through the development of new knowledge or the combination of existing knowledge. Innovation is defined as the commercialization of an invention by producing and marketing a good or service or by using a new method of production. Hence invention is more about new ideas, while innovations are more focused on new commercial products or services. The effect of R&D expenditure on technology development and also innovation can be reflected by the number of patents. On one hand, patents are the outputs of the production system of knowledge. On the other hand, patents can also be interpreted as input to the economic process of innovation[40]. Patents are therefore often used as a proxy for inventions and they can then be seen as the first step towards innovation[41] Compared to academic publication or most of the other research outputs patents are closer to innovation and technological development[42]. Despite mentioned potential differences, several studies are considering the number of patents as a direct indicator of innovation performance[17][43]. We assume that effect of R&D expenditure on patents could be positive because the internal research capabilities, particularly those focused on basic research are crucial for the firm to generate creative outputs[41]. For example, Cardinal and Hatfield[44] examined firms with different intensities of R&D expenditures and observed that firms with higher R&D spending experienced significantly more inventions proxied by the number of patents. Similarly, Peeters and van de la Potterie[45] found that firms with more focus on research activities produce significantly more patenting output. On the other hand, Acs and Audretsch[46] argue that the relationship between R&D expenditure and intensity of patenting is more complex and firms can often experience decreasing returns to their R&D investment. Some empirical papers have also shown that increasing levels of R&D spending over a certain threshold is ineffective or even counterproductive for innovation outputs[47]. The role of patenting in the innovation process was also emphasized by Demirel and Mazzucato[48]. They found the positive impact of R&D on firm growth is conditional upon the firms’ activity in patenting and persistence in patenting. For small firms, R&D increases their growth for only a subset of firms that patent persistently for a minimum of five years. The effect of the R&D subsidy program on innovation has been examined for example by Bronzini and Piselli[17]. Innovation has been in this study proxied by the number of patents. The authors conclude that the R&D subsidy program in Northern Italy has a positive and significant effect on the number of patent applications. The benefits of the program have been especially evident for smaller firms. There are significant differences in characteristics of innovation system among EU countries. Countries with different innovation levels differ in the adoption of broadband, adoption of e-commerce as well as the adoption of the internal processes support within information systems[49]. In general, we can say that the importance of R&D for innovation depends on the dominant type of innovation model. On one hand, firms can innovate by the exchange of formal or codified knowledge, which mainly originates in research and development and patenting. On the other hand, innovation can also steam from tacit knowledge, which is mainly based on experience and informal interactions[50]. Based on this fact, there are at least two significant types of innovation modes. Firstly, we distinguish scientific and technology-based innovation (STI) mode, which mostly relies on research outputs and their dissemination[51]. Secondly, there is so-called learning-by-doing, by-using, and by-interacting (DUI). In reality, both types of innovation modes are often combined to get results. According to González-Pernía[52] the final effect of both depends on the type of innovation. While the combination of STI and DUI is beneficial for product innovation, single DUI mode appears to be characteristic especially for the process innovation.
METHODOLOGY AND DATA
The main aim of the paper is to examine the potential relationship between business R&D expenditure, invention and innovation. The analysis has been focused especially on the business sector as one of the main innovation producers in the economy. In the first part of the analysis, we examine the extent and structure of R&D expenditure in EU countries. The cross-sectional data for the latest available year have been used for this comparison. Data have been retrieved from the Eurostat database. Firstly, we compare the total level of R&D expenditure in the country expressed in PPS per inhabitant as well as in percentage of GDP. Secondly, we compare intramural R&D expenditure (GERD) in the business enterprise sector of EU member states. We also graphically illustrate potential relationships between the R&D expenditure share of innovative firms and patenting activity in the country. In the next part of the analysis, we use panel data for EU member states. Panel correlation analysis between selected variables capturing innovation and R&D expenditures has been done based on data within the period 2011-2018 for all EU member states. As it can be seen the time availability of data was rather limited in this case. In this first part, we mostly focused on the share of innovation firms as the main output variable. Mostly due to the better data availability in the next part of the analysis we used the number of patent applications as the main dependent variable. Hence, panel Granger causality test, cointegration analysis as well as panel cointegrated regression have been applied to data with a longer time frame (from the year 2007 to 2017). All main variables used in the analysis are described in more detail in Table 1.
*Source: Authors, based on the data from Eurostat database.
The dataset used in the analysis consists of panel data. Thus, variables include a cross-sectional (country) dimension as well as a time dimension. It includes the data for EU28 countries. In line with our main aim, we tested the potential relationship between business R&D spending and patenting in the economy. To fulfil the goal, we decided to use the the cointegration approach as the main method. The transformation of R&D expenditure into invention (proxied by the number of patents) or innovation usually takes a rather long time. The effect will be probably not visible in the same period and using longer lags will significantly decrease the number of available observations. Moreover, there is likely a long-run causal relationship arising from R&D spending to patenting activity. Firstly, variables used in the models were tested for weak stationary and the order of integration for all variables, which we want to use in the cointegrating regression model. Several different panel stationarity tests were applied[53][54][55][56][57]. Then we have tested the potential short-run causalities in Granger sense and their directions by using panel Granger causality tests. However, as mentioned above, we assume that potential causalities should be more evident in the long run. To test long-run causalities, we apply panel cointegration analysis. GDP per capita was used mainly as a control variable. The long-run equations will be further estimated as:

After we have managed to satisfactorily demonstrate the same level of integration for selected variables by unit root tests, we test for the existence of cointegration by panel cointegration tests. Cointegration between the dependent and independent variables has been tested for using panel cointegration tests developed by Pedroni[58] and Kao[59], which are both widely used in the empirical literature. Both are testing the null hypothesis of no cointegration between selected variables. The Pedroni cointegration tests use seven different statistics. Four of them are panel cointegration statistics based on the within the approach and three of them are group-mean panel cointegration statistics which are based on the between approach. Kao’s test tests the null hypothesis that the residuals from the estimation are non-stationary. The panel cointegration tests allow us to identify the presence of cointegration, but cannot estimate any long-run causalities or effects. For this purpose, we use panel cointegrating regression models. The long-run parameters are estimated by the fully modified OLS (FMOLS) panel cointegration estimator. Here we briefly describe the essence of the estimator. FMOLS is based on standard OLS considering the simple fixed-effects panel regression model that can be written as:

where Yit is a vector of the dependent variable and β is a vector of coefficients. αi is an individual fixed effect and the unit are stationary disturbance terms. It is assumed that Xit has integrated processes of order one for all i. The FMOLS estimator then is written as follows:

where is a serial correlation term that gives the covariance matrix of the residuals corrected for autocorrelation and is the transformation of the dependent variable yit to achieve the endogeneity correction. We used especially the pooled FMOLS estimators which were based on the “within dimension” of the panel. The pooled FMOLS estimator is proposed in[60]. The estimator is robust concerning to the potential problems of serial-correlation and endogeneity, which are potential problems with common OLS panel data estimators[61]. It solves this problem by nonparametric corrections.
RESULTS
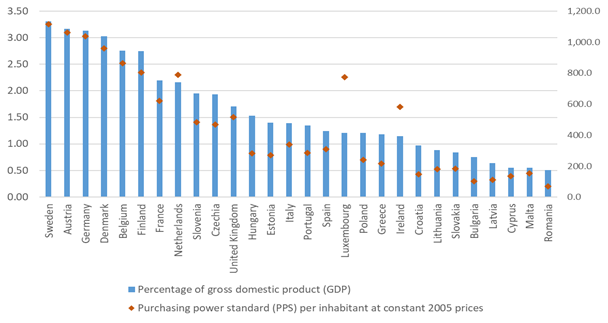
First of all, we analyze the extent and structure of R&D expenditure in EU countries. This will allow us to assess the current situation and differences among EU member states. In Figure 1 we compare the actual size of total R&D expenditure in the EU in the year 2018. In the analysis, we used total intramural R&D expenditure expressed as a percentage of GDP (left axis) as well as in PPS per capita (right axis). As it can be seen, the highest overall R&D expenditure in both expressions is in Sweden, Austria, and Germany. As expected smaller countries such as Luxembourg and Ireland have significantly higher R&D expenditure per capita compared to their share of GDP. Romania, Malta, and Cyprus are the worst-performing countries in the EU concerning this indicator.
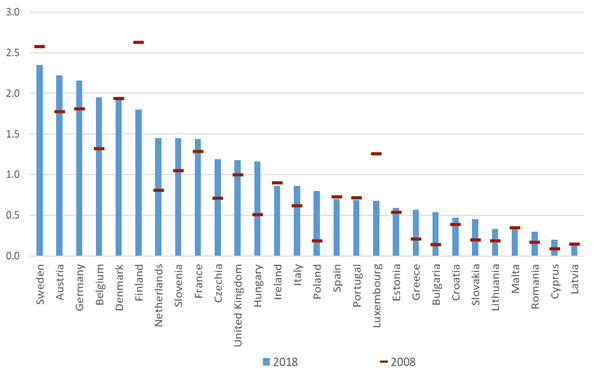
As mentioned in our analysis we further focused only on business R&D expenditure which in some countries represent the major share of total R&D expenditure. The share of business intramural R&D expenditure on GDP in the years 2018 and 2008 is shown in Figure 2. This time the differences among countries appear to be even more significant than in the previous case. However, leading countries remain the same. Sweden, Austria, and Germany are followed by Belgium, Denmark, and Finland. When we compare the result to Figure 1 it is evident that the majority of total R&D expenditure can be assigned to the business enterprise sector in all leading countries. Hence R&D in top-performing countries is driven mostly by the business sector. Most of the countries experienced slight growth in business R&D expenditure during the ten years since 2018. However, many countries are stagnating over this period. Moreover, business R&D expenditure drops significantly during this period in three EU countries namely Finland, Luxembourg, and Sweden.
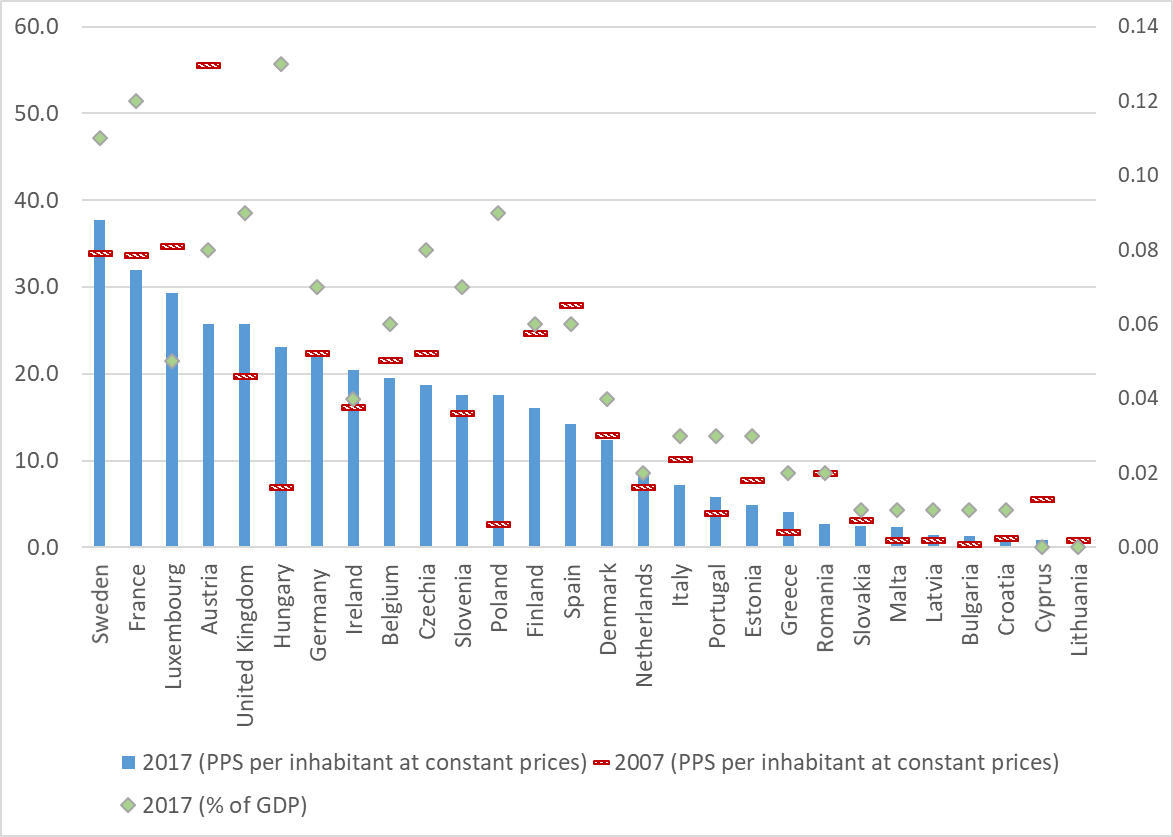
The R&D expenditure showed in the Figure are those spent and used in the business enterprise sector. These expenditures can be founded either from business or from government or other subjects. Direct or indirect government support of business R&D expenditure is considered an essential part of innovation policy in most developed countries. In Figure 3 we look more in detail at this kind of funds for business R&D investments. It is expressed as a percentage of GDP (right axis) as well as in PPS per capita in years 2007 and 2017. The highest governmental support of business R&D per capita can be seen again in Sweden. However, the share of governmental support on GDP is the highest in Hungary followed by France and Sweden. Business R&D expenditure per capita financed by the government decrease between the years 2007 and 2017 the most in Austria, Spain, and Romania. On the other hand, Poland, Hungary, and United Kingdom have experienced significant growth. In the next part of our analysis, we in more detail examine potential relationships between selected variables. Our main focus is on the relationship between R&D expenditure, invention, and innovation. The relation between business R&D expenditure share of innovative firms and number of patents per inhabitants in EU countries is illustrated in Figure 4. We take into account the most recent available cross-sectional data for the year 2018. The high number of patent applications per inhabitant can be seen in Germany, Sweden, Austria, Denmark, or the Netherlands. These countries experienced also a very high level of business R&D expenditure and most of them are also leaders in the share of innovative firms. On the other hand, countries such as Romania, Bulgaria, Latvia, Poland, or Slovakia lie on the other side of the scale and performed rather poorly in all three dimensions. Countries performing well in one indicator usually performing also in the other two indicators and vice versa. Despite some few exemptions such as in cases of Greece or Portugal the results suggest the existence of a positive correlation between all three selected indicators.
We further examined similar correlations based on panel data for all EU member states in the period 2011-2018. Results are shown in Table 2. This time we used variables capturing the share of SMEs innovating products and services as well as the share of SMEs innovating in-house. Furthermore, employment in high and medium technology sectors was used as a measure
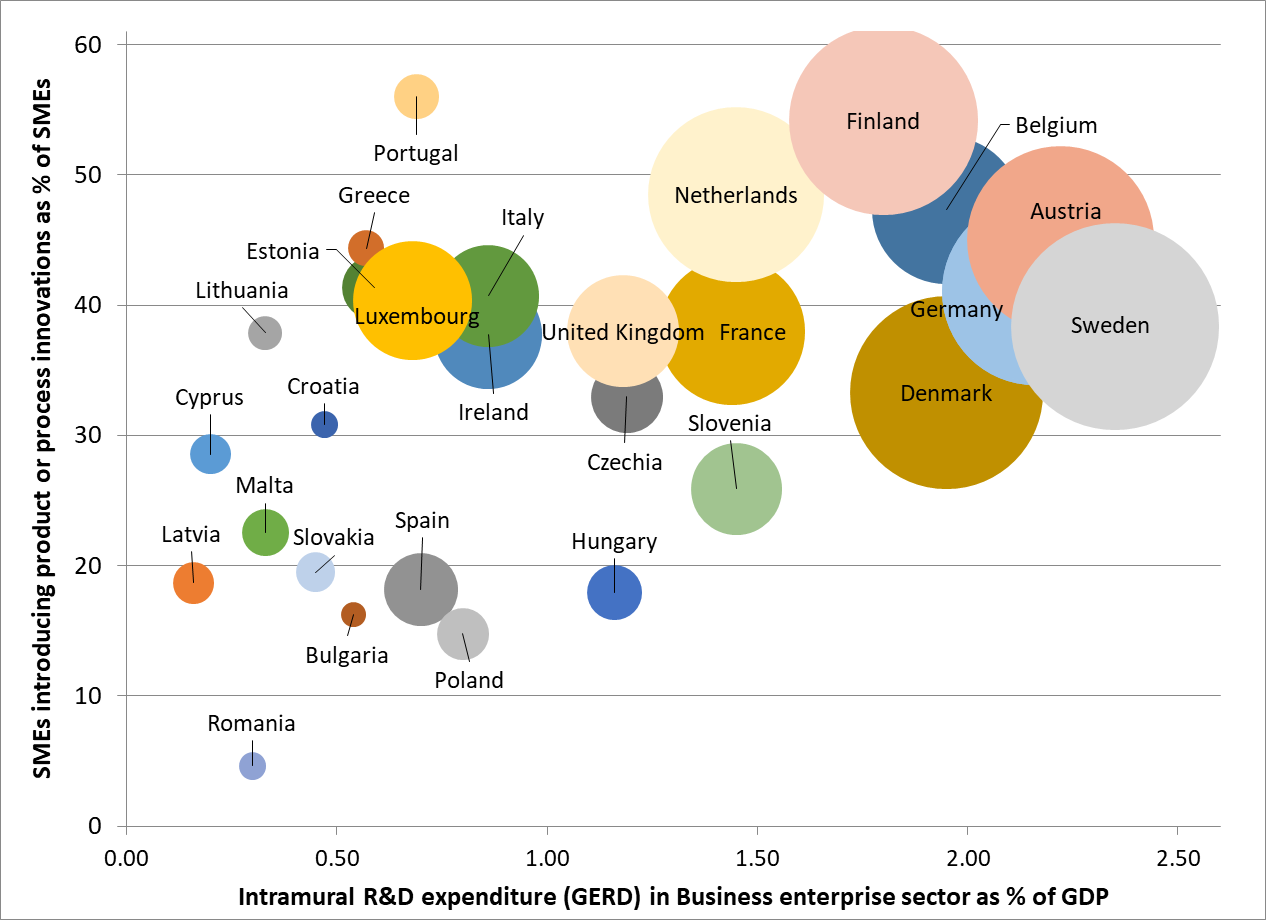
*The size of the circle means the number of patent applications to the EPO per 1 million inhabitants
of technological advancement in the industry. We assumed that higher employment in these sectors can also imply more innovative firms in the economy. However, this assumption was not supported at all by the empirical data in our case. Hence, it could to some extent mean that high and medium technology industries are not the main drivers of products and services innovation in most of the EU countries, but of course, more research is needed to prove this possible explanation. The correlation between business R&D expenditure and the share of innovative firms is positive and significant but not particularly strong.
To proceed further in our analysis, we test potential short-run and especially long-run causalities we used patents as a dependent variable and business R&D expenditure as a percentage of GDP as the main independent variable in our analysis. Firstly, we want to test potential short-run effects in both ways. Hence, we applied the Granger causality test. We also used apparent labor productivity in all sectors as the variable in the analysis. We assume that business R&D could lead to patents and patents could have a later positive effect on labor productivity. The results of the panel Granger causality test are shown in Table 3. As it can be seen results suggest the existence of statistically significant casualty in Granger sense arising from Business R&D expenditure to the number of patents per capita, while the effect in opposite direction is not found. The mentioned relationship is significant when taking into account one-year and two-year lags. There is also a little bit weaker evidence for the effect of patents on apparent labor productivity after the three years lag. This relationship is statistically significant at a 5 % level of significance. Firstly, we want to test potential short-run effects in both ways. Hence, we applied the Granger causality test. We also used apparent labour productivity in all sectors as the variable in the analysis. We assume that business R&D could lead to patents and patents could have a further positive effect on labour productivity. The results of the panel Granger causality test are shown in Table 3. As it can be seen results suggest the existence of statistically significant causality in Granger sense arising from Business R&D expenditure to patents per capita, while the effect in opposite direction is not found. The mentioned relationship is significant when taking into account one year and two-year lags. There is also a little bit weaker evidence for the effect of patents on apparent labour productivity after the three years lag. This relationship is statistically significant at a 5 % level of significance
***/** means significance at the 1/ 5 % level.
Based on the results we can conclude that we found some evidence for the short-run relationship between Business R&D expenditure and the number of patents per capita. We identify the direction of these potential effects, but we are not able to identify whether this effect is positive or negative as well as its power. Hence, after the Granger causality tests, we look more in detail at a potential long-run causal effect, which could be very likely more important in this case due to the nature of long-lasting innovation processes. We assume that there can be a long-run relationship between business R&D funding and inventions measured by the number of patents per capita.
**/*** means significance at the 5 %/ 1 % levels
The number of patents can be also to a certain degree affected by the economic development in the country. Therefore, we also used GDP per capita as the control variable. The cointegrated regression approach allows us to determine long-run causalities. It is robust for both non-stationarity problems and most of the endogeneity problems. However, the number of control variables is limited in this case, because all variables used in the mode must be cointegrated. To test the same level of integration or the cointegration of selected variable we firstly need to use panel unit-root test. We applied five different panel unit-root tests. The results mostly suggest that all three variables are very likely non-stationary at their levels but they are stationary when using the first difference. This means that the first necessary condition for cointegration of these variables has been met. The existence of cointegration between these three variables has been further tested by Pedroni and Kao panel cointegration tests. All results are shown in Table 5 and Table 6. In the first part showed in Table 5 we test cointegration among all three variables. Despite slightly mixed results, the majority of tests confirm the existence of statistically significant cointegration at least at a 5 % level of significance. Thus, based on the results we can proceed further to cointegrated regression analysis.
**/*** means significance at the 5 % / 10 % levels.
In Table 6 we tested cointegration only between the number of patents per capita and share of business R&D expenditures on GDP. This time the results are even more convincing. Based on the majority of tests we can conclude that there is cointegration between these two variables.
**/*** means significance at the 5 % / 10 % levels.
After the cointegration tests, we can finally proceed to panel cointegrating regression models. To check the robustness of the results we applied FMOLS estimator with different specifications as shown in Table 7.
*/**/*** means significance at the 10 %/ 5 %/ 1 % levels; long-run variances calculated based on Bartlett kernel and Newey-West bandwidth have been used for coefficient covariances; A - FMOLS (pooled estimator), constant included, coefficient covariance matrix with homogenous variances; B - FMOLS (pooled estimator), constant included, coefficient covariance matrix with heterogeneous first-stage coefficients; C - FMOLS (pooled weighted estimator), coefficient covariance matrix with homogenous variances; D - FMOLS (pooled estimator), constant &linear trend, coefficient covariance matrix with homogenous variances; E - FMOLS (pooled estimator), constant and linear trend as an additional regressor, coefficient covariance matrix with homogenous variances.
The long-run positive effect of business R&D expenditure on the number of patents is statistically significant at least at a 10 % level of significance in all five models. Moreover, this effect is also significant at a 5 % level in four out of five models. Hence, we can conclude that our results strongly suggest that there is a positive long-run effect of business R&D expenditure on inventions which could likely also further lead to innovation in the business sector. Likely, higher R&D expenditure in the business enterprises sector will increase also innovation performance. The long-run effect of GDP per capita on patenting was in our case insignificant in almost all models except one. The effect of GDP can likely be more evident in the short-run rather than in the long run.
DISCUSSION
Our result can have several interpretations and implications. Firstly, there are several issues related to using the number of patents as the main dependent variable. On one hand, several previous studies such as[17][43] have used patents as a direct measure for innovation. On the other hand, patents are also often used as the proxy for invention[39][41] rather than innovation. For example, Artz et al.[41], argue that patents are commonly seen as innovation, which is further leading to actual innovation. Similarly, Lin et al.[62], used sales arising from patents as the alternative measurement of innovation output. This study was focused on Taiwanese manufacturing firms. Hence, in this case, most of the firms were likely focused on the innovation of high-tech or medium-tech products. In such conditions, patents can be a very good proxy for innovation. Typical business innovation is not always based on patents. There are several types of innovation such for example innovation of products, services or processes and most of them are not related to patenting. In our case, we accepted both approaches and assume that patents are representing part of inventions and can be also to some extent considered as the proxy for the specific type of innovations. This is especially true for product and process innovation. However, it is still important to notice that the number of patents cannot be considered as an exact measure of either invention or innovation. As argued, by Thomas et al.[63], not all inventions are patented or can be patented and not all patents are useful for innovation, even though patents are still considered the most common indicator of innovative output. Albeit the indicator is a good proxy for measuring innovation only the part of technological knowledge is shared by patents[64]. Despite mentioned disadvantages of this indicator, we decided to use patents as the main variable capturing invention and innovation in our analysis. In the absence of economy-wide data on innovations, the number of patents is currently used as the standard measure of innovation[65]. Within this context, Leydesdorff et al.[40] argue that despite the well-known limitations patents can be used for analysing patterns of the invention. In our case, we are using the R&D expenditure as the most important independent variable. The existence of the potential relationship between R&D and invention or innovation has been discussed in the introduction and literature review. Based on our results, we can conclude that we found empirical evidence for the positive effect of business R&D expenditure on the number of patents in the short-run as well as in the long run. A higher level of R&D expenditure should increase R&D activities and these in ideal circumstances can scale up patents and innovation. Despite most of the previous studies have been focused more on the short-run causalities, the length of the whole innovation process from spending to innovation and innovation indicates that the effects should be visible more in the long-run. Hence, our study is primarily focused on examining potential long-run causalities by using an integrated approach. However, we found both types of effects. In the short-run are results indicate the existence of Granger causality between R&D expenditure and patents. These results are in line with theoretical assumptions as well as with previous empirical research. We found that this effect is has been to some extent found even in the short run. Our results are in line with some other previous studies. For example, Zachariadis[35] assume that R&D expenditure is mostly reflected by the number of patents in the economy which is further transformed into different types of new technologies. Peeters and van de la Potterie[45] found that firms with more focus on research activities produce significantly more patenting output. Our results also suggest that the innovation process in EU countries mostly follow the science and technology-based innovation path (STI) described for example by Jensen et al.[51]. According to this assumption, we can state that innovation outputs are mostly based on R&D expenditures. Taking into account this fact, business innovation also requires higher investments into high-skilled human resources and highly skilled scientific human resources and advanced technologies and infrastructures. Hence, the cooperation of business, higher education institution and government is often inevitable to reach a sufficient volume of innovation. Especially research centres, universities and foundations play important role in STI mode in the acquisition of knowledge the diffusion of scientific research[66]. Of course in our sample, there can be also several countries where STI mode is not dominant. We can assume that especially firms some countries in central Europe or Eastern European countries are more focused on non-R&D innovation. Furthermore, following the results obtained by Kravtsova and Radosevic[67] we can also assume that Eastern European countries have in general less efficient national systems of innovation which are generating lower numbers of science and technology outputs such as patents compared to other countries. Our results confirm this fact. We found that the share of innovative enterprises, as well as the number of patents, is mostly lower in EU countries from the eastern part of the Union. Firms from, Romania, Poland, Latvia, Bulgaria, Hungary and Slovakia are significantly less innovative compared to other EU member states. This is in line with much more complex data from the European innovation scoreboard[68] where mentioned countries are based on all dimensions captured in the scoreboard classified only as modest and moderate innovators. Hence, we believe that more attention should be paid to them in future research as well. Our research is focused on the problem that has been previously investigated by several studies. However, we believe that its economic importance and specificity requires even more in-depth examination. Our research brings some new empirical insight into this problem by using original methodology and data. Most of the research so far has been focused on certain specific countries and it mostly examined the short-run causalities. However, there are few studies with a similar methodology. For example, Pegkas et al.[16] have also analyzed the long-run relationship between innovation and R&D expenditure in European Union countries. Similar to our results, they also found the co-integration relationship between innovation and R&D and the existence of a positive effect of business, public and higher education R&D on innovation. They also argue that the business R&D expenditure has the highest positive effect on innovation. Compared to our approach they are using a different methodology to examine long-run causalities. We also additionally perfumed the short-run Granger causality test. Furthermore, they are using data until the year 2014, while we are using novel data over the period 2011-2018. Despite differences in methodology and dataset, the results are to some extent similar. Furthermore, our results are also in line with those found by De Rassenfosse and van Pottelsberghe de la Potterie[69]. They examined the relationship between R&D expenditure and the number of planets over the period 1980–2007, in Europe, the US and Japan and concluded that R&D expenditure has a positive effect on the number of patent applications. Despite our effort to achieve the most relevant results, our approach has also certain limitations. First, the patenting used in the analysis can be seen only as a proxy for invention or innovation. Secondly, we assumed that the effect of business R&D expenditure is largely localized in the same country where these funds have been used. Thus, we do not account for potential cross-border spill-overs or indirect effects. The scope of the data has been limited by the data availability. Moreover, the FMOLS estimator can be also used only on cointegrated variables. These two facts limited the number of control variables. Even though the problem of endogeneity has been to a large extent solved by using panel FMOLS estimator, more control variables might further improve the robustness of our results. Our approach does not allow us to capture differences between countries. Moreover, based on our data we are not able to distinguish between the different business sectors or research areas. Hence, potential further research can be aimed at the differences between different sectors or countries. In the paper, we used macro-level data and a sectoral approach. Further analysis of this problem based on the level of firms could be complementary to our results.
CONCLUSIONS
In this paper, we examined business Intramural R&D expenditure in EU countries and identify their short-run and long-run on the number of patents. Based on the mentioned results we can make several concussions and provide some implications. Firstly, it can be concluded that investments in research and development appear to be important for the the creation of invention and innovation. Business R&D expenditure on GDP has a positive effect on invention expressed by patents. This seems to be especially true in the long run. However, we also found some empirical evidence for short-run causality in the Granger sense between both selected variables. A positive correlation has been detected also between business R&D expenditure and the share of innovative firms in the countries. This is valid also for firms innovating products in services in general as well as for those firms innovating in-house. Furthermore, we found that countries with higher business R&D expenditure on GDP also mostly experienced a higher share of innovative firms as well as higher patenting activity. Concerning all three indicators, countries such as Sweden, Germany, Austria or Finland represent good practice. All four countries also experienced the highest R&D expenditure in the business enterprise sector in the EU. The systems of innovation support in these countries are usually considered as ones of the best in Europe. Government financial support of business R&D is very high in Sweden, France and Luxembourg. On the other hand, countries such as Latvia, Romania and Cyprus have a low level of business R&D expenditure. Overall R&D expenditure in the economy is also very limited in these countries. Turning to the dynamics of business R&D expenditure we can conclude that not all EU countries increase them in selected ten years’ period. There were significant drops in Finland, Sweden and Luxembourg. However, in most of the EU countries, we noted a slight increase. The decrease in government funding of business R&D during the period 2007-2017 was even more significant in many EU countries. This could mean that governments can more recent period effort, in general, less expenditure dedicated to the support of R&D activities in the business enterprise sector compared to the situation before the last financial and economic crisis. However, the role of non-R&D innovation expenditure should not be neglected as well. Especially in the countries with the dominant DUI mode, rising R&D expenditure can be less effective in increasing the level of innovation. In this case, the improvement of the external business environment such as regulation can be at least equally important.