Skip to the main content

Original scientific paper

https://doi.org/10.7906/indecs.19.2.10

Different tax preferences? Old vs. New Europe

Valerija Botrić ; Institute of Economics, Department for Social Policy and Labor Markets
Tanja Broz ; Institute of Economics, Department for macroeconomics and international economics
Saša Jakšić ; University of Zagreb – Faculty of Economics and Business


Full text: english pdf 1.463 Kb

page 328-356

downloads: 231

cite

Download JATS file


Abstract

The aim of the article is to provide a comparative analysis of the factors behind citizens’ specific tax
burden preferences between New and Old EU Member States. Based on the available data from
International Social Survey Programme for years 2006 and 2016, we form two groups of countries:
Old Europe – Germany, Denmark, France, Spain, Finland and Sweden – and New Europe – Czech
Republic, Slovenia, Latvia, Hungary and Croatia. Initial inspection of the preferences for more
progressive taxation shows that in most countries, citizens would prefer the higher redistributive role
of the state and there are no clear-cut differences between Old and New Europe. Analysis of factors
contributing to individuals’ preferences for progressive taxation provided interesting insights: older
cohorts in New Europe are not disproportionally inclined to progressive taxation; political orientation
and union membership are more important in Old than in New Europe; and there are no significant
changes in the patterns resulting from the latest financial crisis.

Keywords

tax burden preferences; European economies; comparative analysis; International Social Survey Programme

Hrčak ID:

259632

URI

https://hrcak.srce.hr/259632

Publication date:

30.6.2021.

Visits: 549 *


INTRODUCTION

The 1990s were marked by the transition of former socialists economies. As European transition economies also declared their intentions to join the European Union, the transformation towards established market mechanisms and the ability to function on the European common market began. The initial assumption was that the role of the government would diminish and the citizens’ demand for government interventions would decline. Recent studies suggest that pre-tax inequality was lower in Eastern Europe, but increasing rapidly with the transformation process[1]. Fuchs-Schündeln and Schündeln[1] argue that redistribution through taxes and transfers was lower in Eastern Europe socialist system as a consequence of price and wage restrictions that were the main redistribution mechanisms. The open question remains how the citizens have reacted to the changes and whether there are still commonalities in the perception of the role of government among post-transition economies or they converged to Old Europe.

The public goods from the perspective of citizens entail two sides of a coin: gain and loss. To yield benefits from health, education, security and other government services, citizens have to pay taxes. Extant studies confirm differences in the size of the welfare state, fiscal stance, tax burden as well as tax compliance across European economies. As the countries develop different welfare systems, their citizens develop differentiated preferences. However, along with developing differentiated preferences for the welfare system, citizens develop different preferences towards progressive taxation of incomes. Behind different preferences for taxation, numerous factors are influencing an individual’s attitudes, including the socioeconomic and demographic factors as well as preferences for government intervention in different aspects (e.g. education, health and security).

There are three specific research questions that we want to address. The first research question asks if, within a group of countries, different factors predict whether a person will have preferences for more progressive taxation in the period after the 2008 crisis in comparison to the pre-crisis period. The second research question, based on the analysis between two groups of countries, aims to identify whether personal characteristics, important for predicting a certain level of taxation, are similar between Old and New Europe. We explore two different periods – 2006 and 2016. Although the period is relatively short for significant convergence in attitudes to occur, it enables discussion of the 2008 crisis effects on the possible changes in the preferences of New and Old Europe citizens, thus consisting third research question. We aim to offer the following contributions. First, we provide more recent evidence on the evolution of tax preferences in post-transition countries, thus expanding the findings of Dallinger[2], Redmond, et al.[3] and Suhrcke[4]. Second, while previous research has documented differences between post-transition economies[5], there is a lack of comparison with developed European market economies.

The article adopts the following structure. Next section briefly reviews the literature on the preferences for income redistribution and tax burden. Data and methodology are presented in section 3, while the results of the analysis are presented in section 4. Section 5 contains discussion and implication of the results, while the last section offers conclusions and a roadmap for future research.

LITERATURE REVIEW

World economies are faced with exacerbating economic inequalities which are, for the time being, the lowest in Europe and the highest in the Middle East[6]. Although income inequalities have increased virtually in all countries, the speed of the increase varies. On the one hand, in the European Union, income inequality has grown moderately[7]. On the other hand, since the 1980s, the largest increase of income inequalities has been recorded in China, India, Russia and North America. The issue of income redistribution has attracted much attention from researchers, policy-makers and global public. Alesina and Rodrik[8] and Persson and Tabellini[9] noted an inverse correlation between inequality and growth. Rodrik[10] additionally argues that economic growth alone may be insufficient to solve the problem of inequality. Hence growth policy should be enhanced with redistributive measures so that the results of economic growth are more evenly distributed[11].

Alesina and Giuliano[12] find that preferences for redistribution are determined by personal characteristics such as age, gender, race and socioeconomic status. However, they are also a product of history, culture, political ideology and a perception of fairness. The authors also find that preferences for redistribution vary substantially across countries and show that these differences could be the result of differences in religion, histories of macroeconomic volatility and more generally defined culture. George[13] finds that individuals’ preferences for redistribution are not easily modelled by their perceived impact on their position in the income distribution, while Charite et al.[14] find that individuals display reference-dependent preferences. Lockwood and Weinzierl[15] show how the presence of preference heterogeneity affects the optimal extent of income redistribution.

The shape of the income distribution should be crucial in the determination of policies with redistributive components (such as social security, health care, government transfers and taxation). However, Cruces et al.[16] find evidence of significant biases in individuals’ evaluations of their relative position in the distribution. Eventually, misperceptions about the income distribution affect attitudes towards redistribution.

Redistribution refers to both the way the funds (taxes and social contributions) are collected (progressivity of the tax system) and the way they are allocated (social transfers). Hence, redistributive policies are influenced by a complex set of factors that determine public expenditures and revenues, while existing studies suggest that this ratio is not constant across the countries. Preferences for welfare state are not independent of attitudes towards taxation[17]. Ross[18] argues that fiscal preferences are driven by the tax burden relative to the goods and services the government provides. Barnes[19] suggests that preferences over tax levels have a greater effect on progressivity preferences in less progressive tax systems. Although social welfare is larger if the distribution of wealth and income are less concentrated, policy-makers must be aware that redistributive taxes and transfers could discourage incentives to work, save and earn income[20]. Regarding tax policy, Diamond and Saez[20] suggest that high earners should be subject to high and rising marginal tax rates on earnings while the earnings of low-income families should be subsidized. Moreover, the authors argue that capital income should be taxed, challenging arguments given by Atkinson and Stiglitz[21], Chamley[22] and Judd[23].

In the EU countries the overall tax burden, as a percentage of GDP, has been increasing and the European Commission[24] especially points out that the tax burden on labor is relatively high if compared to the other advanced economies. For example, total tax wedge between the labor costs to the employer and the corresponding net take-home pay for single workers without children at average earnings levels in the EU Member States that are also the OECD members was 41,9 % in 2019, while in the rest of the OECD countries tax wedge was 26,7 %[25]. The difference is smaller in our two subsamples – tax wedge in Old Europe was 42,6 %, while in New Europe (excluding Croatia) it was 43,7 %[25].

Taxes on labor income are the largest source of public revenue in the EU. However, the structure of taxation differs between the Member States with consumption taxes having a markedly higher share in public revenues in new Member States such as Croatia and Bulgaria. The rising tax burden is closely connected to the expansion of public sector commitments to welfare provision[26]. Evolution of public expenditures, especially health expenditures[27]. has a strong impact on redistribution.

European Union today is a mixture of advanced western European countries and countries that until the 1990s had a socialist system, which implies that differences in tax burden preferences might have been significant before and at the beginning of the transition period. Socialist system’s characteristic was proclaimed egalitarian, which implies that differences between high and low salaries were lower than in capitalist western European countries. Redmond et al.[3] report that the Gini coefficient in the 1980s was lower in CEE countries than in Western European countries. Further, the socialist system offered a wide range of programs that helped citizens in economic difficulties[28]. Hence, tastes for redistribution in these countries have been shaped by specific country experience and tradition[29]. Indeed, during the 1990s, post-socialist countries were still different from developed Western European countries in the support for income distribution. Dallinger[2], Redmond et al.[3] and Suhrcke[4] use data from 1999 International Social Survey Program (ISSP) and find that in post-socialist countries support for redistribution is significantly higher than in Western European countries which have more conservative political regimes. Lipsmeyer[28] concludes that during mid-1990’s post-socialist countries still retained part of welfare preferences and attitudes of the socialist past. Okulicz-Kozaryn[30] suggests that this is related to the lack of upward mobility and relatively generous welfare systems under the previous regime, general path dependencies of public policies, and increased risk aversion due to the series of macroeconomic volatilities these societies experienced.

Still, the transition from a socialist system to market economy included extensive market-oriented reforms, accompanied by the diminishing influence of the state and opening up to foreign trade and investments[31]. Hence, it should not come as a surprise if by now New member states managed to become more similar to Old EU members in tax burden preferences, although post-transition economies are not a homogenous group[5]. The question remains whether factors behind tax burden preferences are similar in New and Old member states. Even though factors of tax burden preferences are well researched[32, 33] the differences between New and Old Europe remain relatively neglected topic in the literature. Hence, the rest of the article is devoted specifically to this issue.

DATA AND METHODOLOGY

We rely on the International Social Survey Programme 20061 and 2016 data2, in which individual-level preferences for different aspects of the role of government were surveyed in 48 countries. Alesina et al.[34] recently remind about stereotypically documented views on differences between Americans and Europeans in preferences for redistribution. Our focus in the present article is on the EU countries, due to the underlying assumption that the EU integration process leads to harmonisation in different areas. This is the reason why we further distinguish between the Old European member states and New European member states. We included all EU countries for which data were available in the ISSP for both years. Among the countries of Old Europe, we include Germany, Denmark, France, Spain, Finland and Sweden. Among the New European countries, we include the Czech Republic, Slovenia, Latvia, Hungary and Croatia.

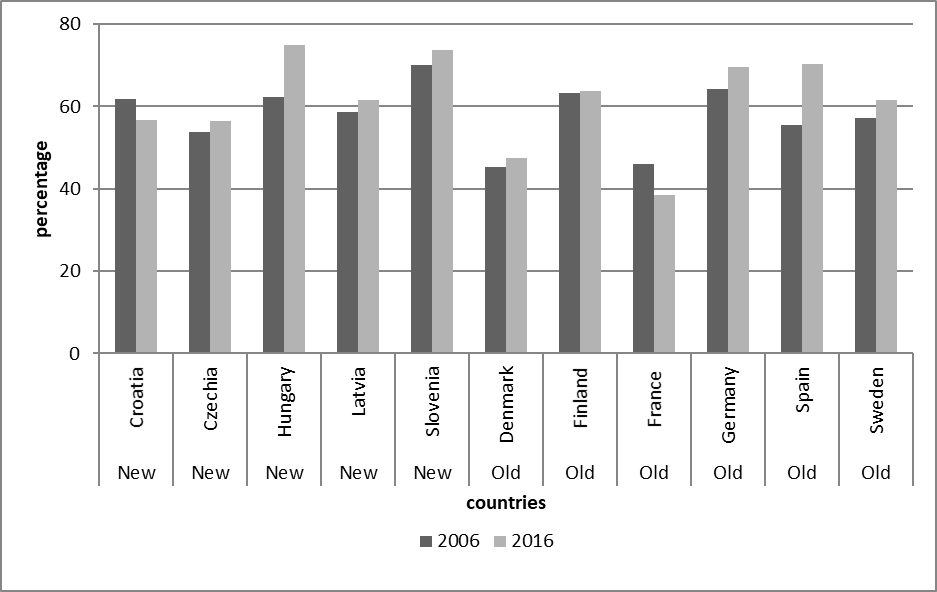
The preferences for tax burden can be quite different from the actual distribution of the taxes. Some people might find that more progressive distribution is fairer, while others could be against this. The average opinion of the population may not be reflected in the actual distribution of the taxes, depending on the overall importance the tax system has in public debates. To capture the attitudes towards progressiveness of the taxes imposed, we follow the approach proposed by Barnes[19] based on the ISSP survey question. Specifically, respondents were asked to assess on a 5-point Likert scale (1 – much too low, …, 5 – much too high) the tax burden for the low, median and high-income population. The respondents’ assessments of the tax burden were grouped into three categories – low (much too low and low), medium and high (high and much too high). Based on the answers provided for all three income categories, respondents were grouped into those in favor of more progressive taxation and others. The procedure yields 27 different preferences profiles. Each preference profile depicts the respondent’s preferences for each of the income group. Respondents were categorized as more in favour of progressive taxation if they belong to one of the following profiles: LHH (high-income households are taxed too low, middle-income households are taxed too high, low-income households are taxed too high), LRH (high-income households are taxed too low, middle-income right, low-income high), RHH (high-income households are taxed right, middle-income households are taxed high, low-income households are taxed high), RRH (high-income households are taxed right, middle-income households are taxed right, low-income households are taxed high), LRR (high-income households are taxed low, middle-income are taxed right, low-income are taxed right), LLH (high-income households are taxed low, middle-income are taxed low, low-income are taxed high) and LLR (high-income households are taxed low, middle-income households are taxed low, low-income households are taxed right). Figure 1 shows citizens preferences for more progressive taxation in Old and New Europe. It can be noticed that in most countries (except for Denmark and France), respondents are in favor of more progressive taxation. The data clearly shows that there are no standard Old-New Europe differences in patterns. Rather, the assessments are more likely to be under the influence of general taxation policy in each country. The data for 2016 also corroborates such findings: in Old Europe, 7,3 % of respondents consider that taxes are overall too high, while this share in New Europe rises to 14,4 %.

From the data presented in Figure 1, we can also notice that support for more progressive taxation has increased in almost all the countries after the 2008 economic crisis. There are two

Figure 1. Preferences for more progressive taxation, in percentage of the total number of respondents [35, 36].

[35, 36]

indecs-19-328-g1.png
exceptions – Croatia and France, where the share of respondents in favor of more progressive taxation has decreased. The initial inspection of the data, thus, does not suggest that post-transition economies are still very different from the European market economies. However, we proceed with the separate empirical analysis into the factors behind the revealed preferences in two groups of countries because of the previous emphasis in the literature that post-transition economies exhibit different patterns than old EU members. The choice of factors considered to be important predictors for the preferences for higher progressive taxation is guided by the literature but limited by the variables available in the questionnaires. We include a set of demographic variables considered as traditional predictors for the preferences – age, sex, education. Existing research shows that women are more in favor of income redistribution than men[12] so we include a dummy variable that takes value 1 if the respondent is male. Persons with higher education could, in general, have more information about public spending practices and could be more informed about the country’s tax system[37]. Further, persons who are more informed about the tax system might be more comfortable with the current distribution of taxes[38, 39]. To capture this, we create a series of dummy variables referring to persons’ educational attainment. We distinguish between no formal education, primary, lower secondary, upper secondary (reference value), post-secondary (non-tertiary) and tertiary education. It is assumed that with age people are more aware of the benefits of government services, through the increased need for the security of their pension funds, availability of adequate health care and in general increased demand for social protection[19]. People who have lived in the pre-transition period might be additionally more inclined to favor a more generous welfare system[40]. We include dummy variables for the persons aged 18-25, 26-35, 36-45 (reference category), 46-55, 56-65 and older than 66.

People are influenced by their self-interest – they position themselves in a certain income group and favor taxes that are more beneficial for this income group[41-43]. In other words, if the respondent believes that she is at the lower end of the social scale, the probability that she is more sensitive to the tax burden of the lower-income population is higher. Similarly, respondents who believe that they belong to the higher income group might consider taxes to be too high for middle and high-income groups. To operationalize this issue, we include a dummy variable for each decile of self-perceived social status. The middle position in the scale is considered as a reference value.

Unemployed persons might be in favor of progressive taxation because they are aware that welfare policies rely on government revenues[44]>. We additionally consider employees working in the public sector as more in favor of progressive taxation. The underlying assumption is that persons working in the public sector might be aware that their wages are dependent on government revenues, so they could have different perceptions related to the tax burden. In each case, if a person has responded to be in any of the statuses described above, the value of the variable takes value 1.

Trade unions participate in wage negotiations and frequently need to motivate their members to take some actions. In this process, they could gently persuade their members to slightly modify their original views. This is not to say that unions are in general pro or against certain models of taxation, but it could be the case that taxation policy fits into the current wage negotiations process to some extent. The members could be more informed either about the current state of the taxation system or announced reforms, than persons who are not union members. We included a dummy variable taking value 1 if a person is currently a trade union member. Previous research has documented that political preferences are directly related to the degree of preferences for the role of government. Left-wing individuals support the stronger role of the government, while right-wing individuals believe that less government involvement is needed[34]. These aspirations are not only relevant on a general level, but political parties very frequently address specific population subgroups they consider to be their main pool of voters. Thus, political orientation can be an indicator of additional sensitivity towards specific population subgroup and persons can be more or less sensitive towards the tax burden of a specific population subgroup. We include the following dummy variables: far left, left, center (reference value), right and far-right.

Studies have also found that people who in general have higher trust in government are more likely to be in favour of progressive taxation[45]> based on the assumption that citizens trust government to perform fair redistribution. Respondents were asked to assess whether people should obey the law without exception (and we include this by incorporating the dummy variable that takes the value 1 if they responded positively to this question). The argument is that if they, in general, believe that the legal system is appropriate, they would be more in favor of progressive taxation because they can see the rationale for the use of funds. On the opposite side, if citizens believe that political corruption is widespread, they are more likely to consider that the funds collected through the taxes are misplaced. To capture political corruption perception, we include a dummy variable taking value 1 if a person believes that quite a lot or almost all politicians are involved in corruption.

Following the literature on decoupling between the desire for more redistribution and the perception of an already high tax burden[17, 19] we include a variable that captures the perceptions on the current state in the country. Tax level variable is the average of assessment (5 points Likert scale from 1 – much too low, to 5 – much too high) of the current tax burden for all income groups (low, middle and high income). Thus, the higher the average, the more a person believes that the current tax level in the country is already high.

Institutional settings differ among the countries. The existing institutional setting affects people’s expectations. For example, if the education or pension system is mostly provided by the private sector, citizens will not consider the increased need for funding these systems related to the redistributive role of the government. To capture institutional differences between the countries, we include country dummy variables.

We analyze two groups of countries separately, applying the same methodology. As a first step in the analysis, we perform correlation analysis to check for multicollinearity (Table 2 in the Appendix), with the result that the correlation between independent variables is low. Since our dependent variable is binary (whether a person is in favor of more progressive taxation equals 1, otherwise equals 0), we estimate a probit model. Specifically, we estimate the following equations in two separate periods (2006 and 2016).

The equation for Old European countries is following (indexing omitted for a clearer presentation):

𝑃𝑟(𝑝𝑟𝑜𝑔𝑟𝑒𝑠𝑠𝑖𝑣𝑒 = 1) = 𝛷(𝑐𝑜𝑛𝑠𝑡𝑎𝑛𝑡 + 𝛽1𝑎𝑔𝑒18 − 25 + 𝛽2𝑎𝑔𝑒26 − 35 + 𝛽3𝑎𝑔𝑒46 − 55 + 𝛽4𝑎𝑔𝑒56 − 65 + 𝛽5𝑚𝑎𝑙𝑒 + 𝛽6𝑝𝑢𝑏𝑙𝑖𝑐 − 𝑤𝑜𝑟𝑘 + 𝛽7𝑢𝑛𝑒𝑚𝑝𝑙𝑜𝑦 + 𝛽8𝑐𝑢𝑟𝑟𝑒𝑛𝑡 − 𝑢𝑛𝑖𝑜𝑛 + 𝛽9𝑝𝑜𝑙𝑖𝑡𝑖𝑐𝑎𝑙 − 𝑐𝑜𝑟𝑟𝑢𝑝𝑡𝑖𝑜𝑛 + 𝛽10𝑜𝑏𝑒𝑦 − 𝑙𝑎𝑤 + 𝛽11𝑡𝑎𝑥 − 𝑙𝑒𝑣𝑒𝑙 + 𝛽12𝑛𝑜𝑒𝑑𝑢𝑐𝑎𝑡𝑖𝑜𝑛 + 𝛽13𝑝𝑟𝑖𝑚𝑎𝑟𝑦 + 𝛽14𝑙𝑜𝑤𝑒𝑟 − 𝑠𝑒𝑐 + 𝛽15𝑝𝑜𝑠𝑡 − 𝑠𝑒𝑐 + 𝛽16𝑡𝑒𝑟𝑡𝑖𝑎𝑟𝑦 + 𝛽17𝑓𝑎𝑟 − 𝑙𝑒𝑓𝑡 + 𝛽18𝑙𝑒𝑓𝑡 + 𝛽19𝑟𝑖𝑔ℎ𝑡 + 𝛽20𝑓𝑎𝑟 − 𝑟𝑖𝑔ℎ𝑡 + 𝛽21𝑠𝑝𝑠𝑠1 + 𝛽22𝑠𝑝𝑠𝑠2 + 𝛽23𝑠𝑝𝑠𝑠3 + 𝛽24𝑠𝑝𝑠𝑠4 + 𝛽25𝑠𝑝𝑠𝑠6 + 𝛽26𝑠𝑝𝑠𝑠7 + 𝛽27𝑠𝑝𝑠𝑠8 + 𝛽28𝑠𝑝𝑠𝑠9 + 𝛽29𝑠𝑝𝑠𝑠10 + 𝛽30𝐷𝐾 + 𝛽31𝐹𝐼 + 𝛽32𝐸𝑆 + 𝛽33𝐹𝑅 + 𝛽34𝑆𝐸)

The equation for New European countries is the following:

𝑃𝑟(𝑝𝑟𝑜𝑔𝑟𝑒𝑠𝑠𝑖𝑣𝑒 = 1) = 𝛷(𝑐𝑜𝑛𝑠𝑡𝑎𝑛𝑡 + 𝛽1𝑎𝑔𝑒18 − 25 + 𝛽2𝑎𝑔𝑒26 − 35 + 𝛽3𝑎𝑔𝑒46 − 55 + 𝛽4𝑎𝑔𝑒56 − 65 + 𝛽5𝑚𝑎𝑙𝑒 + 𝛽6𝑝𝑢𝑏𝑙𝑖𝑐 − 𝑤𝑜𝑟𝑘 + 𝛽7𝑢𝑛𝑒𝑚𝑝𝑙𝑜𝑦 + 𝛽8𝑐𝑢𝑟𝑟𝑒𝑛𝑡 − 𝑢𝑛𝑖𝑜𝑛 + 𝛽9𝑝𝑜𝑙𝑖𝑡𝑖𝑐𝑎𝑙 − 𝑐𝑜𝑟𝑟𝑢𝑝𝑡𝑖𝑜𝑛 + 𝛽10𝑜𝑏𝑒𝑦 − 𝑙𝑎𝑤 + 𝛽11𝑡𝑎𝑥 − 𝑙𝑒𝑣𝑒𝑙 + 𝛽12𝑛𝑜𝑒𝑑𝑢𝑐𝑎𝑡𝑖𝑜𝑛 + 𝛽13𝑝𝑟𝑖𝑚𝑎𝑟𝑦 + 𝛽14𝑙𝑜𝑤𝑒𝑟 − 𝑠𝑒𝑐 + 𝛽15𝑝𝑜𝑠𝑡 − 𝑠𝑒𝑐 + 𝛽16𝑡𝑒𝑟𝑡𝑖𝑎𝑟𝑦 + 𝛽17𝑓𝑎𝑟 − 𝑙𝑒𝑓𝑡 + 𝛽18𝑙𝑒𝑓𝑡 + 𝛽19𝑟𝑖𝑔ℎ𝑡 + 𝛽20𝑓𝑎𝑟 − 𝑟𝑖𝑔ℎ𝑡 + 𝛽21𝑠𝑝𝑠𝑠1 + 𝛽22𝑠𝑝𝑠𝑠2 + 𝛽23𝑠𝑝𝑠𝑠3 + 𝛽24𝑠𝑝𝑠𝑠4 + 𝛽25𝑠𝑝𝑠𝑠6 + 𝛽26𝑠𝑝𝑠𝑠7 + 𝛽27𝑠𝑝𝑠𝑠8 + 𝛽28𝑠𝑝𝑠𝑠9 + 𝛽29𝑠𝑝𝑠𝑠10 + 𝛽30𝐶𝑍 + 𝛽31𝐻𝑅 + 𝛽32𝐿𝑉 + 𝛽33𝑆𝐼

For ease of interpretation, the marginal effects are presented in the next section. The full set of estimated coefficients of the probit models and accompanied diagnostics are in Table 3 in the Appendix.

RESULTS

Based on the methodology described above, we present the marginal effects of the estimates in Table 1. Estimated coefficients, robust standard errors and diagnostics of the underlying probit models are in Table 3 in the Appendix.

From the results presented in Table 3 in the Appendix, we can note that the numbers of observations as well as the overall fit of the estimates are higher for Old European countries than for New Europe. This would suggest that in New Europe there are additional variables not included in the present analysis that could offer additional insights on why the citizens are in favor of more progressive taxation.

Table 1. Revealed preferences for progressive taxation, marginal effects.
VARIABLES20062016
New EUOld EUNew EUOLD EU
Ageage 18_25–0,0140–0,0442*–0,0324–0,0609**
-0,0244-0,0237-0,0275-0,0277
age 26_35–0,00735–0,02160,0149–0,0477**
-0,0228-0,0188-0,0223-0,0227
age 46_550,0400*0,0364**0,0799***0,0658***
-0,0213-0,0174-0,0203-0,019
age 56_650,0724***0,0836***0,0706***0,0955***
-0,0216-0,0176-0,0208-0,0188
age 660,0575**0,112***0,0733***0,137***
-0,0237-0,0181-0,0224-0,0183
GenderMale–0,0104–0,0243**–0,0270*–0,0121
-0,0138-0,0113-0,014-0,0124
Work statuspublic_worker0,0424***0,0314**0,003740,0372***
-0,0156-0,0136-0,0161-0,0139
unemployed–0,006380,0509**–0,007880,0256
-0,0289-0,0257-0,0273-0,029
current_union_member0,02160,0317**–0,02280,0375**
-0,023-0,0152-0,0262-0,0156
Trust in governmentpolitical_corruption0,0992***0,0441***0,0360**0,0155
-0,0144-0,0133-0,0156-0,0163
obey_law0,00197–0,0125–0,01790,0132
-0,0138-0,0122-0,0143-0,013
Perceptions on the current tax leveltax_level0,201***0,124***0,201***0,207***
-0,0156-0,011-0,0165-0,0143
EducationNo education–0,03770,00884–0,0985–0,0800
-0,0474-0,0333-0,105-0,0517
primary0,008910,0657***–0,05490,0738***
-0,0205-0,0194-0,091-0,0284
lower_sec0,0493***0,0805***0,007360,0534**
-0,0182-0,017-0,017-0,0212
post_sec–0,00608–0,0515***–0,03240,0131
-0,0289-0,0196-0,0296-0,0232
tertiary–0,0660***–0,0956***–0,0186–0,0635***
-0,0251-0,0203-0,0206-0,0194
Political orientationfar_left0,03550,172***0,147***0,125***
-0,0355-0,0196-0,0383-0,0206
left–0,0453**0,0919***0,0410**0,106***
-0,0217-0,0133-0,0207-0,0154
right–0,0307–0,128***0,00231–0,0962***
-0,0191-0,0161-0,0177-0,0167
far_right–0,0659–0,0497–0,05620,0355
-0,0667-0,0376-0,0581-0,0269
Self-perceived social statusspss10,0612*0,120***–0,02190,128***
-0,035-0,0434-0,0537-0,0415
spss20,04620,105***0,02150,121***
-0,0295-0,0343-0,0453-0,0396
spss30,0408*0,02680,0448*0,0784***
-0,0217-0,0242-0,0257-0,0274
spss40,0516***0,02540,0503**0,0459**
-0,019-0,0198-0,0217-0,0226
spss60,00234–0,0538***–0,0152–0,0227
-0,0209-0,016-0,0209-0,0183
spss7–0,00963–0,137***–0,0359–0,0775***
-0,0268-0,0198-0,023-0,0201
spss8–0,0371–0,171***–0,0801**–0,145***
-0,0394-0,0253-0,0335-0,0246
spss9–0,157*–0,306***–0,123*–0,222***
-0,0947-0,0481-0,0704-0,0481
spss10–0,0623–0,276***–0,0451–0,212***
-0,133-0,0692-0,0816-0,072
Country dummiesCountry dummies – New EuropeYesNoYesNo
Country dummies – Old EuropeNoYesNoYes

*statistically significant at 10 %

**statistically significant at 5 %

***statistically significant at 1 %

AGE AND PREFERENCES FOR MORE PROGRESSIVE TAXATION

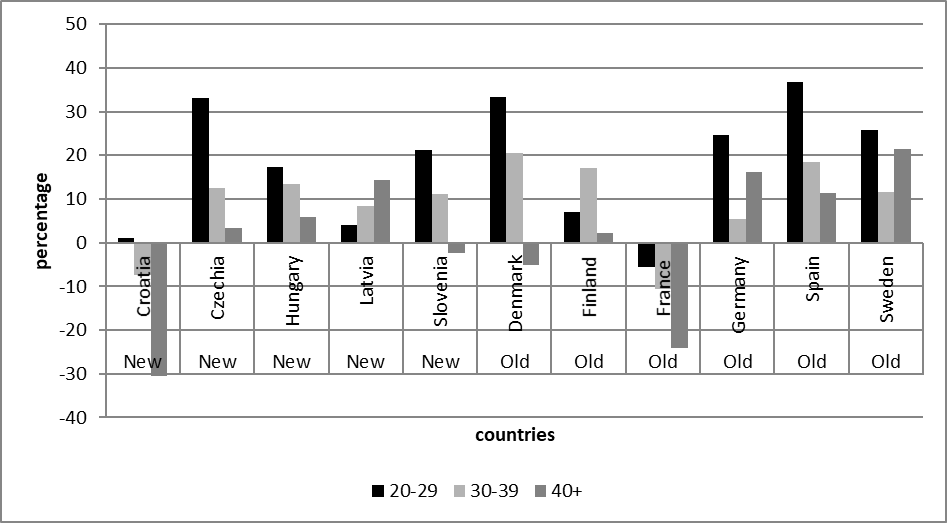
Our results confirm predictions that older citizens will be more inclined towards progressive taxation. However, the comparison of estimated marginal effects between Old and New Europe does not suggest that this is more pronounced in post-transition economies. The average results obtained through the estimation conceal the heterogeneous dynamics within the countries. Figure 2 presents cohorts according to their age in the year 1990 and depicts changes in their attitudes towards progressive taxation between 2006 and 2016. Only in the case of Latvia, we can see that the cohorts that have lived longer under the socialist system are through time (as their demand for government services increases) voicing stronger preferences for more progressive taxation. Within Old Europe, France is an interesting case where older cohorts are less likely to be in favor of more progressive taxation and this dislike increases in the period after 2008 crisis.

Figure 2. Changes in attitudes towards more progressive taxation between 2006 and 2016, according to the cohorts’ age group in 1990 [35, 36].
indecs-19-328-g2.png

RELATIONSHIP BETWEEN PERCEPTIONS OF CURRENT TAX LEVEL AND PREFERENCE FOR PROGRESSIVE TAXATION

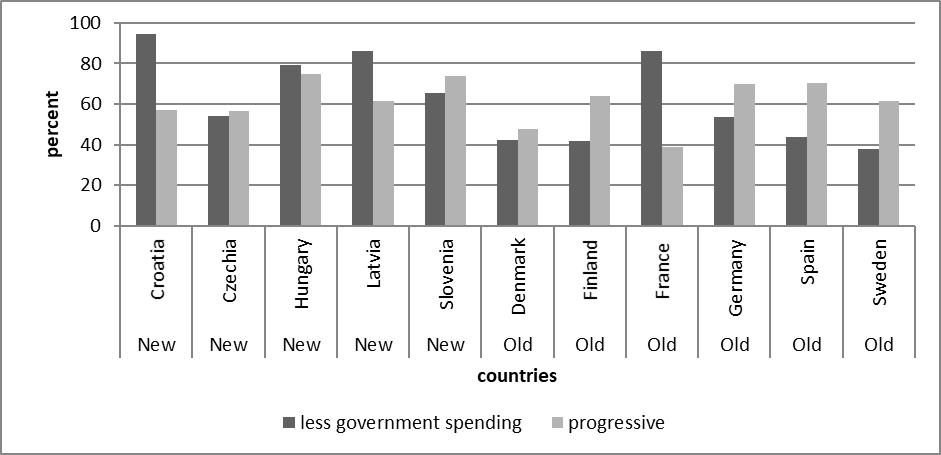
Another important result that we have found across the country groups and analyzed periods is that those in favor of more progressive taxation are also more likely to consider that the existing tax burden is already high. This apparently illogical result is explained in the literature with the notion that while citizens might be in favor of redistribution, they are less likely to support the same views when confronted with the specific situation[46]. Since demand for government services is often greater than the willingness to pay for them[47] when individuals are confronted to prioritize between different government expenditures, research shows that they express high levels of support for the increase in expenditures on education[48]. In our case, it could be illustrated with the desire to cut government spending. In general, the desire to reduce government spending is higher in the analyzed New European economies than in Old European economies, with the exception of France (Figure 3). However, there is no correlation with the current perceived level of taxation or with the desire for more progressive taxation.

Figure 3. Share of respondents in favor of more progressive taxation and less government spending [35].

[35]

indecs-19-328-g3.png

TRUST IN GOVERNMENT AND PREFERENCES FOR MORE PROGRESSIVE TAXATION

Another frequently discussed feature of post-transition societies is relatively high (perception of) corruption. In accordance with the assumptions, this factor is more important for people’s attitudes towards more progressive taxation in post-transition economies than in Old European countries. Indeed, it becomes non-significant for Old member states in the period after the financial crisis. It is, however, not clear what are the mechanisms that link the perception of corruption to favoring more progressive taxation. It could be the case that due to high influence of the government in the society as well as political corruption, there is an expressed preference for the decrease of these aspects of government. This also puts in doubt the fairness of the existing redistributive system, since the desire for more progressive taxation is the result of both self-interest and fairness motives[49]. If citizens are more in favor of redistribution, but at the same time believe that the current system is not delivering due to corruption, the correlation of two variables might not capture the causation effect properly. Thus, to confirm such assumptions for this complex issue, a more detailed survey focused on the post-transition economies should be performed.

WORK STATUS AND PREFERENCES FOR MORE PROGRESSIVE TAXATION

Surprisingly, inability to earn for a living, as indicated by the respondent’s unemployment status, was a significant predictor for more progressive taxation preferences only in the case of Old Member States prior to the 2008 crisis. The fact that it was not found important in other specifications is probably related to the fact that with the rise of unemployment as a consequence of the crisis, a certain proportion of the unemployed lost faith in the redistributive power of the government. Vanishing support of public workers for more progressive taxation in New Members after the crisis could also be attributed to the austerity measures many governments took, typical ones being decreasing (or freezing) the public sector wages and reducing or prohibiting new public sector employment.

EDUCATION AND POLITICAL ORIENTATION IN RELATION TO PREFERENCES FOR MORE PROGRESSIVE TAXATION

While in term of education there seems to be a similarity between Old and New Europe, there are no such similarities when it comes to political parties. The preferences in Old Europe are consistent with the expectations – left-oriented voters are more in favor of progressive taxation, while right-oriented voters oppose such intentions. However, the situation is not that simple in New Europe. Although beyond the scope of this specific article, the result is probably related to the fact that political parties in Eastern Europe have still not been associated with specific economic policies and measures, but the predominate political discussion still revolves around the communist legacy.

SELF-PERCEIVED SOCIAL STATUS AND PREFERENCES FOR PROGRESSIVE TAXATION

Finally, our results suggest that both within Old and within New Europe, those with higher self-perceived social status are usually against more taxation, while those with lower self-perceived social status are in favor of redistribution. Thus, certain social tensions exist in both groups of countries. Perhaps somewhat surprisingly, union membership is significantly associated with an inclination towards more progressive taxation in Old EU, but not in post-transition economies. This could be a direct consequence of the trade unions transformation through the transition process[50] from a virtually monopolistic role to the competition for the union membership.

According to results, it seems that differences between the Old and New Europe are rather small and that there are much more similarities than differences in factors predicting tax burden preferences. At one side, our results confirm the arguments that there is a convergence of tax burden preferences in Old and New Europe[51]. On the other side, our results also suggest that there are still important heterogeneities within Old and within New European member states.

DISCUSSION AND THE IMPLICATIONS OF THE RESULTS

Our research results contribute to the previous literature on tax preferences of European citizens. On the aggregate level, we have confirmed previous findings on the heterogeneity of the citizens’ preferences for government redistributive policies[29]. Although some studies suggest that there are important factors leading to the special position of the post-transition countries[2-4], we were not able to detect any unambiguous pattern emerging in the more recent period. This prompted a hypothesis of preferences’ convergence. Although there is still a possibility of harmonizing effects stemming from the European Union, we were not able to clearly document the convergence process. We suspect that the period under analysis in the present paper is too short for convergence factors to have a dominant effect on the underlying processes. We have explored a variety of factors contributing to the personal preferences for the redistributive role of the government. Following previous literature[12], our results confirm that personal characteristics, such as age, are important predictors of tax preferences. However, while studies that rely on earlier datasets[1] suggest that the longer a cohort lived under communism, the more it sees redistribution as an important task of the government, our results do not point in that direction. We believe that since our sample is more recent, the effects of living under a socialist regime have been worn-out.

Another important socioeconomic characteristic is the educational attainment of the respondent. The literature suggests that higher the level of education is, the more person is informed about the current tax system[37] and is more supportive of the existing redistribution mechanisms[39]. On the other hand, higher education is frequently associated with higher income. Persons in the higher-income group favor taxes beneficial for their income group[43]. Based on these findings, we would expect that persons with the education level less than upper secondary (a reference group in our estimation) are more in favor of progressive taxation, while those with education higher than upper secondary would be more against. Our results are in line with the expectations, in particular in the case of older European Union members where the estimates are consistently significant in the period before and after 2008 crisis. For New member states, the pattern disappears after the crisis. We suspect that the labor market distortions as a consequence of crisis were more severe in New member states. This latter finding is somewhat supported by our results related to the work status of the respondents. For New member states, we did not find any significance of unemployment or union membership. Even though the literature suggests that unemployed persons might be more in favor of progressive taxation[44] we suggest that in case of post-transition societies the restructuring process created large pools of discouraged workers. In these circumstances, the role of the government becomes illusive, because the effects of redistribution policies are not directly observed. Since unemployed persons are not actually receiving income, they might favor certain policies in general, but do not experience the effects of the policy measures directly. This is somewhat related to the self-perceived social status, where the literature suggests that the income group a person is self-identified with would be the target group for evaluating government policy actions[41, 42] In this respect, our results are in line with the literature – those with lower income are more in favor of more progressive taxation, while those with higher income are against more progressive taxation because they expect the effect of the redistribution will be at their cost. Although general patterns are the same in both groups of countries, the significance is generally more apparent in Old EU member states. This would imply that this pattern is fully developed in market economies, but in post-transition economies, a different view of the redistributive role of the government might still linger on. Different factors can affect such result – from the specificities of the wage bargaining system to the amount of public services provided by the government sector. This issue deserves deeper inspection on a country level and cannot be assessed jointly for a group of countries. A similar argument can be expressed for the political orientation of the individuals. Literature generally claims that left-wing oriented individuals are, in general, supporters for the stronger role of the government[34]. Our findings support the literature in the case of Old EU member states. However, in the case of post-transition countries, this pattern cannot be observed. We speculate that this is because the political spectrum, in general, is not focused on the economic issues or the role of government. For example, contrary to expectations, in Croatia, it is the right-wing oriented government that is associated with increased pressure to government budget related to the specific demands from the interest groupings such as war veterans. Presented results can be associated with several contributions to the literature. First, we have clearly documented that heterogeneities between the countries regarding the redistributive role of the government persist even in the period after the global financial crisis[5]. Second, although post-transition countries differ between themselves, they in many aspects resemble their more market-oriented EU members. Specifically, it seems that taxation policy in each country as well as other aspects of the functioning of the economy and probably government sector, in particular, are more relevant than personal characteristics for the formation of individuals’ preferences for more progressive taxation.

In general, we have documented that the factors contributing to the preference for a more redistributive role of the government are similar in post-transition and market economies. It is interesting to note that across all the country groupings and all the periods, we have confirmed that even though individuals believe that general tax level is high[39, 52] they are still supporting more progressive taxation. We suggest that this is related to the perceived quality of services provided by the government sector. It could be the case that the citizens would not oppose higher taxation, had they been convinced that the government can organize fair redistribution. Important limitations of the results presented in this article are related to the data source used for the empirical analysis. Although comparative datasets suitable for exploring different aspects of preferences for redistribution systems are scarce, we do believe that ISSP provides a good basis for analyzing this set of research questions. Even though it can be argued that preferences are not easily changed and that factors contributing to preference formation could be more or less stable, we still strongly believe that there are some global incidences capable to cause significant disturbances in preferences for the redistributive role of government. One example has been implicitly covered by our analysis – the global financial crisis. However, even more distortive effect is expected in the aftermath of the global pandemic crisis. Thus, there is a need for a more frequent collection of data to be able to promptly capture the effects. Another concern is directly related to our results, but also to findings from previous research. Specifically, we have confirmed important heterogeneities between the countries. Still, our analysis does not include all European Union members. In order to explore the possibilities of convergence within the European Union, it would be preferable to obtain a dataset covering all the countries.

Regardless of these constraints, we believe that our results can be associated with some practical implications. First, we believe that this is an important research question in the future discussions on the possibilities of a fiscal union within Europe. However, we acknowledge the low probability that the fiscal union issue will be determined in a nearby future. The issue of disharmonizing preferences for different types of taxations will probably arise sooner in the context of sharing the economic consequences of the global pandemic. It has been seen that such questions have been raised in the context of the issuance of COVID-19 related EU bonds. In order to provide adequate policy measures, government officials must be presented with relevant research results based on the most recent dataset covering all EU countries.

CONCLUSIONS

The aim of the article is to analyze the perceptions of the EU citizens on the existing tax burden and preferences for more progressive taxation. In acknowledgement of the specific role that history, culture, political ideology and a perception of fairness have in determining personal attitudes towards inequalities, we separately analyze New and Old Member States. The specific contribution of the article lies in the documentation of the evolution of preferences for more progressive taxation in post-transition economies. Another contribution is related to the comparative inspection of the factors contributing to preferences in post-transition European economies relative to the established market European economies. The time dimension of the data, furthermore, enables discussion of potential convergence of preferences between Old and New European member states.

Although the period of ten years is relatively short when analyzing the formation of preferences, the specific period analyzed in this article entails a disruptive episode connected to the effects of the global financial crisis. The crisis itself was associated with austerity measures proposed by many governments. Yet, we did not find any systematic differences in the preferences or their factors, in the period before and after the crisis. Contrary to some previous findings, we do not find the effect of the socialist legacy system in New Europe, in a way that older cohorts experiencing life in a previously presumably more generous and egalitarian system would be disproportionally more in favor of progressive taxation than the same age cohorts in Old Europe[40]. We also do not find that political orientation in New Europe supports the traditional left-orientation-more government pattern that can be found in the data for Old Europe. We also do not find the important contribution of the trade unions membership for progressive taxation and the higher redistributive role of the government in the New EU. Thus, although the overall patterns of tax preferences are predominately under the influence of a specific country redistributive policies and the scope of services the government provides, the analysis of factors behind aggregate results provided interesting insights into specific features of the post-transition societies. Our findings do corroborate the notion that there is heterogeneity between the countries[5], but there are no specific traits of post-transition societies in that respect.

The issue of rising income inequalities and the appropriate role of the government featured many recent public debates on the global level. For the European Union, the importance of these topics is additionally related to the question of potential future harmonization of fiscal policies. Results presented in this study emphasize the heterogeneity of European citizens when it comes to their preferences for more progressive taxation. It has been clearly documented that almost every country has its specificities. Thus, the path towards the common fiscal policies in a unified Europe is very likely to be a long and winding one. Limitations of the findings are related to the dataset used. While it is the most recent ISSP study on the role of government, at the time of performing the analysis it has already been relatively outdated. Certainly, preferences for the role of government have been dramatically changed during the COVID-19 crisis in all economies. The full extent of this change is yet to be revealed.

The analysis in this article provides a glimpse into differences for tax preferences of European citizens. Certainly, additional research efforts are required. In order to provide specific policy recommendations on the European level, the comparable survey should be carried in all member states. While the desire to cut government spending is higher in the analyzed New European economies, it remains open how to incorporate the detrimental influence of corruption on the citizens’ desire for more progressive taxation. This issue is left for future research endeavors.

REMARKS

1 The dataset used, as well as complete documentation including the questionnaires in national languages, is available here: https://www.gesis.org/issp/modules/issp-modules-by-topic/role-of-government/2006.

2 The dataset used, as well as complete documentation including the questionnaires in national languages, is available here: https://www.gesis.org/issp/modules/issp-modules-by-topic/role-of-government/2016.

Appendices

Appendix

Table 2. Correlation matrix.
Old European member states, year 2006AgeAgeAgeAgeage66malepublic_unemployCurrentpolitical_obey_lawtax_levelnoeducationprimarylower_sec
18_2526_3546_5556_65work_unioncorruption
age18_251-0,132-0,152-0,147-0,146-0,014-0,0730,024-0,0930,019-0,0490,0180,024-0,0960,014
age26_35 -0,1321-0,214-0,207-0,205-0,007-0,0320,04900,043-0,0090,043-0,073-0,1460,001
age46_55 -0,152-0,2141-0,238-0,236-0,0180,070,020,112-0,004-0,003-0,025-0,062-0,0220,044
age56_65 -0,147-0,207-0,2381-0,22800,058-0,0120,063-0,036-0,014-0,033-0,0050,098-0,024
age66 -0,146-0,205-0,236-0,22810,053-0,044-0,106-0,17-0,0180,047-0,0080,1870,273-0,108
male -0,014-0,007-0,01800,0531-0,119-0,012-0,0210,019-0,031-0,0070,0230,014-0,001
public_work -0,073-0,0320,070,058-0,044-0,1191-0,0610,26-0,104-0,057-0,052-0,077-0,136-0,06
unemploy 0,0240,0490,02-0,012-0,106-0,012-0,0611-0,0450,040,002-0,02-0,0050,0120,075
current_union -0,09300,1120,063-0,17-0,0210,26-0,0451-0,217-0,022-0,029-0,104-0,127-0,062
political_corruption 0,0190,043-0,004-0,036-0,0180,019-0,1040,04-0,21710,0220,0460,0380,0420,086
obey_law -0,049-0,009-0,003-0,0140,047-0,031-0,0570,002-0,0220,02210,0340,0580,033-0,014
tax_level0,0180,043-0,025-0,033-0,008-0,007-0,052-0,02-0,0290,0460,03410,046-0,0380,009
noeducation0,024-0,073-0,062-0,0050,1870,023-0,077-0,005-0,1040,0380,0580,0461-0,099-0,116
primary -0,096-0,146-0,0220,0980,2730,014-0,1360,012-0,1270,0420,033-0,038-0,0991-0,292
lower_sec 0,0140,0010,044-0,024-0,108-0,001-0,060,075-0,0620,086-0,0140,009-0,116-0,2921
post_sec -0,0240,0680,017-0,012-0,095-0,0610,132-0,0270,169-0,10100-0,085-0,214-0,25
tertiary -0,070,1040,02-0,022-0,0880,0130,161-0,0410,05-0,065-0,071-0,008-0,089-0,223-0,262
far_left0,007-0,0320,0620,001-0,028-0,0020,0660,0230,0830,003-0,029-0,106-0,028-0,033-0,015
left -0,013-0,0290,030,022-0,01-0,010,063-0,0290,040,004-0,01-0,103-0,0160,0170,014
right-0,033-0,003-0,0370,0240,0420,048-0,029-0,05-0,008-0,0940,0130,11-0,06-0,042-0,047
far_right 0,009-0,022-0,0130,0020,0370,020,008-0,0080,0350,0010,020,0470,001-0,006-0,026
spss1 -0,017-0,0260,0090,0290,0110,002-0,0120,055-0,0330,0470,0070,0020,0470,039-0,009
spss2 -0,003-0,0120,0010,0160,021-0,009-0,0010,07-0,020,045-0,025-0,0230,0270,0970,001
spss3 0,003-0,0230,006-0,0030,028-0,024-0,0290,056-0,060,066-0,019-0,0120,0610,080,039
spss4 -0,017-0,0080,004-0,0150,025-0,006-0,0410,029-0,0570,0660,006-0,0090,0780,0650,057
spss6 0,0040,016-0,002-0,009-0,014-0,0050,041-0,0250,031-0,0520,003-0,003-0,069-0,0440,015
spss7 -0,0020,027-0,004-0,009-0,0460,0310,055-0,0570,08-0,082-0,0360,003-0,063-0,098-0,089
spss8 0,002-0,0060,0070,016-0,0240,0190,05-0,050,096-0,097-0,0270,044-0,036-0,09-0,08
spss9-0,021-0,0160,0180,003-0,010,0260,003-0,0030,034-0,028-0,010,041-0,018-0,042-0,042
spss100,002-0,0220,025-0,007-0,0070,0190,017-0,0110,044-0,0240,0030,03500,009-0,026
Old European member states, year 2006post_sectertiaryfar_leftleftrightfar_rightspss1spss2spss3spss4spss6spss7spss8spss9spss10
age18_25-0,024-0,070,007-0,013-0,0330,009-0,017-0,0030,003-0,0170,004-0,0020,002-0,0210,002
age26_35 0,0680,104-0,032-0,029-0,003-0,022-0,026-0,012-0,023-0,0080,0160,027-0,006-0,016-0,022
age46_55 0,0170,020,0620,03-0,037-0,0130,0090,0010,0060,004-0,002-0,0040,0070,0180,025
age56_65 -0,012-0,0220,0010,0220,0240,0020,0290,016-0,003-0,015-0,009-0,0090,0160,003-0,007
age66 -0,095-0,088-0,028-0,010,0420,0370,0110,0210,0280,025-0,014-0,046-0,024-0,01-0,007
male -0,0610,013-0,002-0,010,0480,020,002-0,009-0,024-0,006-0,0050,0310,0190,0260,019
public_work 0,1320,1610,0660,063-0,0290,008-0,012-0,001-0,029-0,0410,0410,0550,050,0030,017
unemploy -0,027-0,0410,023-0,029-0,05-0,0080,0550,070,0560,029-0,025-0,057-0,05-0,003-0,011
current_union 0,1690,050,0830,04-0,0080,035-0,033-0,02-0,06-0,0570,0310,080,0960,0340,044
political_corruption -0,101-0,0650,0030,004-0,0940,0010,0470,0450,0660,066-0,052-0,082-0,097-0,028-0,024
obey_law 0-0,071-0,029-0,010,0130,020,007-0,025-0,0190,0060,003-0,036-0,027-0,010,003
tax_level0-0,008-0,106-0,1030,110,0470,002-0,023-0,012-0,009-0,0030,0030,0440,0410,035
noeducation-0,085-0,089-0,028-0,016-0,060,0010,0470,0270,0610,078-0,069-0,063-0,036-0,0180
primary -0,214-0,223-0,0330,017-0,042-0,0060,0390,0970,080,065-0,044-0,098-0,09-0,0420,009
lower_sec -0,25-0,262-0,0150,014-0,047-0,026-0,0090,0010,0390,0570,015-0,089-0,08-0,042-0,026
post_sec 1-0,1920,043-0,0420,0670,017-0,02-0,035-0,053-0,0370,0320,0750,0680,011-0,009
tertiary -0,19210,01400,036-0,04-0,031-0,049-0,089-0,0990,0140,1460,1660,0980,037
far_left0,0430,0141-0,173-0,133-0,0430,0090,0170,0170,002-0,0160,019-0,01-0,019-0,01
left -0,0420-0,1731-0,316-0,1020,004-0,0010,0070,0440,028-0,04-0,043-0,024-0,018
right0,0670,036-0,133-0,3161-0,079-0,046-0,055-0,066-0,0780,0270,0980,1230,0650,025
far_right 0,017-0,04-0,043-0,102-0,0791-0,0030,0010,02-0,0210,010,012-0,0180,0220,007
spss1 -0,02-0,0310,0090,004-0,046-0,0031-0,022-0,036-0,047-0,077-0,053-0,037-0,015-0,01
spss2 -0,035-0,0490,017-0,001-0,0550,001-0,0221-0,047-0,061-0,1-0,069-0,048-0,02-0,014
spss3 -0,053-0,0890,0170,007-0,0660,02-0,036-0,0471-0,099-0,161-0,112-0,077-0,032-0,022
spss4 -0,037-0,0990,0020,044-0,078-0,021-0,047-0,061-0,0991-0,212-0,147-0,101-0,042-0,029
spss6 0,0320,014-0,0160,0280,0270,01-0,077-0,1-0,161-0,2121-0,24-0,165-0,068-0,047
spss7 0,0750,1460,019-0,040,0980,012-0,053-0,069-0,112-0,147-0,241-0,115-0,047-0,032
spss8 0,0680,166-0,01-0,0430,123-0,018-0,037-0,048-0,077-0,101-0,165-0,1151-0,033-0,022
spss90,0110,098-0,019-0,0240,0650,022-0,015-0,02-0,032-0,042-0,068-0,047-0,0331-0,009
spss10-0,0090,037-0,01-0,0180,0250,007-0,01-0,014-0,022-0,029-0,047-0,032-0,022-0,0091
New European member states, year 2006AgeAgeAgeAgeAgemalepublic_unemploycurrent_political_obey_tax_levelnoeducationprimarylower_sec
18_2526_3546_5556_6566workunioncorruptionlaw
age18_251-0,182-0,195-0,182-0,1890,068-0,2650,018-0,097-0,017-0,1030,074-0,064-0,028-0,08
age26_35 -0,1821-0,208-0,194-0,2020,005-0,1030,0360,0090,011-0,080,065-0,066-0,1050,012
age46_55 -0,195-0,2081-0,208-0,217-0,001-0,0140,0690,080,0110,015-0,013-0,0350,0040,055
age56_65 -0,182-0,194-0,2081-0,20200,128-0,033-0,0150,0090,043-0,0390,0140,0310,027
age66 -0,189-0,202-0,217-0,2021-0,0630,273-0,117-0,105-0,0380,144-0,080,2020,184-0,022
male 0,0680,005-0,0010-0,0631-0,120,008-0,0040,049-0,012-0,034-0,032-0,0810,122
public_work -0,265-0,103-0,0140,1280,273-0,121-0,0580,217-0,0250,095-0,0650,0430,01-0,067
unemploy 0,0180,0360,069-0,033-0,1170,008-0,0581-0,0710,051-0,0410,0210,0180,0650,013
current_union -0,0970,0090,08-0,015-0,105-0,0040,217-0,07110,027-0,018-0,006-0,032-0,049-0,03
political_corruption -0,0170,0110,0110,009-0,0380,049-0,0250,0510,0271-0,041-0,046-0,0060,024-0,019
obey_law -0,103-0,080,0150,0430,144-0,0120,095-0,041-0,018-0,0411-0,0640,0250,060,05
tax_level0,0740,065-0,013-0,039-0,08-0,034-0,0650,021-0,006-0,046-0,0641-0,026-0,014-0,066
noeducation-0,064-0,066-0,0350,0140,202-0,0320,0430,018-0,032-0,0060,025-0,0261-0,083-0,091
primary -0,028-0,1050,0040,0310,184-0,0810,010,065-0,0490,0240,06-0,014-0,0831-0,253
lower_sec -0,080,0120,0550,027-0,0220,122-0,0670,013-0,03-0,0190,05-0,066-0,091-0,2531
post_sec -0,0280,043-0,0110,003-0,006-0,0140,08100,0520,0220,015-0,049-0,049-0,136-0,149
tertiary -0,0910,090,0040,001-0,052-0,0110,126-0,0270,087-0,042-0,020,069-0,06-0,166-0,182
far_left-0,035-0,034-0,0220,0540,0770,0290,062-0,0150,006-0,0020,04-0,046-0,028-0,0190,068
left -0,074-0,0380,0390,0530,0440,0060,08500,013-0,0210,093-0,043-0,027-0,0120,036
right-0,0150,022-0,003-0,020,0090,043-0,0090-0,0040,0010,0110,010,0050,0180,019
far_right -0,007-0,002-0,0080,0030,0390,0090,021-0,016-0,006-0,021-0,017-0,0120,0020,0330,018
spss1 -0,044-0,0350,0040,0150,061-0,043-0,0110,059-0,0380,0580,001-0,0630,0220,118-0,009
spss2 -0,044-0,056-0,0050,0260,072-0,0030,0090,066-0,060,0160,0180,0140,1040,0820,011
spss3 -0,058-0,035-0,0010,0360,087-0,0240,0280,026-0,0210,0360,067-0,0130,0490,0780,102
spss4 -0,021-0,0440,030,0130,045-0,0190,023-0,017-0,026-0,0050,049-0,034-0,0050,0160,052
spss6 0,0290,0530,003-0,032-0,0870,0360,014-0,0310,048-0,014-0,0230,006-0,056-0,086-0,062
spss7 0,0850,058-0,015-0,037-0,0780,044-0,058-0,0320,011-0,007-0,009-0,002-0,045-0,076-0,081
spss8 0,10,039-0,022-0,044-0,0460,029-0,028-0,020,01-0,026-0,0270,047-0,026-0,03-0,036
spss90,0040,007-0,0110-0,0240,014-0,004-0,0110,031-0,031-0,0370,028-0,014-0,039-0,024
spss100,0090,016-0,017-0,004-0,0060-0,0090,016-0,0080,015-0,0130,0160,013-0,008-0,012
New European member states, year 2006post_sectertiaryfar_leftleftrightfar_rightspss1spss2spss3spss4spss6spss7spss8spss9spss10
age18_25-0,028-0,091-0,035-0,074-0,015-0,007-0,044-0,044-0,058-0,0210,0290,0850,10,0040,009
age26_35 0,0430,09-0,034-0,0380,022-0,002-0,035-0,056-0,035-0,0440,0530,0580,0390,0070,016
age46_55 -0,0110,004-0,0220,039-0,003-0,0080,004-0,005-0,0010,030,003-0,015-0,022-0,011-0,017
age56_65 0,0030,0010,0540,053-0,020,0030,0150,0260,0360,013-0,032-0,037-0,0440-0,004
age66 -0,006-0,0520,0770,0440,0090,0390,0610,0720,0870,045-0,087-0,078-0,046-0,024-0,006
male -0,014-0,0110,0290,0060,0430,009-0,043-0,003-0,024-0,0190,0360,0440,0290,0140
public_work 0,0810,1260,0620,085-0,0090,021-0,0110,0090,0280,0230,014-0,058-0,028-0,004-0,009
unemploy 0-0,027-0,01500-0,0160,0590,0660,026-0,017-0,031-0,032-0,02-0,0110,016
current_union 0,0520,0870,0060,013-0,004-0,006-0,038-0,06-0,021-0,0260,0480,0110,010,031-0,008
political_corruption 0,022-0,042-0,002-0,0210,001-0,0210,0580,0160,036-0,005-0,014-0,007-0,026-0,0310,015
obey_law 0,015-0,020,040,0930,011-0,0170,0010,0180,0670,049-0,023-0,009-0,027-0,037-0,013
tax_level-0,0490,069-0,046-0,0430,01-0,012-0,0630,014-0,013-0,0340,006-0,0020,0470,0280,016
noeducation-0,049-0,06-0,028-0,0270,0050,0020,0220,1040,049-0,005-0,056-0,045-0,026-0,0140,013
primary -0,136-0,166-0,019-0,0120,0180,0330,1180,0820,0780,016-0,086-0,076-0,03-0,039-0,008
lower_sec -0,149-0,1820,0680,0360,0190,018-0,0090,0110,1020,052-0,062-0,081-0,036-0,024-0,012
post_sec 1-0,098-0,010,0810,013-0,012-0,05-0,044-0,031-0,0210,0460,0390,010,007-0,016
tertiary -0,09810,0210,020,003-0,017-0,052-0,071-0,095-0,0440,0750,1310,1230,0920,029
far_left-0,010,0211-0,085-0,095-0,0240,0210,0090,0310,018-0,0340,005-0,007-0,0160,008
left 0,0810,02-0,0851-0,201-0,05-0,027-0,0080,0310,0470,009-0,021-0,0210,009-0,003
right0,0130,003-0,095-0,2011-0,056-0,0220,003-0,008-0,0120,0360,0290,0180,009-0,007
far_right -0,012-0,017-0,024-0,05-0,0561-0,0130,014-0,033-0,003-0,017-0,013-0,0020,0130,026
spss1 -0,05-0,0520,021-0,027-0,022-0,0131-0,045-0,072-0,086-0,079-0,056-0,036-0,016-0,011
spss2 -0,044-0,0710,009-0,0080,0030,014-0,0451-0,088-0,105-0,096-0,067-0,044-0,019-0,013
spss3 -0,031-0,0950,0310,031-0,008-0,033-0,072-0,0881-0,167-0,153-0,108-0,07-0,031-0,021
spss4 -0,021-0,0440,0180,047-0,012-0,003-0,086-0,105-0,1671-0,183-0,129-0,084-0,037-0,025
spss6 0,0460,075-0,0340,0090,036-0,017-0,079-0,096-0,153-0,1831-0,118-0,077-0,034-0,023
spss7 0,0390,1310,005-0,0210,029-0,013-0,056-0,067-0,108-0,129-0,1181-0,054-0,024-0,016
spss8 0,010,123-0,007-0,0210,018-0,002-0,036-0,044-0,07-0,084-0,077-0,0541-0,015-0,011
spss90,0070,092-0,0160,0090,0090,013-0,016-0,019-0,031-0,037-0,034-0,024-0,0151-0,005
spss10-0,0160,0290,008-0,003-0,0070,026-0,011-0,013-0,021-0,025-0,023-0,016-0,011-0,0051
Old European member states, year 2016AgeAgeAgeAgeAgemalepublic_unemploycurrent_political_obey_lawtax_noeducationprimarylower_sec
18_2526_3546_5556_6566workunioncorruptionlevel
age18_251-0,117-0,145-0,151-0,1620,015-0,0860,031-0,05-0,009-0,04-0,009-0,041-0,074-0,015
age26_35 -0,1171-0,191-0,199-0,214-0,019-0,0310,037-0,0010,028-0,0260,002-0,043-0,089-0,069
age46_55 -0,145-0,1911-0,245-0,2640,0090,0150,0550,1020,0080,03-0,009-0,038-0,0810,063
age56_65 -0,151-0,199-0,2451-0,275-0,0110,047-0,0070,056-0,0380,0070,013-0,0070,050,027
age66 -0,162-0,214-0,264-0,27510,0320,026-0,138-0,158-0,026-0,0170,0090,1470,231-0,004
male 0,015-0,0190,009-0,0110,0321-0,14-0,0220,01-0,013-0,034-0,006-0,002-0,0020,025
public_work -0,086-0,0310,0150,0470,026-0,141-0,0780,201-0,151-0,0130,018-0,075-0,086-0,063
unemploy 0,0310,0370,055-0,007-0,138-0,022-0,0781-0,0850,1270,0530,0720,0090,0080,116
current_union -0,05-0,0010,1020,056-0,1580,010,201-0,0851-0,2430,0080,015-0,087-0,105-0,112
political_corruption -0,0090,0280,008-0,038-0,026-0,013-0,1510,127-0,24310,0770,1260,1340,1450,133
obey_law -0,04-0,0260,030,007-0,017-0,034-0,0130,0530,0080,0771-0,0160,0590,0550,02
tax_level-0,0090,002-0,0090,0130,009-0,0060,0180,0720,0150,126-0,01610,0130,016-0,001
noeducation-0,041-0,043-0,038-0,0070,147-0,002-0,0750,009-0,0870,1340,0590,0131-0,041-0,068
primary -0,074-0,089-0,0810,050,231-0,002-0,0860,008-0,1050,1450,0550,016-0,0411-0,126
lower_sec -0,015-0,0690,0630,027-0,0040,025-0,0630,116-0,1120,1330,02-0,001-0,068-0,1261
post_sec -0,044-0,0170,0560,027-0,034-0,013-0,0510,0040,021-0,070,0330,023-0,073-0,136-0,224
tertiary -0,0840,138-0,007-0,05-0,084-0,0240,22-0,0830,159-0,169-0,053-0,027-0,117-0,218-0,36
far_left0,0160,0550-0,005-0,0580,0140,0510,0390,0380,086-0,0430,156-0,019-0,0260,008
left -0,081-0,051-0,0020,0550,068-0,040,094-0,0360,042-0,068-0,0180,0810,0140,0270,004
right-0,055-0,06-0,0010,0110,0950,038-0,049-0,079-0,034-0,0740,024-0,14-0,005-0,02-0,039
far_right -0,007-0,010,0170,0010,020,0550,007-0,0150,082-0,034-0,009-0,010,00200,046
spss1 -0,009-0,0060,0030,01-0,004-0,004-0,0160,078-0,0530,062-0,003-0,0160,0850,0370,058
spss2 0,0070,0060,007-0,018-0,0090,004-0,0160,126-0,0330,0810,0020,0190,0540,0570,039
spss3 -0,004-0,0160,028-0,001-0,011-0,012-0,050,076-0,0550,086-0,0140,0330,050,0650,068
spss4 -0,0030,0110,019-0,016-0,017-0,003-0,0470,074-0,0340,1220,0030,0410,0440,0620,056
spss6 0-0,016-0,0220,010,014-0,0130,012-0,0550,045-0,078-0,0130,021-0,054-0,055-0,043
spss7 -0,0030,0260,01-0,001-0,0360,0110,06-0,0780,073-0,113-0,028-0,05-0,061-0,087-0,097
spss8 -0,0150,0200,002-0,0010,0350,061-0,0650,028-0,1440,015-0,066-0,045-0,072-0,112
spss90,019-0,019-0,0020,009-0,0150,040,029-0,0320,032-0,0730,003-0,057-0,021-0,031-0,046
spss100,007-0,0080-0,0030,0140,02-0,008-0,017-0,0080,008-0,004-0,056-0,014-0,019-0,013
Old European member states, year 2016post_sectertiaryfar_leftleftrightfar_rightspss1spss2spss3spss4spss6spss7spss8spss9spss10
age18_25-0,044-0,0840,016-0,081-0,055-0,007-0,0090,007-0,004-0,0030-0,003-0,0150,0190,007
age26_35 -0,0170,1380,055-0,051-0,06-0,01-0,0060,006-0,0160,011-0,0160,0260,02-0,019-0,008
age46_55 0,056-0,0070-0,002-0,0010,0170,0030,0070,0280,019-0,0220,010-0,0020
age56_65 0,027-0,05-0,0050,0550,0110,0010,01-0,018-0,001-0,0160,01-0,0010,0020,009-0,003
age66 -0,034-0,084-0,0580,0680,0950,02-0,004-0,009-0,011-0,0170,014-0,036-0,001-0,0150,014
male -0,013-0,0240,014-0,040,0380,055-0,0040,004-0,012-0,003-0,0130,0110,0350,040,02
public_work -0,0510,220,0510,094-0,0490,007-0,016-0,016-0,05-0,0470,0120,060,0610,029-0,008
unemploy 0,004-0,0830,039-0,036-0,079-0,0150,0780,1260,0760,074-0,055-0,078-0,065-0,032-0,017
current_union 0,0210,1590,0380,042-0,0340,082-0,053-0,033-0,055-0,0340,0450,0730,0280,032-0,008
political_corruption -0,07-0,1690,086-0,068-0,074-0,0340,0620,0810,0860,122-0,078-0,113-0,144-0,0730,008
obey_law 0,033-0,053-0,043-0,0180,024-0,009-0,0030,002-0,0140,003-0,013-0,0280,0150,003-0,004
tax_level0,023-0,0270,1560,081-0,14-0,01-0,0160,0190,0330,0410,021-0,05-0,066-0,057-0,056
noeducation-0,073-0,117-0,0190,014-0,0050,0020,0850,0540,050,044-0,054-0,061-0,045-0,021-0,014
primary -0,136-0,218-0,0260,027-0,0200,0370,0570,0650,062-0,055-0,087-0,072-0,031-0,019
lower_sec -0,224-0,360,0080,004-0,0390,0460,0580,0390,0680,056-0,043-0,097-0,112-0,046-0,013
post_sec 1-0,387-0,026-0,0160,02-0,012-0,022-0,014-0,028-0,0220,0790,0180,028-0,019-0,005
tertiary -0,38710,0440,0070,037-0,035-0,066-0,078-0,104-0,0850,0130,1550,1590,0890,032
far_left-0,0260,0441-0,178-0,171-0,0740,0040,0050,0230,0340-0,034-0,03-0,016-0,013
left -0,0160,007-0,1781-0,304-0,131-0,04-0,006-0,0040,0240,012-0,004-0,008-0,0160,015
right0,020,037-0,171-0,3041-0,126-0,034-0,042-0,028-0,0750,0310,0670,0760,0470,003
far_right -0,012-0,035-0,074-0,131-0,12610,0220,0110,0250,003-0,011-0,026-0,021-0,0090,014
spss1 -0,022-0,0660,004-0,04-0,0340,0221-0,019-0,032-0,043-0,068-0,06-0,045-0,018-0,012
spss2 -0,014-0,0780,005-0,006-0,0420,011-0,0191-0,037-0,05-0,079-0,07-0,052-0,021-0,014
spss3 -0,028-0,1040,023-0,004-0,0280,025-0,032-0,0371-0,083-0,131-0,115-0,086-0,035-0,023
spss4 -0,022-0,0850,0340,024-0,0750,003-0,043-0,05-0,0831-0,179-0,157-0,117-0,048-0,031
spss6 0,0790,01300,0120,031-0,011-0,068-0,079-0,131-0,1791-0,247-0,184-0,076-0,049
spss7 0,0180,155-0,034-0,0040,067-0,026-0,06-0,07-0,115-0,157-0,2471-0,162-0,066-0,043
spss8 0,0280,159-0,03-0,0080,076-0,021-0,045-0,052-0,086-0,117-0,184-0,1621-0,05-0,032
spss9-0,0190,089-0,016-0,0160,047-0,009-0,018-0,021-0,035-0,048-0,076-0,066-0,051-0,013
spss10-0,0050,032-0,0130,0150,0030,014-0,012-0,014-0,023-0,031-0,049-0,043-0,032-0,0131
AgeAgeAgeAgeAgemalePublic_unemploycurrent_political_obey_lawtax_noeducationprimarylower_sec
18_2526_3546_5556_6566workunioncorruptionlevel
age18_251-0,151-0,167-0,161-0,150,032-0,131760,1005-0,076850,00463-0,073-0,051-0,00466-0,02-0,032
age26_35-0,1511-0,221-0,213-0,1980,001-0,081920,0542-0,046570,01237-0,051-0,057-0,02449-0,02-0,086
age46_55-0,167-0,2211-0,235-0,2190,004-0,000220,04010,1066240,01598-6,00E-040,025-0,03617-0,02-0,019
age56_65-0,161-0,213-0,2351-0,2110,0020,06585-0,0420,021591-0,027730,0520,0440,012301-0,030,0648
age66-0,15-0,198-0,219-0,2111-0,020,16951-0,123-0,059620,004660,08130,0660,0827080,1160,1104
male0,03220,00130,0040,002-0,0181-0,0906-0,030,005187-0,0095-0,0040,044-0,002770,0010,0679
public_work-0,132-0,082-2,00E-040,0660,1695-0,091-0,0740,2021520,007130,07950,0530,002510,025-0,097
unemploy0,10050,05420,04-0,042-0,123-0,03-0,073641-0,065830,06031-0,019-0,020,0027180,0060,0198
current_union-0,077-0,0470,1070,022-0,060,0050,20215-0,06610,009230,02040,026-0,00204-0,02-0,068
political_corruption0,00460,01240,016-0,0280,0047-0,010,007130,06030,0092281-0,0740,133-0,00885-0,010,0159
obey_law-0,073-0,051-6,00E-040,0520,081300,07949-0,0190,020355-0,073941-0,0310,013680,0110,0715
tax_level-0,051-0,0570,0250,0440,06570,0440,05344-0,020,0258050,13314-0,0311-0,01452-0,01-0,001
noeducation-0,005-0,024-0,0360,0120,082700,002510,0027-0,00204-0,008850,0137-0,0151-0,01-0,055
primary-0,02-0,024-0,016-0,0270,11640,0010,025310,0057-0,0182-0,011750,0115-0,006-0,006281-0,065
lower_sec-0,032-0,086-0,0190,0650,11040,068-0,096590,0198-0,068380,015860,0715-0,001-0,05496-0,061
post_sec-0,0450,00420,0070,029-0,0260,0030,042450,01250,020443-0,01014-0,0310,004-0,02216-0,03-0,228
tertiary-0,0550,13840,002-0,054-0,079-0,060,13925-0,0460,065523-0,01123-0,0610,012-0,03671-0,04-0,377
far_left-0,039-0,049-0,025-0,0010,13640,0220,03057-0,0050,02915-0,010650,01820,0120,01066-0,010,0617
left-0,072-0,083-0,0050,0720,10940,0080,03911-0,0070,007132-0,002550,03890,039-0,002250,012-0,014
right-0,048-0,0410,071-0,002-0,027-0,010,02735-0,0170,011347-0,021410,0243-0,0210,027765-0,030,0133
far_right-0,020,01250,0180,005-0,0390,021-0,020940,0046-0,010,02204-0,0140,019-0,01014-0,010,0419
spss1-0,006-0,025-0,010,0230,02310,005-0,000840,0699-0,01180,062890,00340,0310,0115320,0250,0561
spss2-0,0210,0020,006-0,0170,0323-0,010,014520,0153-0,020030,03154-0,0060,020,0064610,0650,0698
spss3-0,048-0,0480,0160,0380,0548-0,020,007280,0385-0,008660,039230,00370,0290,0203770,0190,1454
spss4-0,018-0,0490,0080,0470,02620,018-0,021220,0274-0,0104-0,002550,01470,02-0,01014-0,010,0818
spss60,02790,0352-0,006-0,032-0,0330,007-0,02326-0,04-0,01064-0,02292-0,008-0,003-0,01655-0,02-0,062
spss70,05840,0576-0,019-0,056-0,0970,0170,00133-0,0180,020352-0,04774-0,004-0,058-0,02871-0,03-0,135
spss80,04480,0224-0,01-0,01-0,03-0,01-0,0031-0,022-0,01241-0,06697-0,026-0,0410,0080560,001-0,109
spss90,029-8,00E-04-0,0190,004-2,00E-04-0,020,01539-0,0160,020857-0,01380,01760,011-0,00813-0,01-0,025
spss100,02250,0213-0,011-0,015-0,010,009-0,028940,0277-0,005380,02636-0,024-0,008-0,006920,02-0,007
New European member states, year 2016post_sectertiaryfar_leftleftrightfar_rightspss1spss2spss3spss4spss6spss7spss8spss9spss10
age18_25-0,045-0,055-0,039-0,07-0,048-0,02-0,01-0,021-0,05-0,020,0280,0580,0450,0290,023
age26_35 0,0040,138-0,049-0,08-0,0410,013-0,020,002-0,05-0,050,0350,0580,022-8,00E-040,021
age46_55 0,0070,002-0,02500,0710,018-0,010,0060,0160,008-0,006-0,02-0,01-0,019-0,01
age56_65 0,029-0,054-0,0010,072-0,0020,0050,023-0,0170,0380,047-0,032-0,06-0,010,004-0,01
age66 -0,026-0,0790,1360,109-0,027-0,0390,0230,0320,0550,026-0,033-0,1-0,03-2,00E-04-0,01
male 0,003-0,0550,0220,008-0,010,0210,005-0,013-0,020,0180,0070,017-0,01-0,0210,009
public_work 0,0420,1390,0310,0390,027-0,02100,0150,007-0,02-0,0230,00100,015-0,03
unemploy 0,013-0,046-0,005-0,01-0,0170,0050,070,0150,0390,027-0,04-0,02-0,02-0,0160,028
current_union 0,020,0660,0290,0070,011-0,01-0,01-0,02-0,01-0,01-0,0110,02-0,010,021-0,01
political_corruption -0,01-0,011-0,0110-0,0210,0220,0630,0320,0390-0,023-0,05-0,07-0,0140,026
obey_law -0,031-0,0610,0180,0390,024-0,0140,003-0,0060,0040,015-0,0080-0,030,018-0,02
tax_level0,0040,0120,0120,039-0,0210,0190,0310,020,0290,02-0,003-0,06-0,040,011-0,01
noeducation-0,022-0,0370,01100,028-0,010,0120,0060,02-0,01-0,017-0,030,008-0,008-0,01
primary -0,026-0,043-0,0130,012-0,026-0,0120,0250,0650,019-0,01-0,025-0,030,001-0,010,02
lower_sec -0,228-0,3770,062-0,010,0130,0420,0560,070,1450,082-0,062-0,13-0,11-0,025-0,01
post_sec 1-0,152-0,0270,004-0,057-0,013-0,01-0,011-0,0400,039-0,01-0,02-0,0120
tertiary -0,1521-0,034-0,010,031-0,013-0,05-0,06-0,1-0,080,040,1280,1420,060,035
far_left-0,027-0,0341-0,06-0,077-0,020,0570,0420,07-0,01-0,028-0,01-0,04-0,016-0,01
left 0,004-0,01-0,0581-0,209-0,055-0,020,0010,0190,072-0,013-0,05-0,02-0,014-0,02
right-0,0570,031-0,077-0,211-0,073-0,05-0,0030-0,030,031-0,010,0120,0290,019
far_right -0,013-0,013-0,02-0,05-0,0731-0,020,0170,0430,063-0,036-0,02-0,01-5,00E-04-0,01
spss1 -0,009-0,0470,057-0,02-0,048-0,021-0,024-0,04-0,05-0,064-0,06-0,04-0,016-0,01
spss2 -0,011-0,060,0420,001-0,0030,017-0,021-0,05-0,06-0,075-0,07-0,04-0,019-0,02
spss3 -0,043-0,0970,070,019-8,00E-040,043-0,04-0,0521-0,12-0,139-0,12-0,08-0,034-0,03
spss4 -6,00E-04-0,079-0,0060,072-0,0320,063-0,05-0,065-0,121-0,174-0,15-0,1-0,043-0,04
spss6 0,0390,04-0,028-0,010,031-0,036-0,06-0,075-0,14-0,171-0,18-0,11-0,05-0,04
spss7 -0,0060,128-0,007-0,05-0,005-0,021-0,06-0,066-0,12-0,15-0,1761-0,1-0,044-0,04
spss8 -0,020,142-0,036-0,020,012-0,006-0,04-0,041-0,08-0,1-0,111-0,11-0,027-0,02
spss9-0,0120,06-0,016-0,010,029-5,00E-04-0,02-0,019-0,03-0,04-0,05-0,04-0,031-0,01
spss10-0,0030,035-0,014-0,020,019-0,013-0,01-0,016-0,03-0,04-0,042-0,04-0,02-0,0111
Probit estimates, probability to favor progressive taxation. Robust standard errors in parentheses.
Variables20062016
New EUOld EUNew EUOld EU
Constant-1,250***-0,234**-0,846***-0,724***
-0,146-0,105-0,15-0,132
Ageage_18_25-0,0426-0,117*-0,094-0,166**
-0,0734-0,0618-0,0783-0,0737
age_26_35-0,0224-0,05760,0444-0,131**
-0,0692-0,0498-0,0674-0,0613
age_46_550,126*0,0990**0,248***0,191***
-0,0688-0,0479-0,0667-0,0571
age_56_650,234***0,232***0,218***0,281***
-0,0744-0,0508-0,0677-0,0583
age_660,183**0,317***0,228***0,411***
-0,079-0,0539-0,0734-0,0595
Gendermale-0,0318-0,0652**-0,0800*-0,0341
-0,0423-0,0304-0,0416-0,0349
Work statuspublic_worker0,131***0,0851**0,01110,106***
-0,0487-0,0371-0,0477-0,0399
unemployed-0,01940,141*-0,02320,0731
-0,0877-0,0731-0,08-0,0844
current_union_member0,06740,0858**-0,06660,107**
-0,0731-0,0413-0,0754-0,045
Trust in governmentpolitical_corruption0,299***0,120***0,106**0,0437
-0,0428-0,0364-0,0455-0,0463
obey_law0,00603-0,0335-0,05280,0371
-0,0424-0,0328-0,0423-0,0367
Perceptions on the current tax leveltax_level0,615***0,332***0,594***0,581***
-0,0487-0,0296-0,0495-0,0407
Educationnoeducation-0,1120,0239-0,273-0,216
-0,137-0,0903-0,275-0,135
primary0,02740,181***-0,1560,219**
-0,0635-0,0548-0,25-0,089
lower_sec0,156***0,222***0,02180,154**
-0,0591-0,0481-0,0506-0,063
post_sec-0,0185-0,136***-0,09390,0371
-0,0875-0,0512-0,0841-0,0661
tertiary-0,193***-0,251***-0,0547-0,177***
-0,0709-0,0522-0,0598-0,0538
Political orientationfar_left0,1130,520***0,520***0,385***
-0,117-0,0694-0,172-0,0713
left-0,135**0,253***0,125*0,312***
-0,063-0,0378-0,0651-0,0477
right-0,0922-0,334***0,00685-0,263***
-0,0564-0,0413-0,0527-0,0446
far_right-0,191-0,131-0,160,102
-0,185-0,0973-0,159-0,0793
Self-spss10,20,350**-0,06370,406***
-perceived social status -0,123-0,14-0,154-0,153
spss20,1480,303***0,06480,378***
-0,0992-0,107-0,139-0,142
spss30,129*0,07290,137*0,233***
-0,0711-0,0667-0,0818-0,0871
spss40,164***0,06910,154**0,133**
-0,0627-0,0544-0,069-0,0674
spss60,00718-0,143***-0,0445-0,0632
-0,0641-0,0421-0,0609-0,0508
spss7-0,0293-0,355***-0,104-0,212***
-0,0809-0,0503-0,0654-0,0536
spss8-0,11-0,440***-0,225**-0,385***
-0,114-0,0639-0,0902-0,0631
spss9-0,434*-0,788***-0,336*-0,575***
-0,243-0,131-0,182-0,121
spss10-0,181-0,707***-0,129-0,549***
-0,371-0,183-0,226-0,181
Country dummiesCZ-0,364*** -0,387***
-0,067 -0,0669
HR0,421*** -0,494***
-0,073 -0,0699
LV0,170** -0,0606
-0,0741 -0,0795
SI0,297*** 0,183**
-0,0751 -0,0744
DK -0,595*** -0,809***
-0,0649 -0,0673
FI -0,111* -0,237***
-0,0633 -0,0675
ES -0,244*** -0,101
-0,0542 -0,0751
FR -0,579*** -1,130***
-0,0545 -0,0664
SE -0,301*** -0,459***
-0,0609 -0,069
Observations4,5778,1444,5096,781
LogLikelihood-2465-4707-2499-3596
Pseudo R20,09260,1220,09240,176
Wald chi2425,6***1154***464,1***1210***
Sensitivity (%)95,5786,5193,787,73
Specificity (%)21,4842,4922,9348,89
Pearson chi24634,04***8032,78***4509,11***6953,72***
Hosmer-Lemeshow39,74***19,43***30,92***35,93***

*statistically significant at 10 %

**statistically significant at 5 %

***statistically significant at 1 %

References

1 

Fuchs-Schündeln N. 2020. The Long-Term Effects of Communism in Eastern Europe. Journal of Economic Perspectives, 34, (2) 172-191. https://doi.org/10.1257/jep.34.2.172http://dx.doi.org/10.1257/jep.34.2.172

2 

Dallinger U. 2010. Public support for redistribution: what explains cross-national differences?. Journal of European Social Policy, 20, (4) 333-349. https://doi.org/10.1177/0958928710374373 http://dx.doi.org/10.1177/0958928710374373

3 

Redmond G. 2002. Attitudes to Inequality after Ten Years of Transition. Innocenti Working Papers, 88,

4 

Suhrcke M. 2001. Preferences for inequality: East vs. West. Hamburgisches Welt-Wirtschafts-Archiv (HWWA) Discussion Paper, 150,

5 

Aristei D. 2016. Inequality aversion in post-communist countries in the years of the crisis. Post-Communist Economies, 28, (4) 436-448. https://doi.org/10.1080/14631377.2016.1224053 http://dx.doi.org/10.1080/14631377.2016.1224053

6 

Alvaredo F.. World Inequality Report 2018. Cambridge: Belknap Press of Harvard University Press, 2018. https://doi.org/10.4159/9780674984769http://dx.doi.org/10.4159/9780674984769

7 

European Commission: Tax policy challenges for economic growth and fiscal sustainability. Brussels: European Commission, 2015.

8 

Alesina A. 1994. Distributive Policies and Economic Growth. Quarterly Journal of Economics, 109, (2) 465-490. https://doi.org/10.2307/2118470http://dx.doi.org/10.2307/2118470

9 

Persson T. 1995. Is inequality Harmful for Growth?. American Economic Review, 84, (3) 600-621.

10 

Rodrik D.. One economics, many recipes: globalization, institutions, and economic growth. Princeton University Press: Princeton, 2008.

11 

Lyubimov I. 2017. Income inequality revisited 60 years later: Piketty vs Kuznets. Russian Journal of Economics, 3, (1) 42-53. https://doi.org/10.1016/j.ruje.2017.02.003http://dx.doi.org/10.1016/j.ruje.2017.02.003

12 

Alesina A. 2011. Preferences for redistribution. Handbook of Social Economics, 1, 93-131.

13 

George M.. Social Mobility and Support for Redistribution: Separating the American Dream from Policy Preferences. Oxford: University of Oxford, 2018.https://ssrn.com/abstract=2857925

14 

Charite J. 2016. Reference Points and Redistributive Preferences: Experiment Evidence. NBER Working Paper, 21009

15 

Lockwood B.B. 2015. De Gustibus non est Taxandum: Heterogeneity in Preferences and Optimal Redistribution. Journal of Public Economics, 124, 74-80. https://doi.org/10.1016/j.jpubeco.2015.01.002http://dx.doi.org/10.1016/j.jpubeco.2015.01.002

16 

Cruces G. 2013. Biased perceptions of income distribution and preferences for redistribution: Evidence from a survey experiment. Journal of Public Economics, 98, (C) 100-112. https://doi.org/10.1016/j.jpubeco.2012.10.009http://dx.doi.org/10.1016/j.jpubeco.2012.10.009

17 

Naumann E. 2018. Tax Constraints, Social Policy Preferences, and Support for Redistribution. Societies, 8, (3) 1-11. https://doi.org/10.3390/soc8010011 http://dx.doi.org/10.3390/soc8010011

18 

Ross M.L. 2004. Does Taxation Lead to Representation?. British Journal of Political Science, 34, (2) 229-249. https://doi.org/10.1017/S0007123404000031http://dx.doi.org/10.1017/S0007123404000031

19 

Barnes L. 2015. The size and shape of the government: preferences over redistributive tax policy. Socio-Economic Review, 13, (1) 55-78. https://doi.org/10.1093/ser/mwu007http://dx.doi.org/10.1093/ser/mwu007

20 

Diamond P. 2011. The Case for a Progressive Tax - From Basic Research to Policy. Journal of Economic Perspectives, 25, (4) 165-190. https://doi.org/10.1257/jep.25.4.165http://dx.doi.org/10.1257/jep.25.4.165

21 

Atkinson A.B. 1976. The Design of Tax Structure: Direct versus Indirect Taxation. Journal of Public Economics, 6, (1-2) 55-75. https://doi.org/10.1016/0047-2727(76)90041-4http://dx.doi.org/10.1016/0047-2727(76)90041-4

22 

Chamley C. 1986. Optimal Taxation of Capital Income in General Equilibrium with Infinite Lives. Econometrica, 54, (3) 607-622. https://doi.org/10.2307/1911310http://dx.doi.org/10.2307/1911310

23 

Judd K.L. 1985. Redistributive Taxation in a Simple Perfect Foresight Model. Journal of Public Economics, 28, (1) 59-83. https://doi.org/10.1016/0047-2727(85)90020-9 http://dx.doi.org/10.1016/0047-2727(85)90020-9

24 

European Commission: Taxation Trends in the European Union. (Luxembourg) Publications Office of the European Union, Luxembourg.

26 

Joumard, I.. Tax Systems in European Union Countries. (2001) OECD Economics Department Working Papers. No. 301.

27 

Thomson S., et al.. Economic crisis, health systems and health in Europe: impact and implications for policy. New York: McGraw-Hill Education, 2015.

28 

Lipsmeyer C.S. 2003. Welfare and the Discriminating Public: Evaluating Entitlement Attitudes in Post-Communist Europe. Policy Studies Journal, 31, (4) 545-564. https://doi.org/10.1111/1541-0072.00042 http://dx.doi.org/10.1111/1541-0072.00042

29 

Anderson, J.E. and Shimul, S.N.: Preferences for Redistribution in Transition Countries.https://www.aeaweb.org/conference/2017/preliminary/paper/teK66ZH4

30 

Okulicz-Kozaryn A. 2014. Winners and Losers in Transition: Preferences for Redistribution and Nostalgia for Communism in Eastern Europe. Kyklos, 67, (3) 447-461. https://doi.org/10.1111/kykl.12062http://dx.doi.org/10.1111/kykl.12062

31 

Perugini C.. Inequalities During and After Transition in Central and Eastern Europe. New York: Palgrave Macmillan, 2015.

32 

Ballard-Rosa C. 2016. The Structure of American Income Tax Policy Preferences. The Journal of Politics, 79, (1) 1-16. https://doi.org/10.1162/GLEP_a_00337http://dx.doi.org/10.1162/GLEP_a_00337

33 

Yamamura E. 2014. Trust in government and its effect on preferences for income redistribution and perceived tax burden. Economics of Governance, 15, (1) 71-100. https://doi.org/10.1007/s10101-013-0134-1http://dx.doi.org/10.1007/s10101-013-0134-1

34 

Alesina, A.; Stancheva, S. and Teso, E.: Intergenerational Mobility and Support for Redistribution. (2017) NBER Working Paper. . 23027.

35 

ISSP Research Group, International Social Survey Programme: Role of Government V - ISSP 2016. (2018) GESIS Data Archive. ZA6900 Data file Version 1.0.0. 10.4232/1.12994http://dx.doi.org/10.4232/1.12994

36 

ISSP Research Group, International Social Survey Programme: Role of Government IV – ISSP 2006. (2008) GESIS Data Archive. ZA4700 Data file version 1.0.0.. 10.4232/1.4700http://dx.doi.org/10.4232/1.4700

37 

West D.M. 2004. E-Government and the Transformation of Service Delivery and Citizen Attitudes. Public Administration Review, 64, (1) 15-27. https://doi.org/j.1540-6210.2004.00343.x http://dx.doi.org/10.1111/j.1540-6210.2004.00343.x

38 

Fallan L. 1999. Gender, Exposure to Tax Knowledge and Attitudes Toward Taxation: An Experimental Approach. Journal of Business Ethics, 18, 173-184. https://doi.org/10.1023/A:1005711905297http://dx.doi.org/10.1023/A:1005711905297

39 

Roosma F. 2015. A Just Distribution of Burdens? Attitudes Toward the Social Distribution of Taxes in 26 Welfare States. International Journal of Public Opinion Research, 28, (3) 376-400. https://doi.org/10.1093/ijpor/edv020http://dx.doi.org/10.1093/ijpor/edv020

40 

Ekman J. 2005. Communist nostalgia and the consolidation of democracy in Central and Eastern Europe. Journal of Communist Studies and Transition Politics, 21, (3) 354-374. https://doi.org/10.1080/13523270500183512http://dx.doi.org/10.1080/13523270500183512

41 

Meltzer A.H. 1981. A Rational Theory of Size of Government. Journal of Political Economy, 89, (5) 914-927. https://doi.org/10.1086/261013http://dx.doi.org/10.1086/261013

42 

Snyder J.M. 1988. Fairness, self-interest, and the politics of the progressive income tax. Journal of Public Economics, 36, (2) 197-230. https://doi.org/10.1016/0047-2727(88)90030-8 http://dx.doi.org/10.1016/0047-2727(88)90030-8

43 

Fernández-Albertos J. 2015. Income Perception, Information, and Progressive Taxation: Evidence from a Survey Experiment. Political Science Research and Methods, 6, (1) 83-110. https://doi.org/10.1017/psrm.2015.73http://dx.doi.org/10.1017/psrm.2015.73

44 

Margalit Y. 2013. Explaining Social Policy Preferences: Evidence from the Great Recession. American Political Science Review, 107, (1) 80-103. https://doi.org/10.1017/S0003055412000603http://dx.doi.org/10.1017/S0003055412000603

45 

Alm J. 2006. Culture Differences and Tax Morale in the United States and in Europe. Journal of Economic Psychology, 27, (2) 224-246. https://doi.org/10.1016/j.joep.2005.09.002http://dx.doi.org/10.1016/j.joep.2005.09.002

46 

Gemmell N. 2004. Tax Perceptions and Preferences over Tax Structure in the United Kingdom. The Economic Journal, 114, (493) F117-F138. https://doi.org/10.1111/j.0013-0133.2004.00190.xhttp://dx.doi.org/10.1111/j.0013-0133.2004.00190.x

47 

Winter S. 2001. Why people want something for nothing: The role of asymmetrical illusions. European Journal of Political Research, 39, 109-143. https://doi.org/10.1023/A:1007185029456http://dx.doi.org/10.1023/A:1007185029456

48 

Busemeyer M.R. 2017. Investing in education in Europe: Evidence from a new survey of public opinion. Journal of European Social Policy, 28, (1) 34-54. https://doi.org/10.1177/0958928717700562http://dx.doi.org/10.1177/0958928717700562

49 

Henninghausen T. 2015. Dont Tax Me? Determinants of Individual Attitudes Toward Progressive Taxation. German Economic Review, 16, (3) 255-289. https://doi.org/10.1111/geer.12050http://dx.doi.org/10.1111/geer.12050

50 

Traub-Merz R.. Trade Unions in Transition: from Command to Market Economies. Berlin: Fridrich-Ebert Stiftung, 2018.

51 

Dion, M.: When is it rational to redistribute? A cross-national examination of attitudes toward redistribution. (2012) Congress of the International Political Science Association, Madrid.

52 

Bartels L.M. 2005. Homer Gets a Tax Cut: Inequality and Public Policy in the American Mind. Perspectives on Politics, 3, (1) 15-31.


This display is generated from NISO JATS XML with jats-html.xsl. The XSLT engine is libxslt.