
INTRODUCTION
Migrant integration is considered a key societal process in all European countries, all the more so in the last decade, which was marked by an increased movement of people. The EU aims to set up a balanced, rightful and uniform approach to managing regular immigration and combating irregular immigration, stating that “proper management of migration flows entails ensuring fair treatment of third-country nationals residing legally in the Member States, enhancing measures to combat irregular immigration, including trafficking and smuggling, and promoting closer cooperation with non-member countries in all fields” (Schmid-Drüner, 2021: 1). Nonetheless, the EU Member States differ in managing their integration policies, which reflects the still predominant Western European inclination to paradigmatically base integration on the “nation-state–society” nexus (Institute for Migration and Ethnic Studies, 2016).
As a multi-dimensional process, immigrant integration is variously defined, depending on the definition's focus or the socio-historic and contextual placement (Geddes, 2003). However, the most common definition presents integration as a process of inclusion and acceptance of immigrants in the main institutions, relations and positions in the host society, but also as a consequence of rational responses by actors in the social environment (Esser, 2004). The debates on defining the dimensions of integration are mostly contained within the fragmented view of immigrants integration into the national (majority) community and its dominant culture, implying that immigrants only partially participate in various areas of society that are mutually independent and relatively autonomous (Institute for Migration and Ethnic Studies, 2016). Penninx (2007), for instance, defines three distinct dimensions: the legal-political, the socioeconomic and the cultural-religious.1 National integration policies address these dimensions variously and can themselves be classified as complete exclusion, differential exclusion, assimilation and pluralism (Brubaker, 1992;Castles, 1995;Hollifield, 1997;Penninx, 2004).2 Some recent research studies which also measure the implementation level of integration policies indicate a somewhat different categorisation of state policies, but in line with the mentioned one. One of these research projects is the Migrant Integration Policy Index – MIPEX, presenting the fifth wave of research results in 2020 and offering country classification into comprehensive integration, temporary integration, equality on paper, and immigration without integration (integration denied). The MIPEX starts from the notion that integration “in both social and civic terms rests on the equal opportunities for all. In socioeconomic terms, migrants must have equal opportunities to lead just as dignified, independent and active lives as the rest of the population. In civic terms, all residents can commit themselves to mutual rights and responsibilities on the basis of equality” (Solano and Huddleston, 2020: 6). Taking integration as context- and person-related, the authors of the study stress that, even though the government policy is “only one of a number of factors which affect the immigration, it is vital because it sets the legal and political framework within which other aspects of integration occur” (Solano and Huddleston, 2020: 6).
Public attitudes towards integration and immigrants are another concept analysed in this paper. Research on perceptions of and attitudes towards migrants3 is a well-developed, multidisciplinary research field, especially in the North American, Western European and Australian contexts. This research highlights several common aspects, including a perception of a symbolic or real threat posed by newcomers (cf.Stephan et al.,1998), projected mostly onto the economic stability and cultural identity of the domicile population of the host country. The existing studies largely focus on testing the socioeconomic and cultural hypotheses of attitudes (Ervasti, 2004;Schneider, 2008) i.e., whether migrants are being perceived as a threat to the national identity, culture, values, and customs, or to the economy and/or social and welfare system of the recipient country.
Further on, public attitudes are also context-dependent, especially having in mind complex social processes deriving from the unexpected events with long-bearing consequences such as the European 2015/2016 “migration (or refugee) crisis”. These attitudes are shaped by and conveyed through the legal framework, socio-political institutions, media portrayals and daily interactions within the national and regional context in which they occur (Župarić-Iljić and Gregurović, 2020). Dempster and Hargrave (2017) posit that the government’s asylum and integration policies, as well as the migration system and border regime, set a context in which those public attitudes are formed. However, the relationship between these policies and public attitudes is rarely simple. M. Callens (2015) documented and analysed this relationship in her review of 18 studies among which several are largely represented by the combinations of the MIPEX and European Social Survey (ESS) studies.4 Her analyses included country-level societal factors which were, as context indicators, considered “as sources of threat and competition through more sociological approaches to anti-immigrant attitudes” (Callens, 2015: 10). Other researchers also perceived these indicators to be more influential than the individual self-interest, i.e., indicating that migrants are being evaluated based on their expected impact on the national economy, culture, or national identity (Hainmueller and Hopkins, 2014). The reviewed studies established a significant connection between the different operationalisations of public attitudes as dependent and integration policies as independent variables. But they also reflected the contrasting theoretical standing points – normative theory of intergroup relations and group threat theory5 (Callens, 2015). As Callens (2015: 13) stresses, “[a]ll studies on anti-immigrant attitudes find a significant effect of overall integration policies as measured by MIPEX on anti-immigrant attitudes. According to these findings, more inclusive policies tend to improve attitudes towards immigrants among the general public across European countries, while exclusionary policies tend to harden anti-immigrant sentiments in the population.” Also, other research studies in Callens’ analysis find different types of relations between integration policies and public perceptions of threat, indicating that more inclusive policies affect the lowering of threat perceptions.
This paper focuses on the selected set of policy-level indicators of migrant integration provided by the MIPEX study and context-relevant indicators of immigrant proportion in the total population. To control the effects of country-level indicators, some formerly determined individual-level indicators have also been included in the analysed models. These indicators are the most replicated correlates of anti/pro-immigrant attitudes, namely age, education, socioeconomic status, political orientation and level of religiosity (Chandler and Tsai, 2001;Rustenbach, 2010;Cowling, Anderson and Ferguson, 2019). Other research studies also imply significant country- and individual-level effects on public attitudes towards immigration, such as unemployment rate and ethnic origin of respondents (i.e., native/non-native resident) (seeBoateng et al., 2020), therefore, the effects of the respondents’ ethnic background are also controlled for.
Finally, the paper will analyse the most recent data of the two international studies – MIPEX2020 and ESS2018 (Wave 9) to establish the connection between the country-level and individual-level indicators referring to the integration of immigrants. The aim is to offer a short glance at basic indicators and results of both studies, to establish the relationship between them in 27 European countries by providing a review of national policies adopted regarding migrant integration and the public perception of immigrants in the host society, and to set the ground for possible further, and deeper analyses of this multi-level problem. Further on, the paper aims to contribute to the existing debate on the possible effects of the European “migration crisis” on the public attitudes towards migrants, as well as changes in migration policies, by comparing the results with those from the previous cycles.
COUNTRY CONTEXT
Allport (1954) has shown that the attitudes towards specific groups – both positive and negative, in this case, immigrants, are affected by the contact established with the members of that group. In the context of migration, the contact depends on the density of a specific population (immigrants) among the countries’ residents. Ethnic competition theory6 implies that the size of the immigrant group affects and reinforces anti-immigrant feelings since the majority population would feel more threatened by larger groups of newcomers (Bircan and Hooghe, 2010;Quillian 1995,Semyonov, Raijman and Gorodzeisky, 2006). The overall proportions of immigrants in countries selected for the analyses are presented inFigure 1. The Eurostat numbers refer to the beginning of 2019, which is about the time when MIPEX2020 and ESS2018 were conducted. As can be seen, Switzerland records the largest overall proportion of immigrants, measuring almost a quarter of immigrants in the overall country population. This immigrant population is dominantly of EU-27 descent. Larger proportions of immigrants have also been recorded in Cyprus and Estonia (over 15%), although Eurostat does not provide data on the citizenship of immigrants in Cyprus, and non-EU-27 citizens are settled in Estonia in a larger proportion. Over 10% of immigrants are also recorded in Latvia, Ireland, Iceland, Belgium, Germany, Norway, and Spain. On the other side, Poland recorded less than 1% of total immigrants, followed by Hungary, Lithuania, Croatia, Bulgaria, and Slovakia with less than 2% of immigrants. Over half of the analysed countries recorded larger proportions of immigrants who are non-EU-27 citizens.
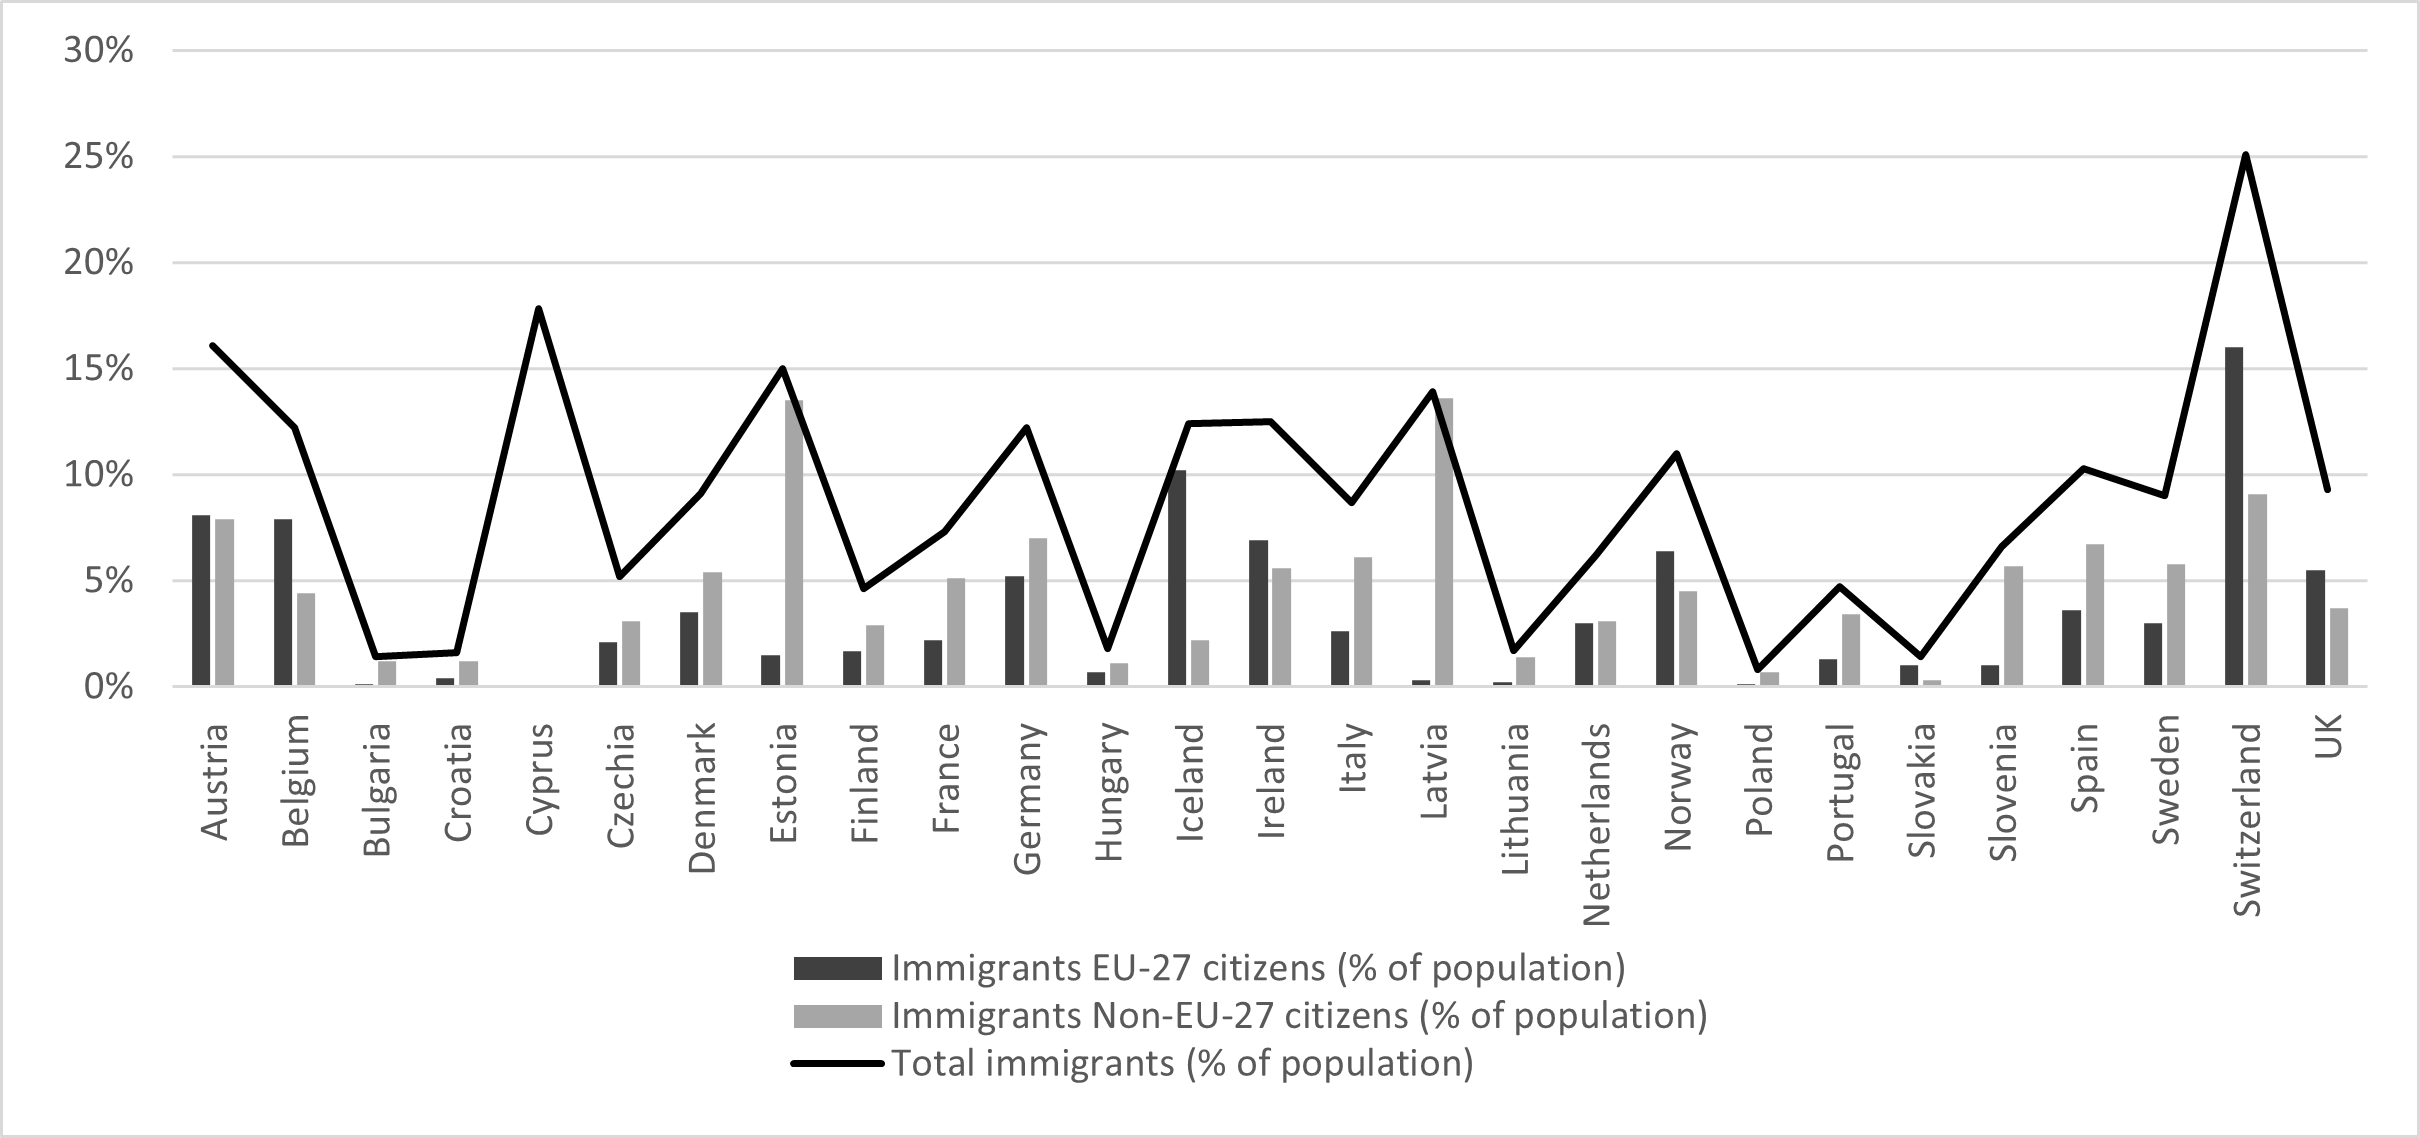
Source: EUROSTAT,https://ec.europa.eu/eurostat/statistics-explained/index.php/Migration_and_migrant_population_statistics
These immigration statistics are not always reflected in the integration legislation of various countries. The European Commission’s European Web Site on Integration indicates that most of the analysed countries have not yet passed any integration laws (European Commission, 2020).7 Among the EU Member States, Austria, Belgium, Denmark, Finland, France, Germany, Lithuania, the Netherlands, and Portugal have adopted the immigration laws. Other countries mostly provide integration programmes in the form of language courses, civic education, and, more seldom, vocational training for immigrants, although there is no specific law on integration.
When dealing with migration issues, an unavoidable context indicator at the European level has been the “migration (or refugee) crisis” which occurred in 2015 and 2016, thus possibly affecting public attitudes and policies on migration and integration. Since 2011, the EU has marked a swift rise in the number of asylum applicants, which reached its peak in 2015, when almost 1.3 million asylum applications were submitted (Eurostat, 2021; cf. Rogelj, 2017). That year, most applications were submitted in Germany (almost half a million), followed by Hungary and Sweden (Figure 2). In 2016, Germany was also the country with the highest proportion of applications, followed by Italy – the country of entrance of the largest number of refugees using the Central Mediterranean route. Even though the arrival of refugees has decreased since, the EU countries still record between 650,000 and 750,000 asylum applications yearly, predominantly in Germany, but also in France and Spain. The Baltic states record the lowest number of applications.
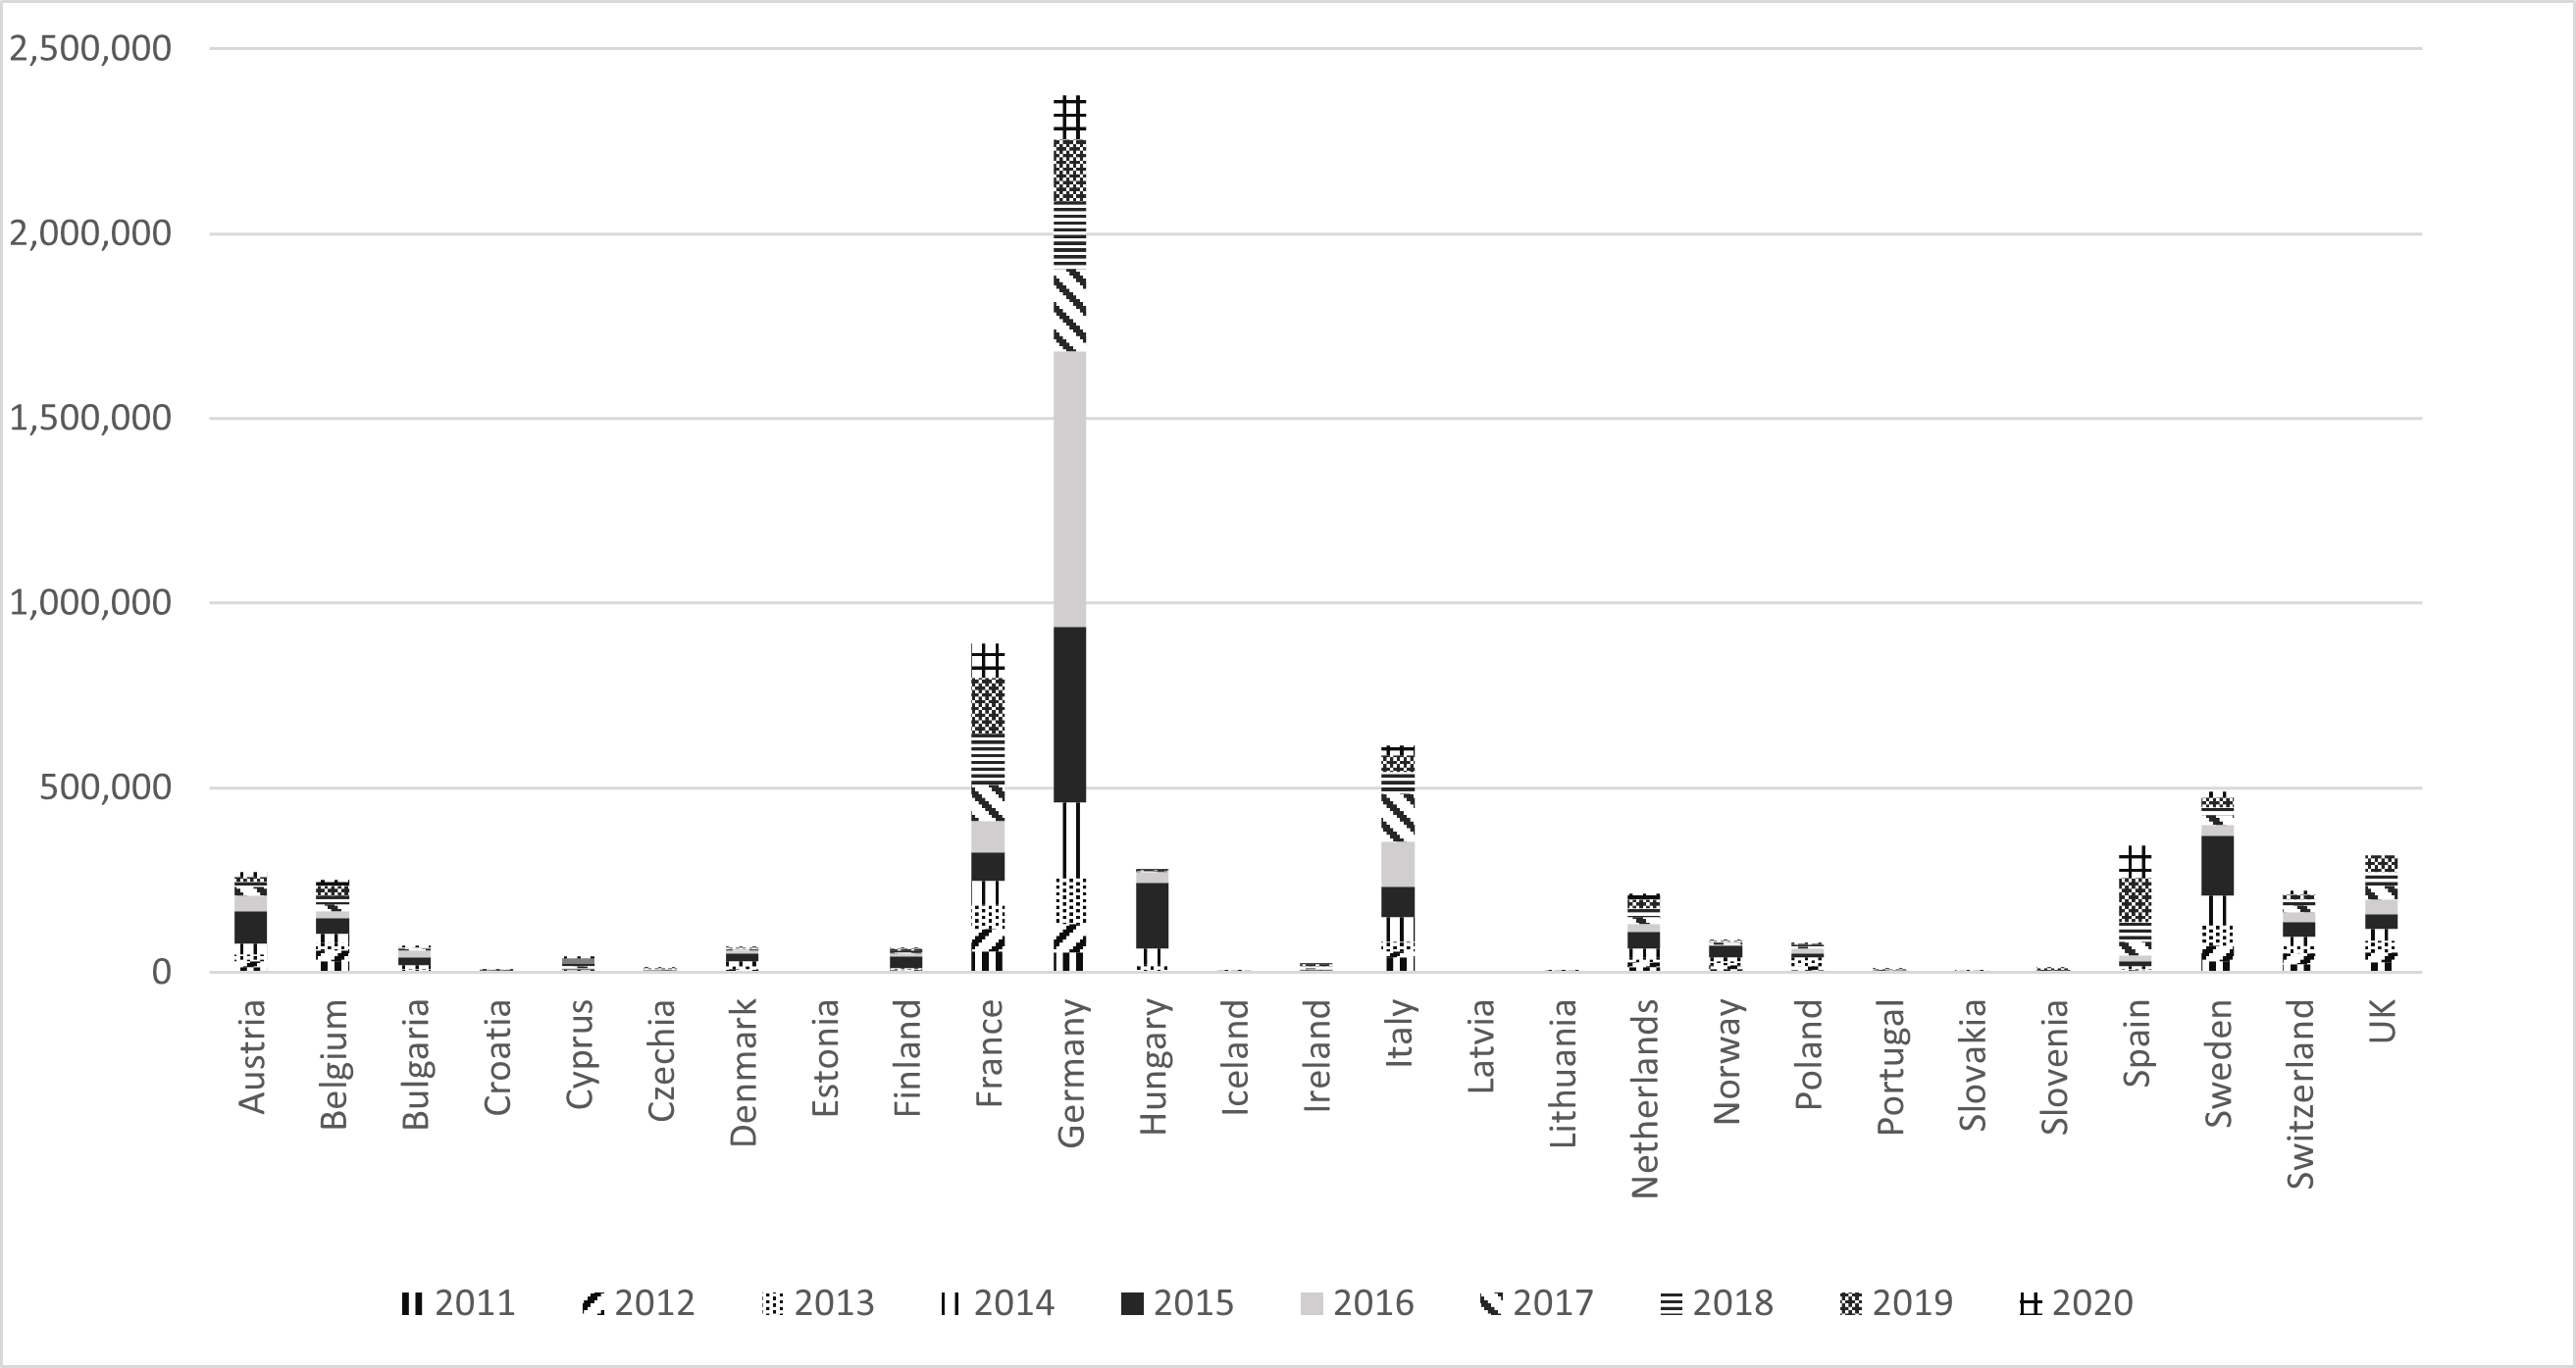
Source: EUROSTAT, Asylum and first-time asylum applicants,https://ec.europa.eu/eurostat/databrowser/view/tps00191/default/table?lang=en
DATA
The data used in this paper originate from two international studies – MIPEX2020 (reconstructed fromSolano and Huddleston, 2020) and European Social Survey (Wave 9) (ESS, 2018a) and are analysed both separately and combined. The data for 27 European countries were taken into consideration since they participated in both studies: Austria, Belgium, Bulgaria, Croatia, Cyprus, Czechia, Germany, Denmark, Estonia, Finland, France, Hungary, Ireland, Iceland, Italy, Lithuania, Latvia, the Netherlands, Norway, Poland, Portugal, Spain, Sweden, Switzerland, Slovenia, Slovakia, and the United Kingdom.8
The MIPEX study measures and analyses policies that promote the integration of immigrants at the societal level in 52 countries (for more details on the study seeSolano and Huddleston, 2020;https://www.mipex.eu/). MIPEX score is based on a set of indicators covering eight policy areas that have been designed to benchmark current laws and policies against the highest standards through consultations with top scholars and institutions using and conducting comparative research in their area of expertise. The policy areas of integration covered by the MIPEX are: 1) labour market mobility, 2) family reunification, 3) education, 4) political participation, 5) permanent residence, 6) access to nationality, 7) anti-discrimination, and 8) health.
Score values between 0 and 100 are calculated based on policy indicators, which are represented by questions relating to a specific policy component of one of the eight policy areas,[1] and are based on 58 “core indicators” covering all 8 MIPEX policy areas enabling sustainability and comparisons to previous cycles (Solano and Huddleston, 2020: 7). Country experts assessed the core set of indicators for the years 2014–2019, while the leading research team cross-checked and analysed the obtained data. The MIPEX2020 data are represented in this paper by the overall country score as well as scores obtained within all the analysed policy areas.9 A set of options with associated values (from 0 to 100, e.g., 0–50–100) is assigned to each answer. A maximum of 100 points is awarded when policies meet the highest standards for equal treatment. The indicator scores are averaged together within each policy area to calculate the policy area score for each of the eight policy areas per country which, averaged together one more time, result in the overall scores for each country (Solano and Huddleston, 2020).
In the ninth round, the ESS covered 30 countries and was conducted during 2018. The survey employs “strict random probability sampling, a minimum target response rate of 70% and rigorous translation protocols” (ESS, 2018b). A variety of core topics repeated from previous rounds of the survey were included in the hour-long face-to-face interview, with the addition of two modules developed and/or adapted for round 9: Justice and Fairness in Europe, and the Timing of Life. The survey targeted all persons aged 15 or older, residents within private households regardless of their nationality, citizenship, language, or legal status in 24 EU and 6 non-EU countries. The survey was conducted using the most rigorous methodologies which have been defined and controlled within the Survey Specification for ESS ERIC Member, Observer and Guest countries (ESS – ERIC, 2019).
The data used in this paper include 46,276 respondents from the mentioned 27 European countries. The number of respondents from all countries included in the analyses is listed inTable 1. The largest number of participants was from Italy (more than 2,500 respondents) and the smallest (below 1,000) from Cyprus, Iceland, and Latvia. The constructed anweight was used while conducting the analyses to compensate for differential selection probabilities within each country as specified by sample design, for nonresponse, noncoverage, and sampling errors related to the four post-stratification variables10, and to take into account differences in population size across countries (Kaminska and Lynn, 2017).
The analysed sample is gender-balanced (male – 48.6%, female – 51.4%), has 48.5 years (s.e. = .165) of average age (covering the total range between 15 and 90 years of age) and, on average, 13 years (s.e. = .038) of full-time education completed. In all analysed countries native-born respondents account for over two-thirds of the sample (82.3% of the total sample) except in Switzerland, where the sample included slightly over 50% of native residents. The most ethnically homogeneous countries are Bulgaria, Poland, and Hungary, whose samples are represented by native-born respondents in a proportion larger than 95%.
Indicators
The dependent (criterion) variables used in the analyses are the ESS2018 (Wave 9) questions referring to the perception of immigrants. Six single items (B38 – B43) were analysed: the extent to which a country should allow 1) people of the same race/ethnic group as the majority, 2) people of different race/ethnic group than the majority, and 3) people from poorer countries outside Europe to come and live in the country; the estimation of 4) immigration as bad or good for the country's economy, 5) immigrants enriching or undermining the country’s cultural life, and 6) immigrants making the country a worse or better place to live. The first three items included a four-level answer scale (from 1 – “Allow many” to 4 – “Allow none”) while the last three items included answer options from 0 to 10, 10 being the most positive attitude.11 All items represent an operationalisation of specific theoretical standing points referring to the threat posed by immigrants – both symbolical (cultural) and real (in terms of economy and security), as well as opposition to immigration (ESS, 2015;Callens, 2015). These items constitute a smaller part of the instruments used within the 7th ESS round focusing on the attitudes towards immigration and their antecedents. Following the conceptualisation of ESS Wave 7, the scale Opposition to immigration was constructed based on three items measuring how many immigrants should be allowed to come and live in the country (Cronbach α=.882). The other three items were analysed separately since they represent different conceptual frameworks (cf.Callens and Meuleman, 2017), despite the possible shortcoming of doing so .12 The concept of Real threat: economic and security is behind the item estimating immigration as bad or good for the country's economy, Symbolic threat behind the item estimating whether immigrants enrich or undermine the country’s cultural life and Opposition to immigration behind the item estimating whether immigrants make the country a worse or better place to live13 (ESS, 2015). Various conceptualisations of threat have been widely researched and the results obtained do not always point towards the same predictors. They rather indicate differences in perceptions of diverse groups of immigrants (i.e., regular migrants being perceived more as an economic threat, asylum seekers and refugees as a health threat, migrants coming from the Middle East as a cultural threat, etc.) (cf.Župarić-Iljić and Gregurović, 2013;Gregurović et al., 2016). Therefore, maintaining the distinction between the types of threat could possibly contribute to the existing “threat-perception debate” on specific correlates anchored in various integration policies.
Predictor variables are grouped into two sets. The first set refers to individual-level indicators: immigration status (as a control variable) (1 – “Native-born” and 2 – “Immigrant background”)14 , age, education (recoded into six categories according to the achieved ISCED level), socioeconomic status (estimated by Household's total net income, expressed in deciles), political orientation (11-point scale from 0 – “Left” to 10 – “Right”) and level of religiosity (11-point scale from 0 – “Not at all religious” to 10 – “Very religious”). The second set used in the multilevel analyses refers to country-level indicators derived from MIPEX and Eurostat. MIPEX-based indicators are the overall MIPEX2020 score, country scores on each of the eight policy areas and country approach to immigration categorised as 1) comprehensive integration; 2) temporary integration; 3) equality on paper and 4) immigration without integration. Finally, Eurostat data on the proportion of immigrants in the total population were used as additional contextual indicators: proportion of a total number of immigrants, proportion of immigrants – citizens of EU-27 countries and proportion of immigrants – citizens of non-EU-27 countries.
Analyses
After the descriptive analyses were conducted separately on both sets of data, the Pearson correlation between all analysed predictor and criterion variables was calculated. Further on, the SPSS complex samples procedure was employed to run bivariate and multivariate calculations to adjust standard errors for clustering at the country level. Differences were determined between the respondents’ perceptions of immigrants based on the countries’ approach to immigration using the estimated means function. Finally, multilevel regression analyses were computed to determine the effects of individual- and country-level characteristics on the attitudes towards immigrants.
RESULTS
First, a descriptive analysis of selected indicators was conducted in both studies. MIPEX2020 results are presented by overall country score as well as the score on all eight policy areas. As shown inFigure 3, Sweden and Finland recorded the highest overall score, closely followed by Portugal. These three countries also record high scores on all other policy levels and are included in the category Top ten countries (of all 52 countries included in the MIPEX study). These countries have adopted a comprehensive approach to integration, “which fully guarantees equal rights, opportunities and security for immigrants and citizens. Policies in these countries generally encourage the public to see immigrants as their equals, neighbours and potential citizens” (Solano and Huddleston, 2020: 10). The category of comprehensive integration (Table 2) also includes Belgium, Czechia, Estonia, Iceland, Ireland, Norway, and Spain, which have adopted a comprehensive approach to a different degree (favourable or unfavourable)15 and do not always encourage the public to see immigrants as their equals, neighbours, and potential citizens.
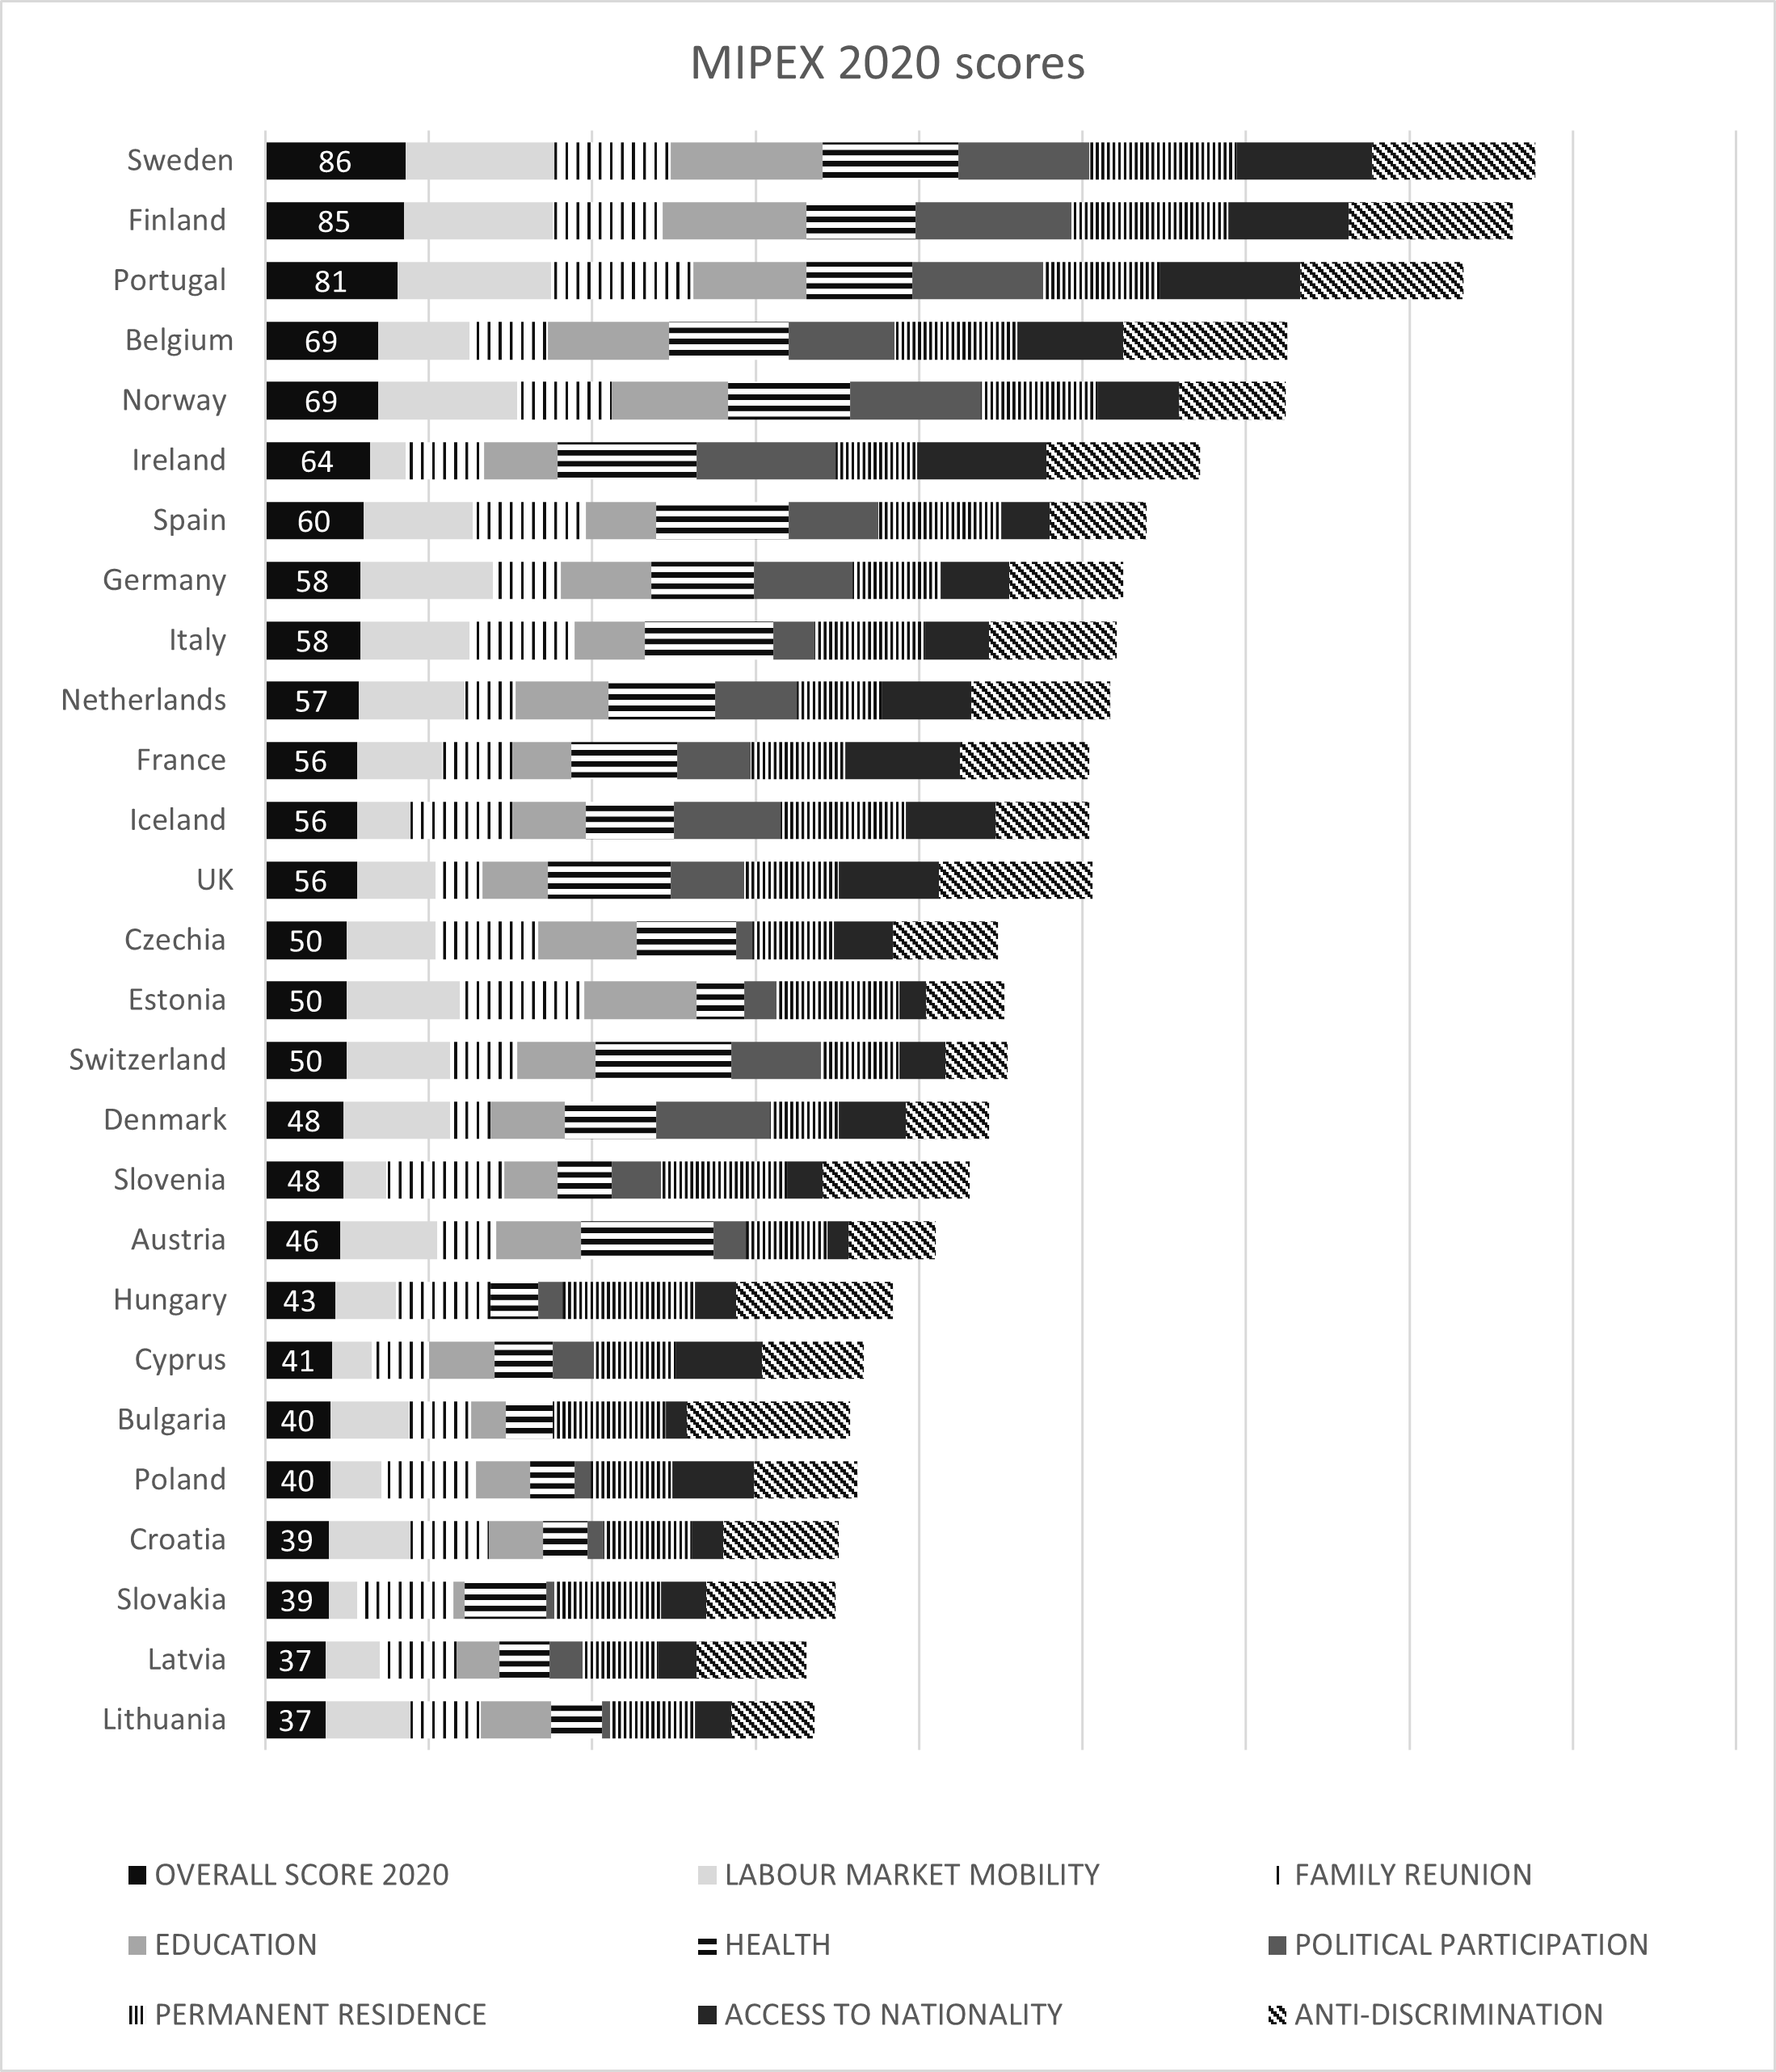
Source: Adapted from Solano and Huddleston (2020).
Lithuania, Latvia and Croatia recorded the lowest MIPEX2020 score among the analysed 27 European countries. Their approach to integration was defined as slightly unfavourable equality on paper, and in Slovakia as halfway unfavourable equality on paper. In these four countries, immigrants do not enjoy equal opportunities, but Croatia, Lithuania and Latvia go only halfway in providing immigrants with basic rights and a secure future, while policies may encourage the public to see immigrants as subordinates and not equal and potential citizens. Slovakia, on the other hand, mainly focuses on basic rights for immigrants, and only goes halfway in providing them with long-term security. Its policies may encourage the public to see immigrants as equal but also as subordinates and not potential citizens (Solano and Huddleston, 2020). The same approach to integration has been found in Bulgaria, Hungary, Poland and Slovenia.
Even though Cyprus does not record the lowest overall MIPEX score, the authors of the study define its approach as the most unfavourable immigration without integration, indicating that its policies deny that the country has become an immigrant destination country and “[i]mmigrants may find ways to settle long-term but are not supported with basic rights or equal opportunities to participate in society. Policies may encourage the public to see immigrants as subordinates and as strangers” (Solano and Huddleston, 2020: 11).
Finally, the rest of the analysed countries fall into the temporary integration category, which indicates that these countries provide immigrants (completely or halfway) with basic rights and equal opportunities, but not with a secure future in the country. Policies in these countries encourage the public to see immigrants as their equals and neighbours, but also as foreigners rather than as potential citizens (Solano and Huddleston, 2020).
When analysing specific policy areas on an international level, most of the countries recorded similar strengths and deficiencies (Solano and Huddleston, 2020): migrant workers, reunited family members and permanent residents enjoy basic security, rights, and protection from discrimination. These areas of national integration policies are stronger within Europe and in line with the EU law. On the other end, the education and political participation of immigrants have been detected as areas of weakness internationally.
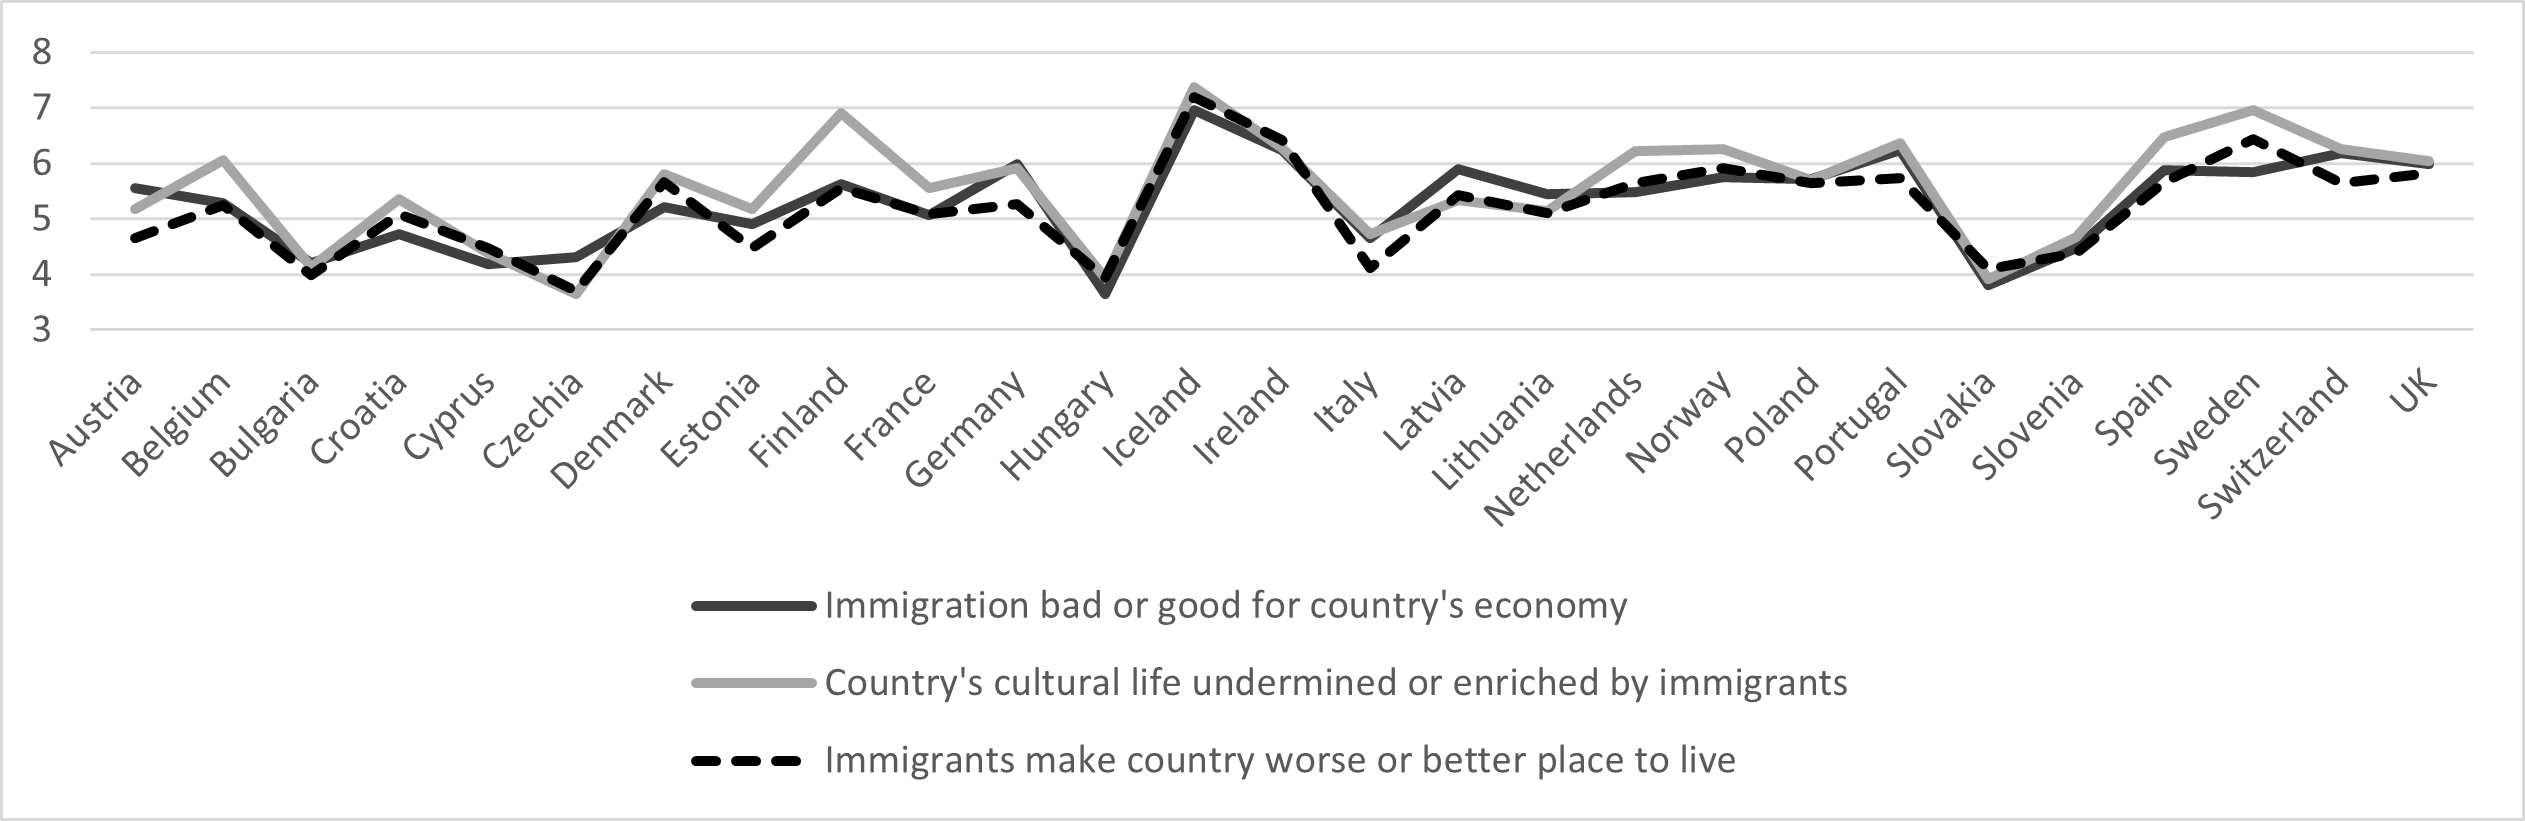
Further on, the descriptive analysis of the ESS indicators on attitudes towards immigrants is presented in Figures4 and5. The data show that residents of Iceland express the most positive average attitude towards immigrants (Figure 4): they estimate the most positive effect of immigrants on the country’s economy and cultural life, while also estimating the country, in general, as being a better place with immigrants. Iceland is closely followed by Sweden and Ireland, whose residents are, nevertheless, more careful in their estimation. Most of the countries are positioned in the middle of the 11-point scale, indicating an overall moderate effect of immigrants on life in the country, although with a weak inclination towards more positive attitudes. Czechia recorded the most negative perception of immigrants, followed by Hungary and Slovakia.
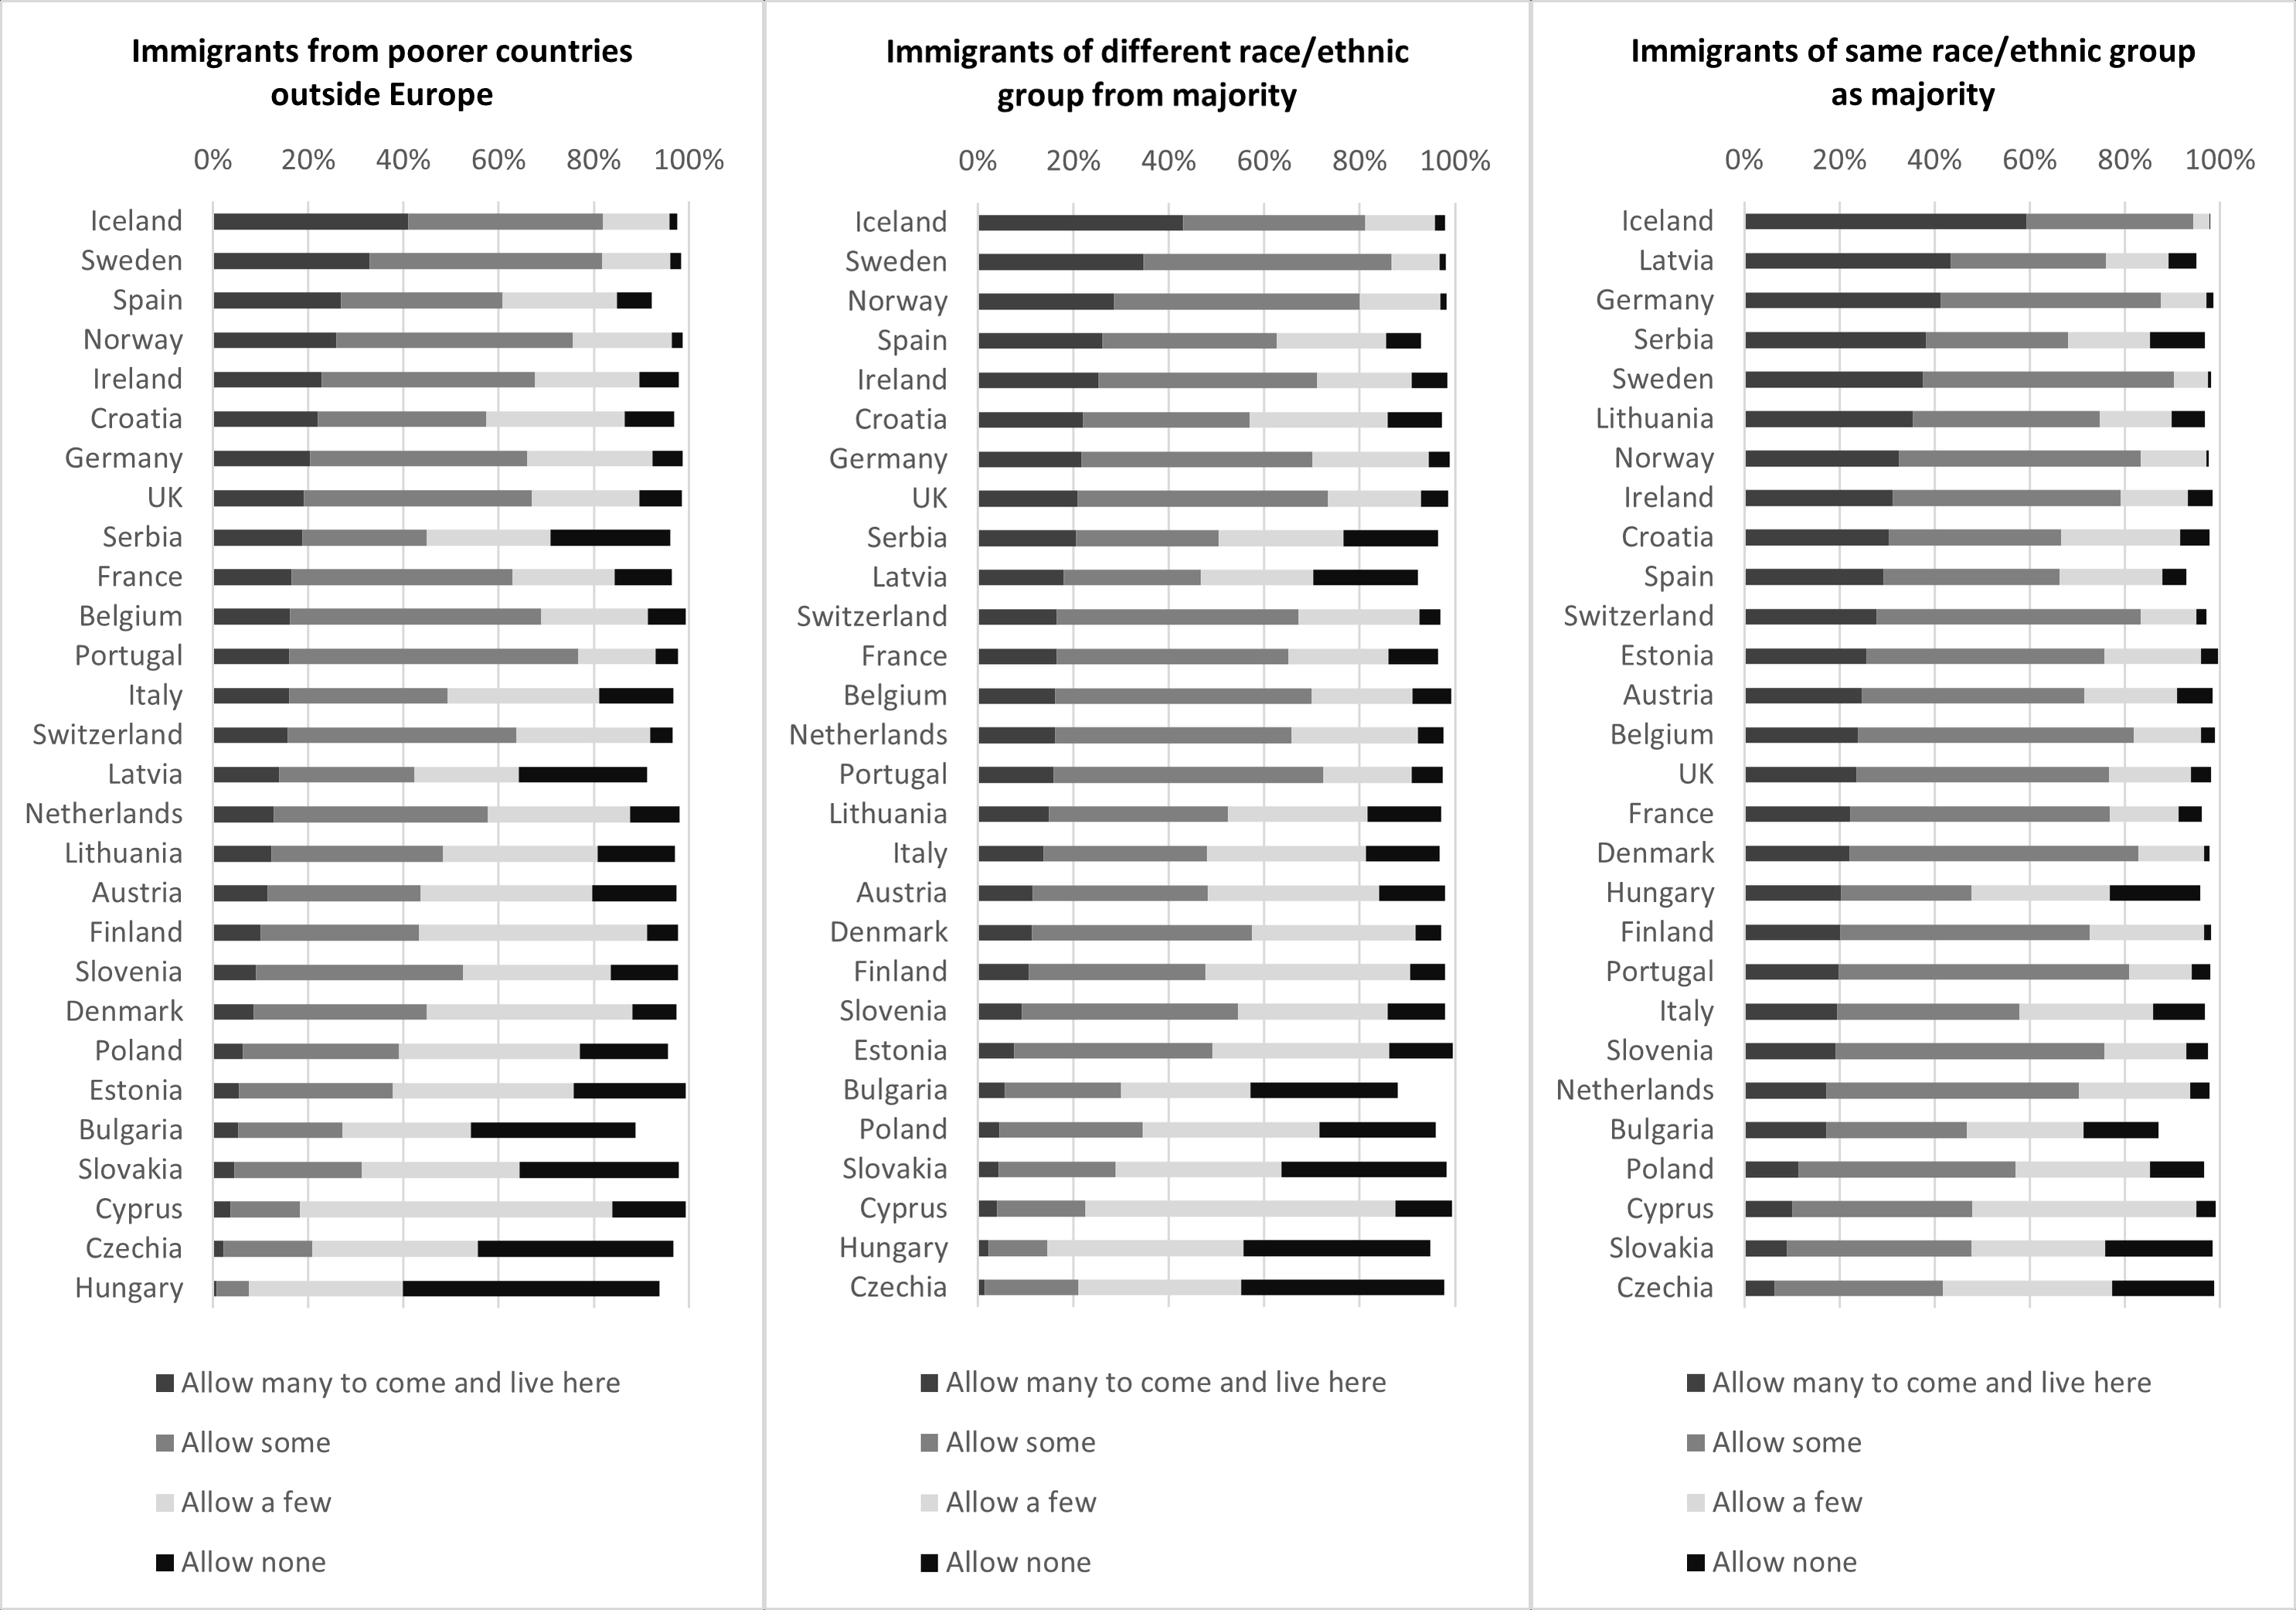
These attitudes are further confirmed when analysing the average estimation of a desirable number of immigrants from poorer countries or immigrants of different ethnic origins, who would be admitted by the residents of these countries in very small numbers (Figure 5). Sorted by the highest estimated number of desired immigrants, the results again bring forward the residents of Iceland. However, the estimation is quite variable when considering the ethnic origin of immigrants. Notably, the respondents are more prone to admit immigrants when they are of the same race/ethnicity as the majority population in the country. The most rejected are the immigrants coming from poorer countries outside Europe. This is especially evident in Hungary, where over half of respondents would admit none of such immigrants, or in Bulgaria, Slovakia and Czechia, where one-third of the respondents share that opinion. Moreover, over one-third of the respondents from these countries would admit none of the immigrants of a different race or ethnicity.
On the other side, besides the “leading” Iceland, the respondents from Sweden, Norway and Spain are more prone to accept immigrants of a different race/ethnicity, coming from poorer countries outside Europe while respondents from Latvia and Germany are more inclined to accept the immigrants of the same race/ethnic group as the country’s majority.
Bringing together two sets of data made it possible to determine the differences in attitudes between the residents of different countries based on their approach to integration. The correlations between all analysed variables (Table 3) are mostly statistically significant. The correlations between criterion and predictor variables, even though significant, are relatively weak, especially in cases of individual-level religiosity indicator and MIPEX indicators on family reunion, permanent residence, and anti-discrimination, wherein the significance of these relationships could be ascribed to a large sample. On the other side, the correlations between predictor variables are quite stronger and range up to .767 between MIPEX political participation and access to nationality and .726 between MIPEX labour market mobility and education. Several more relationships are moderately strong: e.g., .657 between the proportion of EU-27 immigrants in the population and MIPEX health and .645 between MIPEX family reunion and permanent residence. However, most of the relationships between individual-level and country-level predictors could be described as very weak while correlations between other country-level predictors as weak to moderate.
*p<.05; ** p<.01
The next step was to calculate the effects of MIPEX countries’ approach to integration (as a country-level predictor) on average attitudes towards immigrants measured by one composite and three single ESS indicators (Table 4) using the estimation of the mean within the complex samples general linear model. Four distinct categories of integration approaches differ significantly in all estimated attitudes. The results show that, on average, respondents originating from the countries with the most open, comprehensive integration policies express the most positive attitude towards immigrants. They are followed by respondents from the countries adopting the temporary integration approach who, on average, express a significantly less positive attitude towards immigrants than the respondents from countries with the comprehensive integration approach in all measured aspects except regarding the scale indicating opposition to immigration, where these two groups do not differ significantly.
The least positive attitudes towards immigrants are expressed by the respondents from countries that have not adopted any immigrant integration policies. In comparison to this group, the respondents from countries that have adopted the equality on paper integration approach share a slightly more positive attitude towards immigrants in all estimated indicators. These findings suggest that residents of countries adopting the comprehensive integration approach perceive immigrants as a greater economic, cultural, and overall asset to the receiving countries than any other group of respondents based on their country’s approach to integration. On the other side, residents of countries with no or only proclaimed but not exercised integration policies express, on average, the most negative attitudes towards immigrants, do not perceive any contribution of immigration to any field of the economic or cultural life of their country and are, in general, opposed to immigration to a greater extent.
The final analyses measure the effect of the selected individual- and country-level indicators on the attitudes towards immigrants. Three criterion variables indicate different aspects of the attitudes towards the integration of immigrants – real threat (economic), symbolic threat (cultural), and opposition to integration (country worse/better place to live), measured by 11-point interval scales. Using the hierarchical regression analysis, three models were tested (Table 5). The first model included individual-level control variables: immigration status, age, education, socioeconomic status, political orientation, and level of religiosity – all previously determined by several studies (e.g.,Chandler and Tsai, 2001;Rustenbach, 2010;Cowling et al., 2019) as reliable predictors of anti-/pro-immigration attitudes. The second model included country-level indicators: overall MIPEX2020 score and the total number of immigrants. Finally, in the third model, the overall and total country proxies were replaced with specific scores on MIPEX policy areas and division of immigrants to those originating from EU-27 countries and non-EU-27 countries.
Individual-level predictors explain up to 12.9% of the variance of criterion variables – chiefly the cultural aspect of immigration effect. After controlling for the immigration status, which has proved to significantly differentiate between native and immigrant respondents in all analysed models and regarding all criterion variables, most of the individual predictors correlate with the perception of immigrants as a threat and the expression of opposition to immigration. Education level has the strongest effect on all three criteria, implying that the less educated respondents perceive immigrants as a greater real and symbolic threat and oppose migration more strongly. Further on, politically left-oriented respondents and those originating from wealthier households express weaker opposition to immigration and perceive immigrants less as a threat. Younger respondents tend to perceive immigrants as more of a cultural and overall strength for the receiving country, while less religious respondents perceive immigrants as making the country a worse place to live. However, the effects of level of religiosity, and especially age, are quite weak and possibly significant due to the large sample size.16
These indicators remain statistically significant after introducing country-level indicators, which increase the proportion of explained variance to up to 1.6% in the second model and up to 3% in the third. The second model implies that the overall MIPEX score is significantly predictive of all aspects of the perceived impact of integration, noting that the effects are, again, pretty weak. The strongest effect is obtained in the case of estimation of cultural life. The second country-level indicator introduced into this model is significant only with regard to the economic dimension of integration and the overall effect of immigration, indicating that a higher proportion of total immigrants in the population contributes to a more positive perception of immigrants in the economic domain. Nevertheless, immigrants are not perceived as contributing to the country in general. Further on, separating immigrants by their country of origin in the third model indicates significant and interesting results: EU-27 citizens are perceived positively only within the economic aspect of immigrant integration. On the other hand, a higher proportion of immigrants of non-EU-27 descent affects all three attitudinal constructs negatively. In other words, the higher the proportion of non-EU-27 immigrants in the country, the worse perceived their impact on the country’s economy, cultural life, and overall life. The division of the MIPEX2020 score to separate domains indicated a relatively variable effect on attitudes towards immigrants in terms of statistical significance, direction, and relatively weak effect size, so these results should be understood merely as an indication of the relationship and a starting point for further analyses. Based on the size of the effect, the strongest and most stable effect is contributed to by the policies on political participation, indicating that more regulated political participation of immigrants correlates to more positive attitudes towards them in all three analysed aspects. On the other hand, developed anti-discrimination policies contribute to stronger real and symbolic threat perception and opposition to immigration. Permanent residency results in opposite directions: relatively weak and negative for the economic, but positive for the cultural aspect of integration. The effect of labour market integration is most evident regarding the overall integration perception, indicating a negative and weak correlation between them. The effects of other MIPEX2020 indicators are practically non-existent, yet significant due to the large sample size. The overall effect of country-level indicators split into specific domains and subcategories proved to be a strong model for explaining attitudes toward immigrants, increasing the explained variance of criterion variables up to 15.9%.
Finally, readers of the Croatian Sociological Review might find it relevant that the results for Croatia on the individual-level model indicate that, besides the significant effect of more positive attitudes among respondents of immigrant background, respondents of left political orientation tend to perceive immigrants less as a symbolic threat and oppose less towards immigration, while respondents from wealthier households perceive immigrants less as a real, economic threat.17
*p<.05; ** p<.01; ***p<.001
DISCUSSION
Bringing together two different-level international datasets on the integration of immigrants yielded results that demonstrate their significant relations. Still, it is not entirely evident that countries with highly developed integration policies also foster residents’ extremely positive attitudes towards immigrants. The examination of the results for each country in both MIPEX2020 and ESS2018 has shown that only Sweden and Norway are among the top five countries in terms of positive attitudes towards immigrants while also endorsing a comprehensive integration approach. This is not surprising since both countries have a long tradition of accepting immigrants and well-developed immigration policies. As stressed by Solano and Huddleston (2020), Sweden’s ambitious policies seem to reach most immigrant residents in need more efficiently than this is the case in other countries. This also allows Sweden to invest in immigrants' skills in a higher proportion than elsewhere in Europe. Norway, on the other hand, has remained in the middle of the “MIPEX charts” among the Nordics, ahead of more restrictive Denmark and Iceland but behind more inclusive Finland and Sweden. However, Norway seems to nurture the domicile population to have a positive perception of immigrants. Finland, Belgium, Portugal, Iceland, Ireland, and the UK can be found among the highly positioned countries within both studies, all of them recording around 10% of immigrants in the total population. On the other end, Poland and Slovakia can be singled out as the countries with the most poorly developed integration policies proclaiming integration and equality only on paper, accompanied by relatively negative attitudes towards immigrants among their residents. A context-relevant factor for these two countries is that they register a very low proportion of immigrants in their total population. So, Poland and Slovakia have developed binding EU immigration policies even though they do record a small number of immigrant residents, who nevertheless face many obstacles – especially in areas such as labour market, education, health, and political participation. Solano and Huddleston (2020: 196, 216) trace these poor policies to general negative public attitudes, creating a “vicious circle” of exclusion that reinforces fear and separation in both Poland and Slovakia.
Furthermore, differences in general MIPEX scores between the 2015 and 2020 cycles indicate a positive shift in the integration policies among most of the analysed countries, especially those ranked at the bottom and middle of the scale, even though the registered improvement of the results did not change the integration category of the country (seeSolano and Huddleston, 2020). Estonia (+7) and Iceland (+5) recorded the largest positive shift in their immigration policies, while the largest negative shift was seen in Denmark (-4) and Norway (-3), the countries which were among the frequently chosen destination countries for refugees arriving in Europe during 2015 and 2016. Nonetheless, the shift in the MIPEX score (i.e., institutional-level) is much less evidently related to the increased accommodation of refugees in comparison to more context-sensitive changes in public attitudes, as will be elaborated further in the discussion.
Other obtained results also confirm these findings: the residents of countries adopting the comprehensive integration approach would, on average, accept more immigrants of different ethnic and country origins and perceive immigrants as a greater economic, cultural, and an overall asset to the host countries than any other group of respondents based on their country’s approach to integration. On the other side, residents of countries with no or only proclaimed but not exercised integration policies express, on average, the most negative attitudes towards immigrants and do not perceive any contribution of immigration to any field of the economic or cultural life in their country. Callens (2015) reached similar conclusions in her analyses, stressing that more inclusive integration policies may reduce the general public’s feelings of being threatened and, perhaps, anti-immigrant attitudes. Contesting the group threat theory and confirming the normative theory determinants, the findings imply that inclusive policies reduce the level of the perceived threat and serve as an indicator of the level of trust that society places in immigrants, while exclusionary policies tend to reinforce these perceptions (Callens, 2015). In other words, integration policies serve as the normative framework of intergroup relations, therefore affecting and regulating the public opinion (Schlueter et al., 2013;Weldon 2006), whereas especially a higher MIPEX score could be considered a stable (however, often relatively weak) predictor of anti-immigrant prejudice (Hooghe and de Vroome, 2015;Schlueter et al., 2013).
When it comes to specifying the impact of different areas of integration policies, the results show that policies have a significant effect as predictors of attitudes towards immigrants in all areas except the health domain. However, they differ in their direction and strength, and in most cases their effect size is negligible. The strongest effects were registered by the weaker regulation of anti-discrimination policies and the stronger regulation of political participation of immigrants, which are related to more positive attitudes towards immigrants. This points to a notion emphasised by Callens and Meuleman (2017: 384) regarding a highly symbolic value of political participation, often very apparent in the media discourse, leading to a clear message about who can participate in terms of political power. The result is in line with the general MIPEX conclusions at the international level, which emphasise the areas of education and political participation as the weakest areas of immigrants’ integration (Solano and Huddleston, 2020). This leads to the conclusion that only the countries with advanced developed integration policies would also regulate these specific areas, therefore pointing to an overall climate of fostering positive attitudes towards immigrants.
The correlations of MIPEX scores and ESS attitudes, even though statistically significant, proved to be very weak. Unlike some other research studies that were conducted on earlier sets of data and in which the MIPEX score was recorded as a significant predictor of economic (but not cultural) threat perception ( Callens and Meuleman, 2017), this study indicated a significant effect of MIPEX on both types of threat perception. Even though the perception of cultural threat might be more difficult to change by policy interventions, while economic threat perceptions find their ground in temporary contextual conditions ( Callens and Meuleman, 2017), it is also debatable how strong a mark the European “migration crisis” has left on the political rhetoric and attitudes towards all types of immigrants. Changes triggered by these events further reinforced the rhetoric of state securitisation and a certain shift in the public perception of immigrants (especially refugees and asylum seekers) – e.g., in Croatia (cf. Župarić-Iljić and Gregurović, 2020) or in Greece ( Hangartner et al., 2019). This expanded the scope of the perceived threat from more segmented towards more general due to greater exposure and sensitivity to migration issues.
Nevertheless, in contrast to some other studies ( Boateng et al., 2020) the proportion of immigrants had a significant, although weak effect on some of the expressed attitudes towards immigrants (real threat perception and opposition to immigration). The result that triggers possible further research is the perception of EU-27 citizens only in a positive light when it comes to assessing their impact on the economy of the host country. A higher proportion of the non-EU-27 citizens is, on the other hand, perceived as a negative effect on all measured aspects of the host country, stressing the possible fear of “unknown” and “different” in the manner of the integrated threat theory ( Stephan et al., 1998).
Finally, individual-level characteristics used as control variables were, as expected, significant predictors of anti-/pro-immigrant attitudes. The results show that immigrants would be more perceived as an overall economic and especially cultural strength for the receiving country primarily by more educated and politically left-oriented, as well as younger respondents, which is consistent with the results obtained in various research contexts (e.g.Chandler and Tsai, 2001;Rustenbach, 2010;Pardos-Prado, 2011;Scheepers et al., 2002;Semyonov et al., 2006). This suggests that more open and tolerant perceptions are held by highly educated and younger (and possibly more informed and involved) respondents than by the lower educated segments of the population who “may interpret policies that support diversity more in terms of exclusion, benefitting only minority groups and threatening the position of majority members, related to the anti-multiculturalist rhetoric of the populist right” (Hooghe and de Vroome, 2015: 764).
Even though there might be a number of other significant effects and intervening factors in the relationship between the macro (policy) and micro (individual) level in the field of immigrant integration, some authors emphasise the role of intergroup contact. Green et al. ( 2020: 642), for instance, point out that “inclusive integration policies foster everyday contact with immigrants, alleviate national majority members’ associations of immigration-related threat, and reinforce the threat-reducing effect of everyday contact”. Therefore, one of the major goals of policy creators in the field of migrant integration is to focus on the general public and try to bring them closer to the issues and challenges the immigrants are facing in the host society.
CONCLUSION
The results of this study confirm the anticipated relationship between two sets of data: the MIPEX score can be considered a stable but relatively weak predictor of pro-/anti-immigrant attitudes. Residents of countries which adopted more developed integration policies (i.e., represented by a comprehensive integration approach) perceive immigrants as a greater economic, cultural, and overall asset to the receiving countries than any other group of respondents based on their country’s approach to integration. This could imply that integration policies serve as the normative framework of intergroup relations, therefore affecting the reduction of negative sentiment and perception of immigrants as a threat. However, MIPEX misses to clearly reflect the possible effect of the European “migration crisis” since the observed changes are mostly not significant. Nonetheless, there is a noticeable decline in MIPEX score in Denmark and Norway, which are the desired countries of destination often chosen by refugees, probably due to the “migrant-friendly reputation” of these countries, which may also indicate a shift in the perception of inclusiveness in parts of Scandinavia (Peroni, 2021;Hagelund, 2020). In this context, it is especially important to note the result that a higher proportion of non-EU-27 immigrants in the country correlates with a more negative perception of immigrants’ impact on the country’s economy, cultural life, and overall life.
Limitations of this study mostly pertain to the cross-sectional nature of the data without a possibility to determine a causal relationship between two sets of data. Further on, operationalisation of indicators may differ in relation to the original conceptual framework of analysed threat perception theories (e.g.,Stephan et al., 1998), so further research studies should address this issue. Finally, other policy-level indicators should also be considered, having in mind weak effect size of MIPEX predictors, as well as other caveats issued on the MIPEX study (e.g.,Gregurović and Župarić-Iljić, 2018).
Nevertheless, having in mind the consequences of the present and possible future “migration crises”, the obtained results may contribute to setting more receptive and inclusive surroundings for all kinds of migrants by keeping and/or improving certain aspects of integration policies of host countries.