
Introduction
Minerals are found in every tissue, fluid, cell and organ of the human body. About 4 % to 6 % of the total human body mass is composed of minerals that are essential to human diet. Due to their nutritional, biochemical and structural functions, essential minerals undoubtedly have considerable roles in human mental and physical health. Any excess or deficiency of essential minerals, above or below critical limits, may cause abnormalities in human physiological system (Zamberlin et al., 2012; Khan et al., 2014).
The main way of uptake of essential minerals to human body is through ingestion of foods and drinking waters. The essential minerals in foods are important for the growth and maintenance of human life functions (Biziuk and Kuczynska, 2007). Among foods, yoghurt, which is produced and consumed in nearly every country of the world, is an important vehicle of essential minerals to human population (Guler and Sanal, 2009; Llorent-Martínez et al., 2012). Yoghurt is produced with fermentation of milk by yoghurt bacteria, namely Lactobacillus delbrueckii subsp. bulgaricus and Streptococcus thermophilus. The metabolic activity of yoghurt bacteria is controlled by cooling of yoghurt when pH reaches about 4.6 due to fermentation process (Tamime and Robinson, 2007). A high proportion of essential minerals in milk are associated to casein micelles (Pashkova, 2009). The reactivity, structure and composition of casein micelles are changed by the lower pH of yoghurt, which causes the modification of mineral equilibrium. Yoghurt substantially contributes to the intake of essential minerals probably because of its lower pH (Bilandzic et al., 2015; Souza et al., 2019).
Yoghurt is one of important sources of macro and micro minerals. However, the mineral content of yoghurt can be influenced by the technological processing used in its manufacture (Miller et al., 2007; Souza et al., 2019). The manufacturing process of yoghurt consists of different processing stages. One of the most important stages is the standardization of the total solids content of yoghurt milk. The standardization is carried out with increasing the total solids content of yoghurt milk which improves nutritional and functional properties and prevents textural defects, including less gel firmness and serum separation. A number of various methods, such as addition of milk powder and evaporation under vacuum can be used for increasing non-fat milk solids in yoghurt milk (Uysal et al., 2003; Karam et al., 2013). Moreover, yoghurt curd can be strained in a cloth bag by removing yoghurt whey or can be subjected to the mechanical separation process using a centrifugal separator or membrane techniques by separating yoghurt whey from the curd in order to standardize the total solids content of yoghurt (Bong and Moraru, 2014).
Although various studies on the determination of mineral content of yoghurt have been carried out but, as far as we know, no study has been conducted that compares the mineral contents of the total solids-standardized yoghurts using different methods. The aim was to determine the Ca, K and Mg contents as macro minerals and the As, Cd, Co, Fe, Mn, Ni, Pb, Se, V and Zn contents as micro minerals of the total solids-standardized yoghurts with different methods such as addition of skim milk powder to yoghurt milk, concentration of yoghurt milk by vacuum evaporation, concentration of yoghurt curd in a cloth bag and concentration of yoghurt curd by mechanical centrifugation. Furthermore, the mineral contents of water removed from milk serum through vacuum evaporation and of yoghurt whey obtained from yoghurt curds during concentration in a cloth bag as well as by mechanical centrifugation were investigated.
Materials and methods
Production of the total solids-standardized yoghurts
The total solids-standardized yoghurts were produced by using four different methods as shown in Figure 1. Raw cow milk (pH value of 6.6, total solids content of 11.6 %, fat content of 3.2 % and protein content of 3.1 %) was obtained from the Cattle Farm in Akdeniz University. The milk was skimmed to approximately 0.1 % fat using a cream separator (G140 model, SMS Ltd. Co., Kayseri, Turkey) at about 55 °C. The skim milk was divided into three parts to use for production of yoghurts. Two parts were used for the total solids standardization of yoghurt milk to achieve about 15 % of total solids using two different methods. The third part was used without the standardization of total solids to obtain yoghurt curd. The yoghurt curd was used in the production of yoghurt with about 15 % of total solids by two different methods.
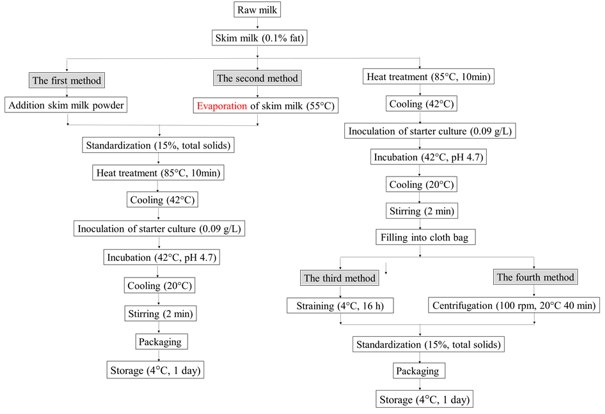
Figure 1. The process flow diagrams of the total solids-standardized yoghurts with four different methods
In the first method, skim milk powder (total solids content of 97.4 %, protein content of 35.5 %, content of 1.0 % fat; Ekso Milk Inc., Antalya, Turkey) was added to the first part of skim milk to give a final total solids content of about 15 %. In the second method, the second part of skim milk was concentrated to about 15 % of total solids content using rotary evaporator (Hei-Vap, Heidolp Instruments GmbH, Schwabach, Germany) at 55 °C.
Moreover, water removed from milk serum through the vacuum evaporation was collected for the mineral analysis and stored at 4 °C for 1 day. The total solids-standardized milk by addition of skim milk powder or vacuum evaporation, called yoghurt milk, was heated at 85 °C for 10 min, cooled to 42 °C, inoculated with 0.09 g/L of starter culture (Danisco Yo-Flex 410, Türker Industry Technic Machine Inc., Istanbul, Turkey), and incubated at 42°C until pH reached to about 4.60. After the incubation, the yoghurts were stirred using a mechanical mixer (Bosch, Mixxo Quattro MSM 7700, Jesenice, Slovenia) for 2 min during cooling to 20 °C. The yoghurts were packaged in cups of 200 mL and stored at 4 °C for 1 day.
The third part of skim milk was heated at 85 °C for 10 min and subsequently cooled to 42 °C. The cooled milk was inoculated with 0.09 g/L of the starter culture. Following the starter culture inoculation, the milk was incubated at 42 °C until the pH decreased to about 4.70. Then, yoghurt curd was stirred using the mechanical mixer for 2 min during cooling to 20 °C. After cooling, the yoghurt curd was divided into two parts, which were used in the production of yoghurt with about 15 % of total solids according to the methods 3 and 4.
In third method, one part was filled into cloth bag and hang on a rack in a refrigerator for 16 h to increase the total solids of yoghurt up to about 15 %. As for the fourth method, the second part was filled into cloth bag and centrifuged at 100 rpm for 40 min at 20 °C using EK 40 mechanic centrifuge (drum diameter of 37 cm, Erba Engineering Machine Inc., İstanbul, Turkey) to increase the total solids of yoghurt up to around 15 %. Then, the yoghurts were packaged in 200 mL cups and stored at 4 °C for 1 day. Moreover, yoghurt wheys obtained during concentration of yoghurt curd in a cloth bag and by mechanical centrifugation were collected for the mineral analysis and stored at 4 °C for 1 day. The yoghurts produced from the total solids-standardized milk by the addition of skim milk powder or the vacuum evaporation were named as yoghurt MiPow and yoghurt VaEva, respectively, while the yoghurts produced from the yoghurt curds concentrated in a cloth bag or by the mechanical centrifugation were named as yoghurt CuBag and yoghurt MeCen, respectively. Meanwhile, yoghurt wheys obtained from yoghurt curds during concentration in a cloth bag or by the mechanical centrifugation were called as yoghurt whey CuBag and yoghurt whey MeCen, respectively, whereas the water removed from milk serum through the vacuum evaporation was called as water VaEva.
Physicochemical analysis
The total solids and protein contents and titratable acidity of the raw milk and yoghurt samples were determined using gravimetric, Kjeldahl, gravimetric and titrimetric methods, respectively. The fat content of the raw milks was measured by Gerber method. The total solids contents of yoghurt whey samples as well as of water removed from milk serum through the vacuum evaporation were determined with the gravimetric method (VDLUFA, 2003). The pH values were measured using a pH-meter (Thermo Scientific Orion 2-Star, Bremen, Germany).
Mineral analysis
Sample preparation and instrumentation
A multi-element mixture solution (multi-element calibration standard 3) purchased from Perkin Elmer Life Sciences Inc. (Boston, MA, USA) was used in this study. The solution consisted of As, Ca, Cd, Co, Fe, K, Mg, Mn, Ni, Pb, Se, V and Zn at 10 mg/L each in 5 % nitric acid. Nitric acid (Suprapur® grade, 65%) and hydrogen peroxide (30 %) were obtained from Merck Life Science (Merck KGaA, Darmstadt, Germany). Deionized water produced in the laboratory using a Millipore ® ultrapure water purification system (Bedford, MA, USA) was used for the mineral analysis. The mineral analysis was carried out according to the slightly modified method of Kilic and Soylak (2020).
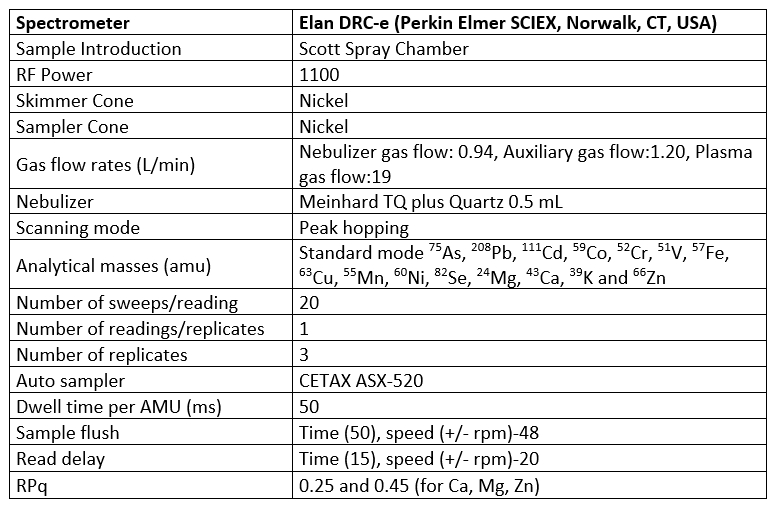
About 0.2 g of the yoghurt and yoghurt whey samples were transferred to the digestion vessel of a microwave digestion system (ETHOS One, Milestone Inc., Sorisole, Italy) and 4 mL of nitric acid, 1 mL of hydrogen peroxide and 2 mL of deionized water were added to each vessel. The microwave oven heating program was carried out in three running steps. As the first step, the temperature was elevated from 70 °C to 120 °C over 5 min at microwave power of 1500 W. The temperature was linearly elevated from 120 °C to 180 °C and held at 180 °C for 15 min at microwave power of 1500 W in the second step. In the last step, the temperature was decreased from 180 °C to 70 °C within 10 min at microwave power of 1500 W. The digested samples were diluted to a final volume of 25 mL with ultrapure water. Microwave digestion treatment was not applied to the water removed from milk serum through the vacuum evaporation, because it was completely dissolved after acid treatment. The mixture of 25 mL of the water and 1 mL of nitric acid was held at room temperature up to 24 hours and then directly introduced to ICP-MS instrument. All measurements were made using a Perkin Elmer ELAN DRC-e Inductively Coupled Plasma-Mass Spectrometry (ICP-MS, Norwalk, CT, USA) instrument to determine the concentrations of As, Ca, Cd, Co, Fe, K, Mg, Mn, Ni, Pb, Se, V and Zn. The matrix reference material (EnviroMAT Drinking Water, High (EP-H), ref. 140-025-032/132, SCP Science, Quebec, Canada) was used for the evaluation of the analytical process. Reagent blanks were prepared to check the possible interferences and contaminations in each set of samples. The ICP-MS operational conditions were summarized in Table 1. In the quantitative analysis of the samples, calibration technique was followed. Calibration standard solutions were prepared in the different concentrations from 10 μg/mL multi element standard solution. The quantification of mineral concentrations was carried out by using a 7-point calibration curve with the concentrations of 2, 5, 10, 25, 50, 100 and 200 μg/L for each mineral.
Table 1. ICP-MS Operating conditions
Method validation
Several parameters were taken into account for the evaluation of the performance of the method in terms of linear range, recovery, limit of detection (LOD), limit of quantification (LOQ), trueness, and repeatability. The LOD was calculated by using 3 times the standard deviation of ten analyses of the lowest calibration standard level while the LOQ was estimated as 10 times the standard deviation (Cindric et al., 2011). The specificity/selectivity of the method (lack of interferences), the values of precision and recoveries of the spiked standards in the defined calibration range were measured. The spiking was done using the calibration standard solution at the three fortification levels, namely minimum, medium and maximum levels. The water removed from milk serum through the vacuum evaporation spiked with 5, 40 and 80 μg/L of the calibration standard solution was used as the sample matrix for precision calculations. The recovery studies were performed by spiking 5, 40 and 80 μg/L of the calibration standard solution to the sample matrix for the Ni, Se and Mn. The recovery studies of the Fe were carried out by spiking levels of 25, 40 and 80 μg/L of the calibration standard solution to the sample matrix due to about 10 μg/L being the lowest point of its calibration curve. For the Zn, Ca, K and Mg, the recovery studies were conducted by using the matrix reference material (EnviroMAT Drinking Water, High (EP-H)) because of their high intensity values. In the recovery studies, the calibration curve prepared by spiking 2, 5, 10, 25, 50, 100 and 200 μg/L of the calibration standard solution to the sample matrix was used. Analytical method validation for mineral analysis was performed in accordance with Eurachem guidelines (EURACHEM, 1998). Performance parameters regarding the mineral analysis were given in Tables 2 and 3.
Statistical analysis
All yoghurt productions were repeated in triplicate. Three replicates of each sample were analysed. The data were analysed using SAS Statistical Software (release for Windows, SAS Institute Inc., Cary, NC, USA). The results were compared by using analysis of variance (ANOVA) and The Duncan's multiple range test.
Results and discussion
The mean total solids contents of the yoghurt MiPow, yoghurt VaEva, yoghurt CuBag and yoghurt MeCen were 15.13±0.36 %, 14.92±0.18 %, 14.91±0.36 % and 15.09±0.13 %, respectively, while the mean protein contents were 6.04±0.08 %, 5.72±0.10 %, 9.12±0.15 % and 8.76±0.19 %, respectively. The mean pH and titratable acidity values of the yoghurts ranged from 4.47 to 4.60 and from 1.10 % to 1.32 %, respectively. Moreover, the mean total solids contents of the yoghurt whey CuBag, yoghurt whey MeCen and water VaEva were 5.50±0.06 %, 6.13±0.11 % and 0.17±0.03 %, respectively.
Some performance parameters including regression equations, R 2 and values of LOD and LOQ of the method for mineral analysis were given in Table 2. The results of the regression equations showed that high linearity (R 2≥0.997) was achieved in the analysed concentration ranges. The LODs for the macro minerals and the micro minerals ranged from 0.2 to 3.4 µg/L and from 17.8 to 114.7 µg/L, respectively, while the LODs ranged between 59.0 and 328.4 µg/L for the macro minerals and between 0.7 and 11.3 µg/L for the micro minerals. The recovery values and precision values (%RSD) are presented in Table 3. The mean %RSD values for the spiked sample matrixes were found to be ≤1.7. The mean recovery values for the matrix reference material ranged from 96.4 % to 102.8 %. The spiked sample matrixes afforded the recovery values in the range 98.5-103.2 %, depending on type of mineral. The specificity/selectivity of the method used in the present study seemed to be acceptable for all minerals analysed because of the recovery values within the range of 80 and 120% (EPA, 1992; Millour et al., 2011).
Table 2. Some performance parameters of the method for mineral analysis (n=3)
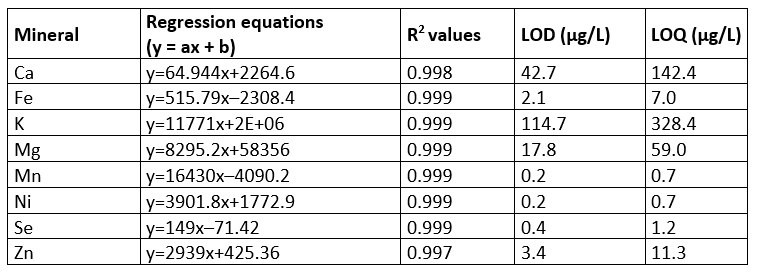
Y - peak height; a - slope; b, intercept; x - concentration of minerals; R 2 - correlation coefficient; LOD - limit of detection; LOQ - limit of quantification
Table 3. Recovery values (%) for the matrix reference material, and recovery values (%) and mean precision values (%RSD values) for the spiked sample matrixes (n=3)
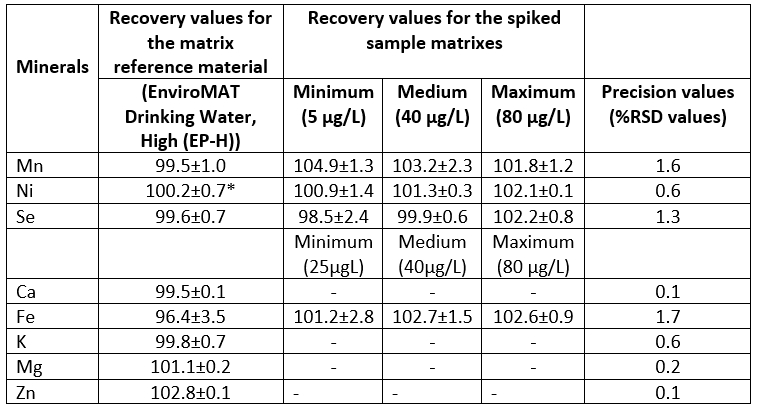
*Values are the means ± standard error
The Ca, K and Mg contents in the yoghurt samples ranged from 870.1 to 1860.0 mg/L, from 2001.2 to 4397.5 mg/L and from 127.2 to 272.0 mg/L, respectively, as shown in Table 4. The concentrations of Ca, K and Mg the yoghurt samples were within the ranges described by Bilandzic et al. (2015). Concentrations of the macro minerals such as Ca, K, and Mg in the yoghurt MiPow and yoghurt VaEva samples were significantly higher than in the yoghurt CuBag and yoghurt MeCen samples. The higher concentrations of the macro minerals in the yoghurt MiPow can be explained by the addition of milk powder with high level of Ca, K, and Mg contents to yoghurt milk and yoghurt production without yoghurt whey separation. In a study examining the effect of increasing of total solids of milk by evaporation on its mineral composition, Markoska et al. (2019) found that the level of the minerals of milk increased with the rise in concentration which was attributed to transfer of minerals in milk serum into the casein micelle during evaporative concentration of milk.
However, there was no significant difference in the contents of Ca, K, and Mg between the yoghurt CuBag and the yoghurt MeCen.
During the yoghurt whey separation process in the production of the samples of yoghurt CuBag and yoghurt MeCen, which were produced in the same way as the production of strained yoghurt, the large amount of the macro minerals was separated with the yoghurt whey. The Ca, K and Mg contents in the yoghurt whey samples ranged from 838.5 to 886.0 mg/L, from 2191.0 to 2225.5 mg/L and from 136.0 to 140.5 mg/L, respectively. In a study on determination of mineral contents of yoghurt whey obtained from yoghurts during concentration in a cloth bag, Kose et al. (2019) reported that the contents of the Ca, K and Mg varied from 1034.5 to 2627.9 mg/L, from 682.5 to 2595.3 mg/L and from 469.5 to 1940.0 mg/L, respectively. Kirdar et al. (2017) found that the mean Ca, K and Mg contents of yoghurt whey samples collected from dairy plants were 934 mg/kg, 1257 mg/kg and 969 mg/kg, respectively. The contents of Ca and Mn in the yoghurt whey in the present study were lower than those reported in the previous studies. The K contents in the yoghurt whey were within the ranges found by Kose et al. (2019) but were lower than that reported by Kirdar et al. (2017). The differences may be attributed to the differences in mineral content of milk used in the production of yoghurt, processing conditions of yoghurt and analysis method of minerals.
Table 4. Macro and micro mineral composition of milk, milk powder, yoghurt, yoghurt whey, as well as water removed from milk serum through vacuum evaporation (n=3)
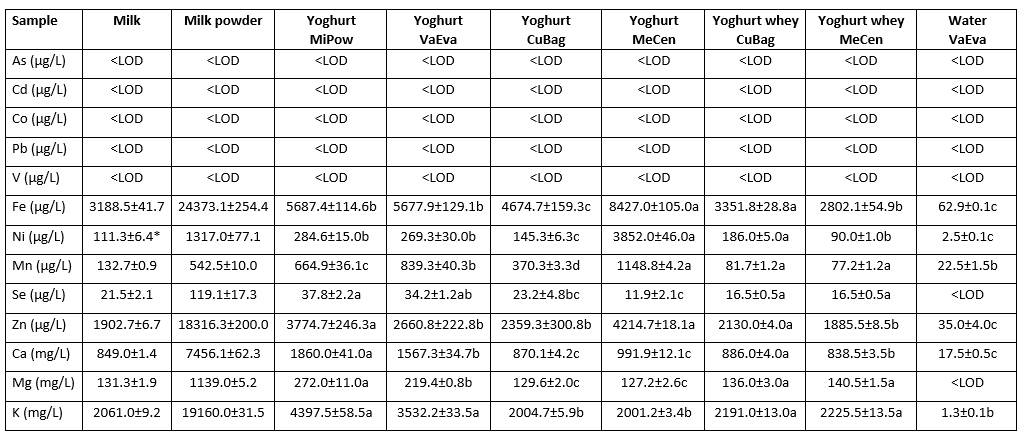
*Values are the means ± standard error; LOD, limit of detection; different superscript letters among yoghurts and among yoghurt whey CuBag, yoghurt whey MeCen and water VaEva in a column show significant difference at p<0.05.
As shown in Table 4, the mean Ca content in the water VaEva was about 51 times lower than in the yoghurt whey CuBag and about 48 times lower than in the yoghurt whey MeCen, while the mean K contents in the yoghurt whey CuBag and in the yoghurt whey MeCen were about 1826 times and 1855 times, respectively, higher than that in the water VaEva. The average Mg contents of the yoghurt whey obtained from yoghurt CuBag and yoghurt MeCen samples were 136.0 mg/L and 140.5 mg/L, respectively, whereas the average level of Mg in water VaEva was lower than LOD of the method. Among macro minerals, the K contents of the yoghurt whey CuBag and yoghurt whey MeCen were the highest in comparison to the contents of Ca and Mg. In addition, the content of Mg in the yoghurt whey CuBag and yoghurt whey MeCen was lower compared with the contents of Ca and K. The K mineral is easily separated with yoghurt whey because of its more than 90 % being in free form in milk and milk products. The Mg mineral is bound to non-phosphorylated parts of caseins like the Ca mineral, but more Ca than Mg is carried over into yoghurt whey due to fact that the Mg element is usually in combination with inorganic phosphate (Kose et al., 2019). Guler (2007) investigated the contents of various macro and micro minerals in raw goat milk and its strained yoghurt, and reported that the concentrations of Ca, Mg and K in strained yoghurt with total solids of 17.82 % were significantly higher than in raw goat milk with total solids of 12.32 % due to higher total solids content of strained yoghurt. In the present study, there was no significant difference (data not shown) in the concentrations of Ca, Mg and K between the cow milk with total solids of 11.6 % and the yoghurt CuBag with total solids of 14.91 %, which was produced with same method as used by Guler (2007) in the production of strained yoghurt. In addition, Gambelli et al. (1999) reported that there was a direct correlation between Ca and Mg minerals in some dairy products. In the present study, the Ca and Mg minerals showed similar increasing trend throughout the yoghurt manufacturing from raw cow milk.
Concerning micro minerals, no samples contained As, Pb, Cd, Co or V (<LOD). The 5 micro minerals such as Fe, Mn, Ni, Se and Zn were detected in the yoghurt and yoghurt whey samples, but the 4 micro minerals, except for Se, were found in the water VaEva. Among micro minerals, the Fe contents in yoghurt samples were the highest in comparison to the contents of other micro minerals, while the Se contents in yoghurt samples were the lowest. The concentrations of Fe, Ni and Mn in the yoghurt MeCen were higher than those in the other yoghurt samples. The Zn contents in yoghurt samples MeCen and MiPow were found to be higher than those in either the yoghurt CuBag or the yoghurt VaEva. In addition, there was no significant difference in the content of Zn between the yoghurt MeCen and the yoghurt MiPow and between the yoghurt CuBag and the yoghurt VaEva. The higher content of Zn in the yoghurt MiPow is possibly due to the addition of the milk powder with high level of Zn content to the yoghurt milk during the production of the yoghurt MiPow. However, the higher contents of Fe, Ni and Mn in the yoghurt MeCen may reflect the presence of these minerals in the mechanic centrifuge used in the whey separation process during the yoghurt production, as previously reported by Garcia et al. (1999) and Souza et al. (2019).
The Zn and Mn contents in the water VaEva were lower than those in the yoghurt whey samples. The Zn and Mn minerals are mainly bounded to the casein in milk. The ionization of the acid functions of the casein is affected by the decreasing pH of milk, which caused the separation of the Zn and Mn minerals from the casein fraction of milk (Cichoscki et al., 2002). The transmission of Zn and Mn from yoghurt curd into yoghurt whey may be induced by the low pH of yoghurt such as in the yoghurt whey CuBag and yoghurt whey MeCen samples.
The Se contents in yoghurt samples MiPow and VaEva were higher than those in samples CuBag and MeCen. The yoghurt whey obtained from the yoghurt samples CuBag and MeCen had the same content of Se, 16.5 µg/L, whereas the Se content in the water VaEva was lower than the LOD of the method. The Se content was lower in the raw cow milk than in the milk powder as shown in Table 4. The higher content of Se in the yoghurt MiPow is possibly because of the added milk powder with high level of Se content to the yoghurt milk in the production of the yoghurt MiPow. Debski et al. (1987) reported that the Se in cow milk was incorporated into proteins which may account for the lower Se contents in the yoghurt samples CuBag and MeCen in comparison to that in the sample VaEva. The whey separation processes applied during the productions of the yoghurt CuBag and the yoghurt MeCen may disrupt the association of Se with milk proteins and may cause in the higher Se contents in the yoghurt whey CuBag and yoghurt whey MeCen samples compared with the Se content in the water VaEva sample. The contents of Mn, Se and Zn in the yoghurt whey in the present study were lower than those reported in some previous studies (Guler and Sanal, 2009; Kose et al., 2019). However, the Fe contents in the yoghurt whey were higher than those observed by Guler and Sanal (2009), but lower than those observed by Kose et al. (2019). The differences may be due to the differences in mineral content of milk used in the production of yoghurt, manufacturing conditions of yoghurt and analysis method of minerals.
Conclusion
In this study, the contents of some macro and micro minerals which have nutritional and/or toxicological properties, in the total solids-standardized yoghurts with four different methods were determined by using ICP-MS. The results obtained in the present study showed that the mineral content of yoghurt was significantly affected by the method of total solids standardization used in its manufacture. The macro mineral contents such as Ca, K, and Mg were found to be higher in the yoghurts produced from the total solids-standardized milk with the addition of skim milk powder or by the vacuum evaporation compared to in the yoghurts produced from the yoghurt curds concentrated in a cloth bag or by the mechanical centrifugation. The Fe, Ni, Zn and Mn contents as micro minerals were the highest in the yoghurt produced from the yoghurt curd concentrated by the mechanical centrifugation. Macro and micro mineral contents of the yoghurt whey obtained from yoghurt curds during concentration in a cloth bag or by the mechanical centrifugation were higher than those of the water removed from milk serum through the vacuum evaporation. As a result, it is possible to modify the mineral content profile of yoghurt by using different methods for its total solids standardization in order to increase or decrease the amount of some minerals in yoghurt as desired.
Učinak različitih metoda standardizacije ukupne suhe tvari na mineralni sastav jogurta
Sažetak
Jogurt je dobar prehrambeni izvor makro i mikro elemenata. Međutim, udio mineralnih tvari u jogurtu može varirati ovisno o tehnološkoj obradi koja se koristi za njegovu proizvodnju. U skladu s tim, cilj ove studije bio je usporediti sadržaj nekih makro (Ca, K i Mg) i mikro (As, Cd, Co, Fe, Mn, Ni, Pb, Se, V i Zn) elemenata u ukupnoj suhoj tvari jogurta s standardiziranoj primjenom sljedeće četiri metode: (1) dodavanje obranog mlijeka u prahu; (2) koncentriranje mlijeka uparivanjem u vakuumu; (3) koncentriranjem koaguluma jogurta u sirarskoj vreći; i (4) koncentriranjem koaguluma jogurta mehaničkim centrifugiranjem. Najveći sadržaj makro elemenata utvrđen je u jogurtu proizvedenom metodom 1, dok je najveći sadržaj većine mikro elemenata utvrđen u jogurtu proizvedenom metodom 4. Rezultati ove studije pokazali su da se sadržaj mineralnih tvari u jogurtu može podešavati primjenom različitih metoda standardizacije ukupne suhe tvari.
Ključne riječi: jogurt , makro elementi, mikro elementi, standardizacija ukupne suhe tvari