
INTRODUCTION
Nowadays “smart city” is one of the most common expressions, which can be found everywhere, but the real extent of which is poorly defined or not defined at all. Everybody has their own notion of it, and there can be found the broad-, the data-driven-, and the citizen-focused definitions depending on which sector is in the focus. Some rarely defined notions include livability and sustainability1. One of the keystones of the smart city is the medical area. Healthcare plays a crucial part in the way people feel about city life, and its significance is constantly growing. Health care centers and hospital building structures will change in smart cities, because of the increasing trend of in-day surgery procedures, smart bracelets and additional wearable sensors, which give a better and more accurate possibility to set up a diagnosis from a distance. It means that the functionality of medical centers and hospitals will constantly change, the number of bedridden places will decrease, research and development and IT areas will rise, and fast-medical areas will multiple. The result of the above-mentioned processes is that much more patients will be visiting the buildings near to the high security R&D and IT areas. That means a rise in incidences of robbery, vandalism, and even terrorism, because of radioactive and psychoactive materials. The new concept of medical and health care centers of smart cities causes great difficulty for the security systems. For patients it is a good experience to enter a spacious friendly area without any restrictions, which can significantly reduce the stress factor and can give a healthier atmosphere, while the opposite of this means that nobody is allowed to enter the medical treatment and research area without authorization. The facility management has to know the state of the building’s security risk in every moment to reduce it and to be able to give prompt answers to any needs for changes, as well as to follow the changes of medical areas. Our thesis states that with a fuzzy-based expert analysis we will be able to generate a special event tree analysis which shows the efficiency of the complex security system.
ENVIRONMENTAL RISK OF THE HEALTH CARE AND MEDICAL AREAS
New smart cities need the above-mentioned medical services with optimized function. On a minimized territory it is an essential condition, which concentrates the quantity of patients and all other employees, like healing, research, education, IT, R&D etc. The new sections of the medical area, for example diagnosis from distance, big data-based medicine research, blockchain technology, virtual rehabilitation2 comprise diverse outdoor and indoor facilities with 7/24 work. Diagnosis from distance will bring an explosion of treatments in the near future, as new wearable devices will be able to send personal data directly to health center servers, where an AI application will predefine the diagnosis and will send it to the doctor, who send it to the patient, and from distance can be stimulate the patient for the healing. Every step of this diagnosis from distance procedure is full of security risk. The big data-based AI drug and medicine research applications give the opportunity to provide oncology a good method for precision medicine research3. There is a crucial need to guard patients, visitors, employees, goods, infrastructure, and assets against possible threats. It can be seen that all medical centers’ entrance is open, but the research and IT facilities in particular have become at least as vulnerable as airports. They must therefore, meet very demanding criteria with regard to security, safety, communications, and building automation – also to uphold their reputation as providers of safe, well-organized services that patients and visitors can rely on. It is clear that the operation of new medical centers generates security challenges of the complex system, because it has to prevent and respond to in- and outside vandalism, robberies, sabotage and terrorism. When the security challenges are successfully met, it gives employees and patients confidence in the safety of healthcare centers. Over the patients’ best practice of the health care and medical centers, we have to find out what kind of new features will be implemented in the treatment, then we will be able to get information about the change of the environment.
OPERATIONAL MODEL OF THE ANALYSIS OF THE COMPLEX SECURITY SYSTEM OF MEDICAL AREAS
In this article we define that the complex security system contains several spherical security layers, from prevention, through the mechanical-, electrical-, human layers to insurance. For the better understanding of the complete security system, it is indispensable to clarify the main connections in the system. The health care center’s security analysis without any predefined model has shown a difficult diagram with uncountable variables, events, connections and values. To prevent the malfunctions and to get the highest efficiency of the complex security system it is needed to generate a special pointer that can show the momentary state of the protection. It can be useful for facility management to get on-line information about the level of the whole system. For a pointer generation the first step is to determine the inputs, the variables, the outputs and the functions of the complex security system in health care centers or hospitals with their inner connections. The following subsystems can be found in the complex security system of our medical center. The peripheral elements of the system include the preventive security actions, which has - from the building’s structure to the well represented hospital regulations – a wide spectrum. It is followed by the mechanical protection sphere where other protection areas get “time” to generate true alarms and to stop hazards. The next element is the access control area which connects the mechanical devices with the electrical signal control devices. Then comes the human force that can respond to the signal. Technical signals can be controlled from a Center and commands will be sent from here. The guards and the patrols can solve unexpected security or hazard situations. With the above-mentioned elements, the operation diagram of the global security system of health care centers is shown in Figure 1. The model is designed for the inner connections of the global security system. The arrows represent the connections and directions, and the bulk of the area represents the importance of the subsystem. With this structure all probability of the possible participants can be predeclared. The most important task is to declare the probability of the subsystem’s success and fault states. We decided that we would use our earlier research experiences about railway systems, so that we could declare the new probability values of all subsystems and we could implement it to the health care center4. Nowadays it is also necessary to prevent unauthorized entrance into the treatment or research area, but in the near future it will be the highest security risk in hospitals. For security reasons special mechanical elements like lattices, security foils on windows and doors or locks are
installed inside buildings. Bars and traffic control devices at the entrances control vehicle traffic. At other places fence systems are installed. These mechanical devices form the grounds of a complex protection, as these elements give the other subsystems time to sense, transmit and process the signal and start the procedures of protection. The access control system is the bridge between the mechanical and the electrical protection subsystems. We could declare that it is neither a mechanical, nor an electrical part, it is an independent element of the complex system in our cases. The main function of this subsystem is to prevent the unauthorized entrance into the restricted area, but it also generates alarm signals to the ISSC. It is not only for controlling traffic, but it also stores all information with timestamps in a non-volatile memory at the controlled area and sends them into the supervisor system. The electrical protection subsystem contains the video surveillance, the burglar alarm and the gate-phone system. These systems are working together and some inputs and outputs of the access control is integrated here through the ISSC, too. It means a burglar alarm signal can create a video event, so the connected camera will display on the alarm monitor and can also generate an access control event, where all connected electric locks are disabled, only the security guards are allowed to pass through these gates. The “human” security of the complex system is the most important element, because without any physical force the security system would not be effective. It has two independent parts, the first one is for the security of the building, where guards stand on a pre-defined place (e.g. on the passenger and the industrial entrances of railway stations) of the area, check the traffic and operate the mechanical, electrical, and access control systems. The other part of the human security is the patrol. They are well trained guards divided into small teams. They patrol the area, to prevent the hazards of unattended baggage or unauthorized entrance. Their official uniform and demonstrative physical presence gives a feeling of security in the area, which can reduce the possibility of hazards. In an unexpected event the Integrated Security Supervisor Center (ISSC) can send these teams immediately and directly to the place at risk to prevent or to solve the problems. For the efficient managing of this system, we need a hierarchical structure with well-defined information and command routes. The ISSC ensures the efficient operation of the protection system, which collects all information related to the protection of the inner and outer area and converts them into the same protocol. With the converted and pre-analyzed signals, it can coordinate with the subsystems. It can be seen that the subsystems can work together without the ISSC, but in this case because of the low-level integration their efficiency is poor. To prevent any security hazard or bomb attack, an efficient multilevel (low and high) integrated protection system is needed with well-educated and well-trained operators, patrols and security guards. Without the suited trainings it can occur that the efficiency of the complex system is lower than the separated and low-level integrated systems in a disaster, as because of the latent feeling of security, the response can be slow or wrong.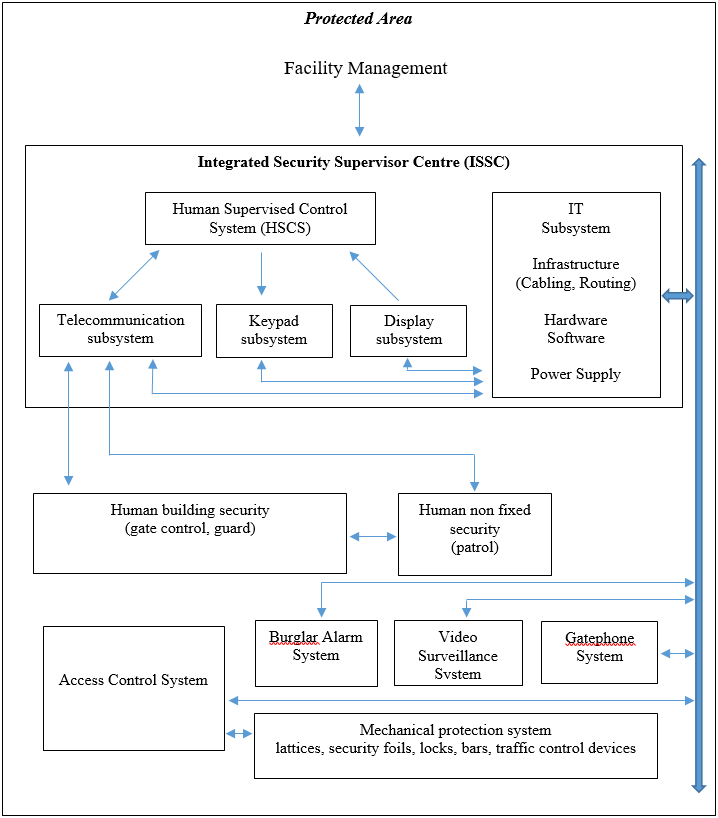
EVENT TREE ANALYSIS
The most important question was what type of probability analysis gives the best performance to the complex security system model of health care centers. We have chosen the Event Tree Analysis (ETA) method. The ETA was developed for nuclear power plants in the 1970s. It needed to reduce the Fail Tree Analysis trees, because they were too big to get all useful information and the solving methods time was very long. The elements of event trees were physical entities that exist in the nuclear power plant and the processes involved in the tree follow engineering and physical principles. The ETA is a forward (bottom-up) symbolic logic modeling technique generated in both the success and failure domain. This method gives us the possibility to explore the complex system’s responses to an initiating event and enables assessment of the probability of the solved or unsolved subsystems’ procedures5. Our complex security system in the health care center territory worked for 2 years. The events were recorded by the ISSC’s servers and the relevant events were directly sent to an independent database storage server. For the best result, the data was checked manually by us and the undefined statuses were regenerated to get a homogenous database. After the verification, the events were sent through a type-selection function and was ordered by event type. We could declare the event types, e.g., stolen objects, brawl, or attack against an employee, missed patients, vandalism, burglar alarms, etc. We thought that the greater quantity of an event type predetermines the probability of the system.
TESTING THE ETA OF THE COMPLEX FOR EFFICIENCY METHOD
At the testing phase we selected the complex security system of a real medical center. We connected to the databases and we scanned all entries. We found that in the database there were more than 2 000 independent events. We made all the auxiliary tables and diagrams to test the method, get enough information to automatize the procedure and make a converter function to the database. To set up the tree diagrams from the converted database events, the following mathematical functions was used where P(S) means the probability of the success events, P(F)-the probability of the fail events, I-the initiating event, AND-the Boolean expression of the logical gate:
P(S)+P(F)=1, (1)
P(S)=1-P(F), (2)
P(I.F_i.S_i )=P(I.AND.F_i.AND.S_i )=P(I)P(F_i )P(S_i ), (3)
P(I.F_i.S_i)=P(I)P(F_i)P(1-F_i). (4)
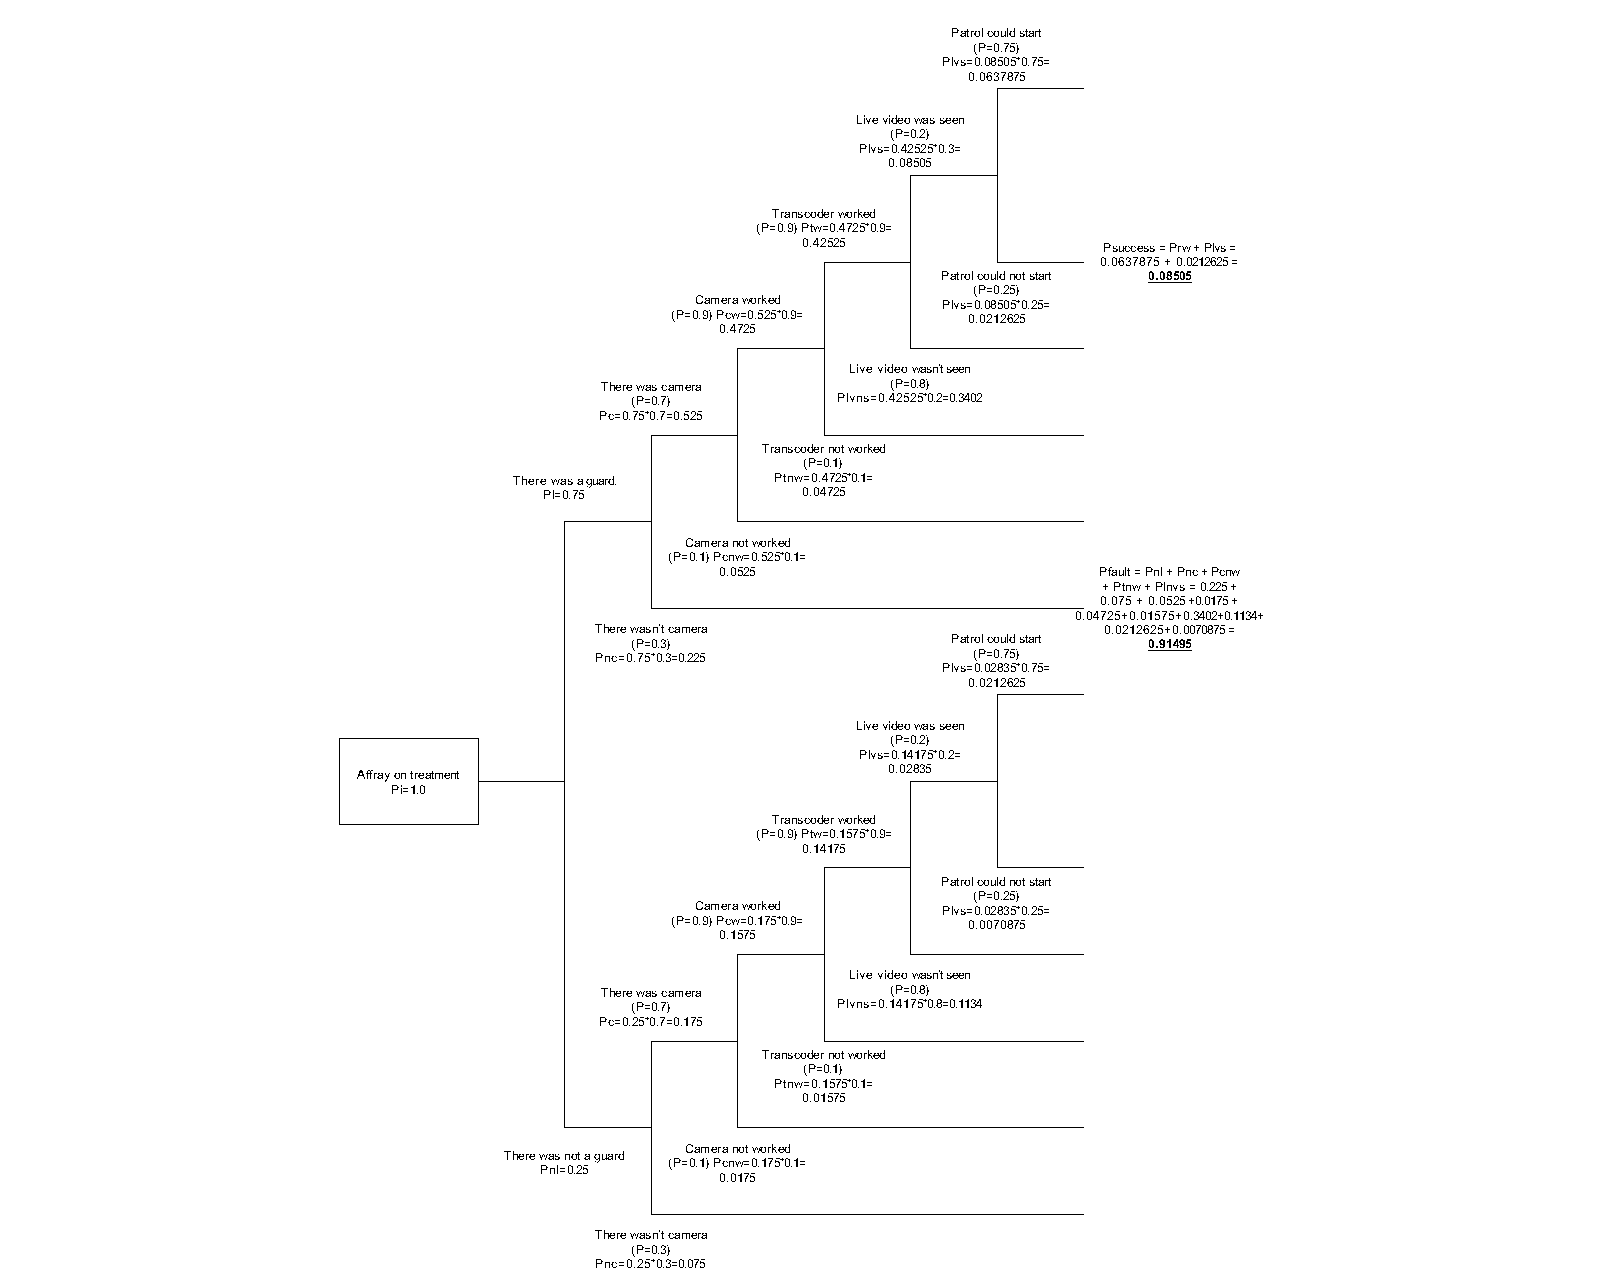
In our case the above functions gave the best result for generating an indicator. We used the following method for designing the event tree: the initiating event was identified in each event type, the system elements and components connected with the initiating event were determined, the event sequences were derived though the different system components assuming the success / failure state, to reduce the complexity of the trees the illogical branches were pruned, the probabilities or the possibilities were assigned for the success and failure states, the probability or possibility of each sequence were calculated, the generated trees were analyzed to check the meaning of the numbers. The following event occurred: from the directors’ room of the health care center two mobile phones had been stolen. The event was reported by the secretary to the guard of the health center, who reported it to the ISSC, where the personnel started the protocol to get the information about the security event. Finally, the police were able to identify the culprit. We tested it in more cases, and we found six independent events. The event tree analysis was made of all cases. We found that the success trees average sum value was 0,4107, from 0,3714 to 0,4401. The fault trees average value was 0,59 from 0,5599 to 0,6286. With our special declaration method, the numbers in the example in Figure 2 mean that the probability of preventing a theft event is 0,3918375. We tested this method on different security parameters on different events. The difference was significant, we found that on those sites where no camera controls were used the success tree maximal sum value was 0,18 and the fault tree minimal sum value was 0,82. It can be said that the success and the fail values can be used as an efficiency indicator in this case. The following event occurred: On the 4th Floor, there was a massive brawl and a hit against a treatment employee. The event was reported by the guard of the hospital to the security center ISSC, where the personnel started the protocol to get the information about the security event. Finally, the patrol of the hospital was able to identify the participants and took them out. The ETA diagram shows that the complex system functionality was near zero, but information about this event is absolutely positive, because the culprits were arrested by the police. We found four independent events in the database with the same event type.
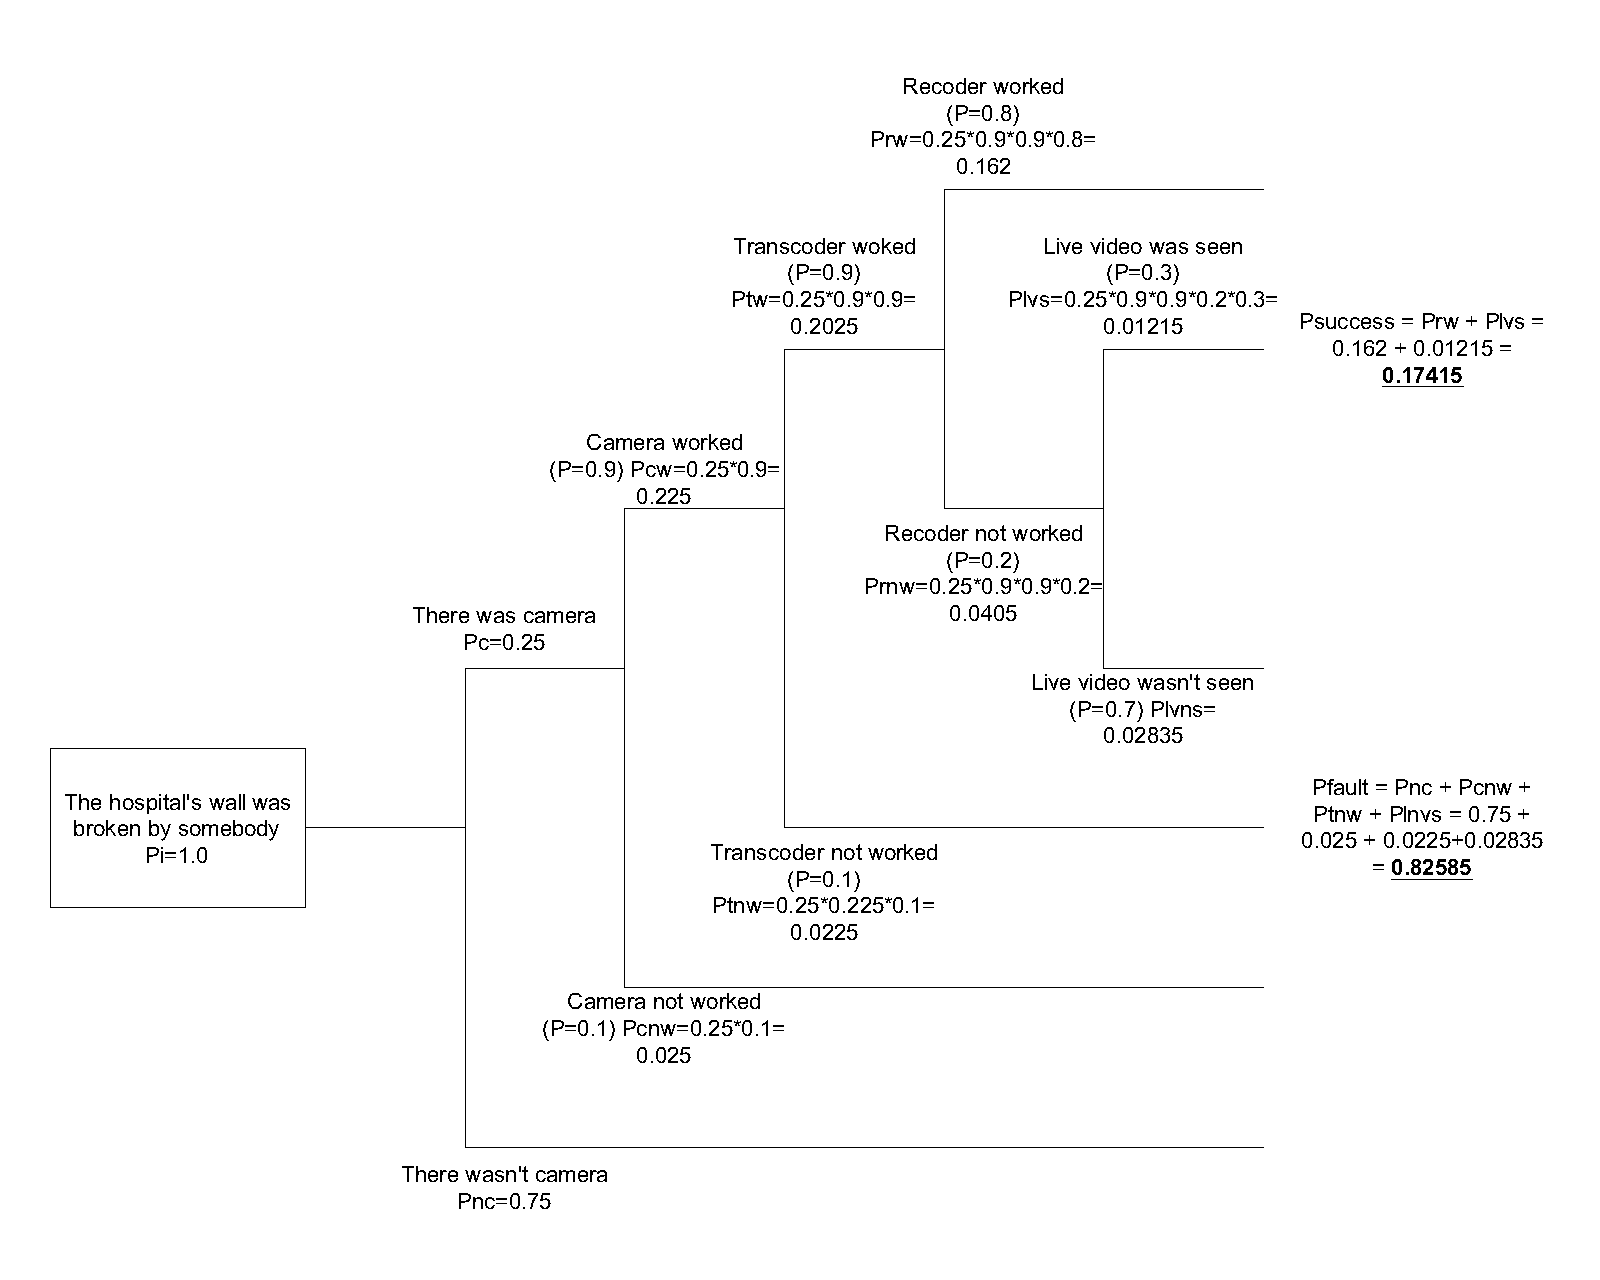
The event tree analysis was made for all cases. We found that the success trees average sum value was 0,0904, from 0,0772 to 0,104. The fault trees average value was 0,9096 from 0,896 to 0,9228. With our special declaration method, the numbers in the example in Figure 3 mean that the probability of preventing an array event is 0,08505. We tested this method on different security parameters on different events. The difference was significant, we found that on those sites where no camera controls were used the success tree maximal sum value was 0,18 and the fault tree minimal sum value was 0,82. It can be said that the success and the fail values can be used as an efficiency indicator in this case. The following event occurred: The wall of the hospital was broken because of vandalism, or for robbery. The event was reported by the guard of the hospital to the security center ISSC, where the personnel started the protocol to get the information about the security event. Finally, the police were able to identify the culprit. The ETA diagram shows that the complex system functionality was near 0,17, but the information about this event is absolutely positive, because the culprits were arrested. We found three independent events in the database with the same event type. The event tree analysis was made for all cases. We found that the success trees average sum value was 0,1764, from 0,1694 to 0,1811. The fault trees average value was 0,8236 from 0,8189 to 0,8306. With our special declaration method, the numbers in the example on Figure 4 mean that the probability of preventing a vandalism event is 0,17415. We tested this method on different security parameters on different events. The difference was not significant, we found that on those sites where no camera controls were used the success tree maximal sum value was 0,08 and the fault tree minimal sum value was 0,92. It can be said that the success and the fail values can be used as an efficiency indicator in this case. The following event occurred: The patient was on a treatment in the hospital – where the interval was indifferent – and during the treatment the patient went missing. The event was reported by the health staff of the hospital to the buildings guard, who informed the security center ISSC, where the personnel started the protocol to get the information about the security event. Finally, the police, or a citizen were able to find the missing patient. On this site there were several independent missing patient events (five events), so we made all the ETA diagrams of them to get more information about the system. After the analysis we found that the same type of complex security systems the success and the fail results gave significantly the same numbers. The success tree average sum value was 0,0534, from 0,036 to 0,072. The fault tree average value was 0,9466 from 0,928 to 0,964. We tested this method on different security parameters on different events. The difference was significant, we found that on those sites where no access control (physical authentication checking point) was used the success tree maximal sum value was 0,03 and the fault tree minimal sum value was 0,97. It can be said that the success and the fail values can be used as an efficiency indicator in this case. The results of the test showed us that the event trees can be used for indicators, but in the complex system the different types of events derive different value spread. It means that the probability numbers cannot be used directly, but there is a possibility to get the efficiency of the system. First, event tree diagrams must be generated for all event types, and the probability and the possibility averages and the spreads can be declared. When a new event occurs and after the analysis the indicator number is over or below the spread, it means that the efficiency of the system is out of the optimal state, so an element change or another subsystem installation is needed. Event Success Fault At the end Patient missing 0,072 0,928 Found at home Mobile Stolen 0,3918375 0,6081625 No Result Wall broken 0,17415 0,82585 Found by police Affray 0,08505 0,91495 Found by police The Success Indicator Values mean that the preventive strength of the complex security system against the Initiating Event can be declared in every case and that shows the efficiency of the whole system.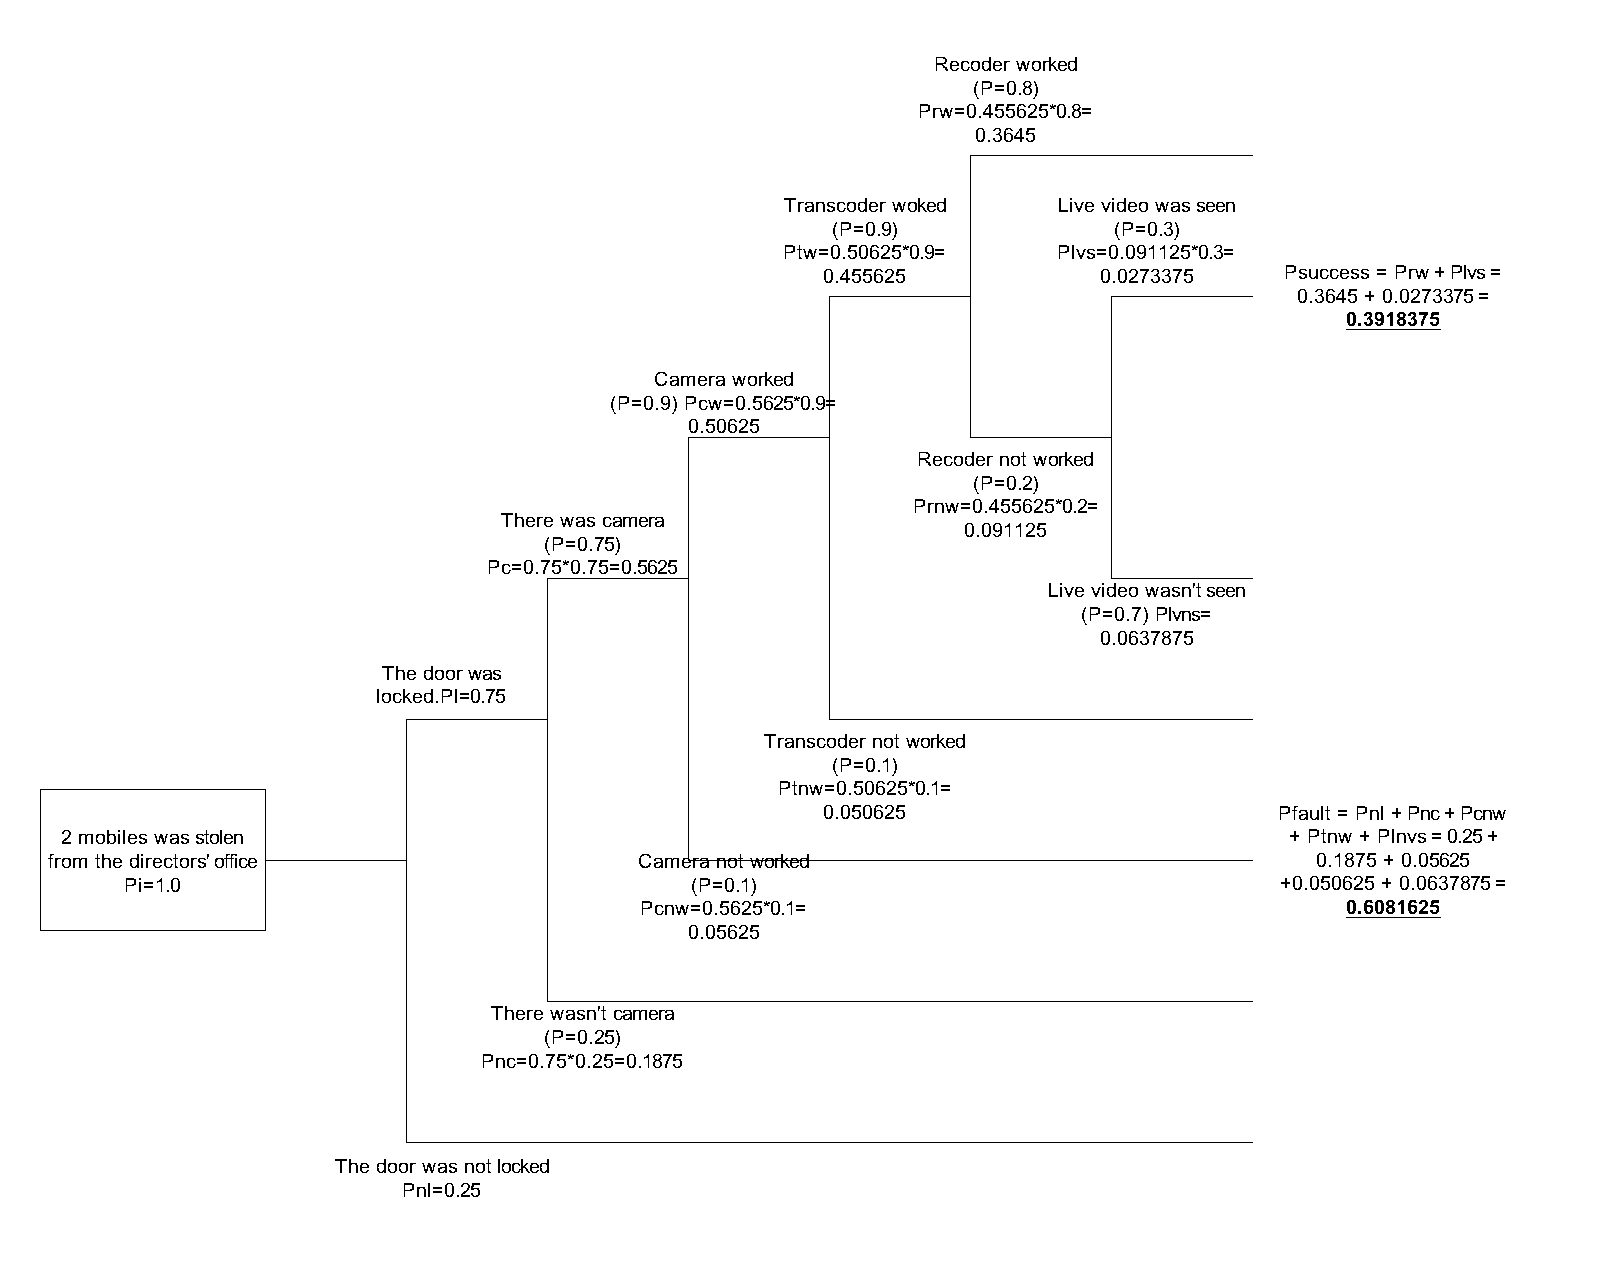

CONCLUSIONS
In this article we analyzed the changes of health centers and hospitals in smart cities. The future possibilities were collected and we tried to find a useful operating method for the facility management to keep the efficiency of the complex security system in an optimum position during these fast-changing times. First the main connections with their hazards were declared to find the key elements and the in- and outbound parameters of the security system, and generate an operating subsystem-based model of it. The pre-generated knowledge base and the Event Tree Analysis with well-defined event type templates can generate the efficiency values of the security system. With these numbers the facility management gets on-line information about the state of the system with the needs of improvement, and also the cost, which means that the management receives all important information for the proper budget planning for years and the ability to reduce the security risk of health care centers in smart cities. With a simple self-learning function, it will be possible to create an application that can provide exact suggestions on what the most vulnerable part of the protection is and what needs to be changed in the near future. This method can be adopted to another territory if the knowledge base is redefined, and the database structure is the same as in this case. The aforementioned theoretical, logical and mathematical methods can give an exact on-line information about the efficiency of the complex system.