INTRODUCTION
Today, the concept of the Internet of Things or IoT for short, is becoming increasingly widespread. This is not a coincidence, as numerous companies are now producing such devices wordwide. In a few words, IoT devices, besides two-way communication, can execute specific tasks. They store information in cloud-based systems, and these are available for the users at any time. Based on statistical data, IoT devices are used most in the following areas: manufacturing / industrial, transportation / mobility, energy, retail, cities, healthcare, supply chain, agriculture, buildings. In 2020 the number of IoT devices reached 50 billion1. This means almost 6 IoT devices per person worldwide. Besides the small gadgets surrounding us, there are groups of interrelated devices that should be treated as complex systems. These are smart houses, smart factories, smart grids – intelligent electricity distribution systems, and other extensive networking infrastructures2. The primary function of IoT devices is to provide solutions that save time, energy, and money, simplify life and make it more comfortable. The trend of their usage shows that the developers and manufacturers of these devices have successfully achieved this goal. One of the reasons for this explosive development of IoT is the rapid evolution of the two-way communication solutions needed. These devices can use the following wireless communication protocols: Bluetooth, NB-IoT, Wi-Fi, ZigBee, NFC, LoRa. These technologies are summarised in the following table. Table 1. IoT Communication Protocol Comparison3. The table above shows that the various communication solutions can bridge different distances, using different transmission speeds and frequency brands. Accordingly, it follows that these communication technologies supported the proliferation of IoT devices. In the following sections, the relationship between IoT devices and Wi-Fi will be discussed.
RELATIONSHIP BETWEEN WI-FI AND IOT DEVICES
Wi-Fi 4, 5 AND 6
With the introduction of the 802.11ax Wi-Fi standard, these technologies were renamed, including 3 Wi-Fi standards. In 2009 the 802.11n standard was published, supporting the 2.4 GHz and the 5 GHz solutions, with up to 600Mbps theoretical data transfer. This standard was renamed Wi-Fi 4. In 2013 the 802.11ac standard was published, which further improved both range and data transfer speed. This standard works in the 5 GHz frequency band, up to 3,5 GHz data transfer. This standard is called Wi-Fi 5. However, standardisation did not stop because wireless devices are responsible for a significant amount of internet traffic. The table above also shows that bandwidth-hungry IoT solutions are among those4. Therefore, in 2019 IEEE introduced the 801.11ax standard, a new and innovative version of wireless communication. This standard is called Wi-Fi 6. The following table shows the summary of the three technologies.
3.
Wi-Fi SURVEY
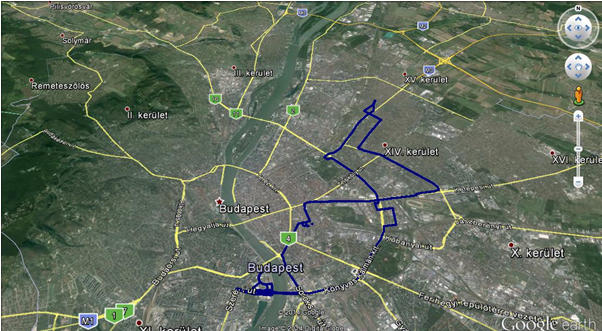
The penetration of wireless and IoT technologies is unstoppable. These areas, however, are developing hand in hand. Therefore, we would like to assess some of the impacts and relations of IoT systems from a series of wireless network surveys5. Since 2012, we have surveyed the wireless systems on a 29 km route in Budapest. This route was selected to represent all vital urban settings, such as high-rise apartment buildings, suburbs, industrial units, and offices6. The following figure shows the survey route:
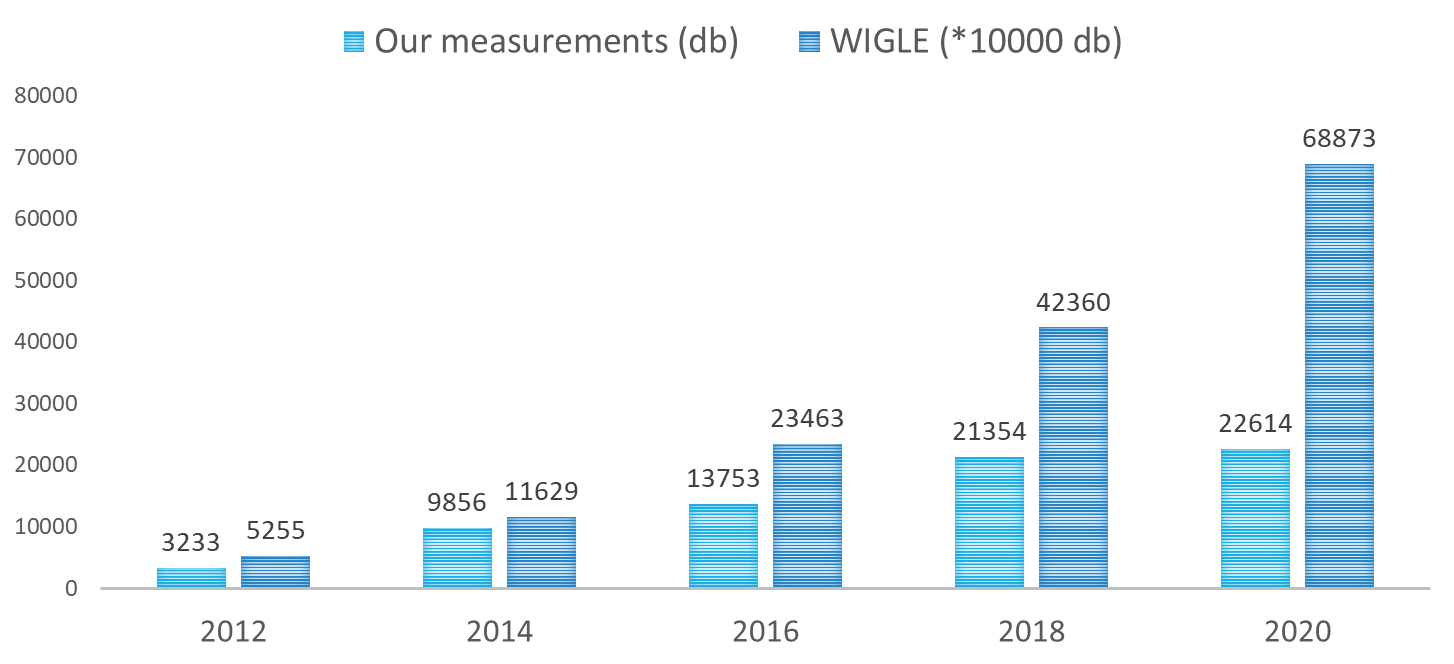
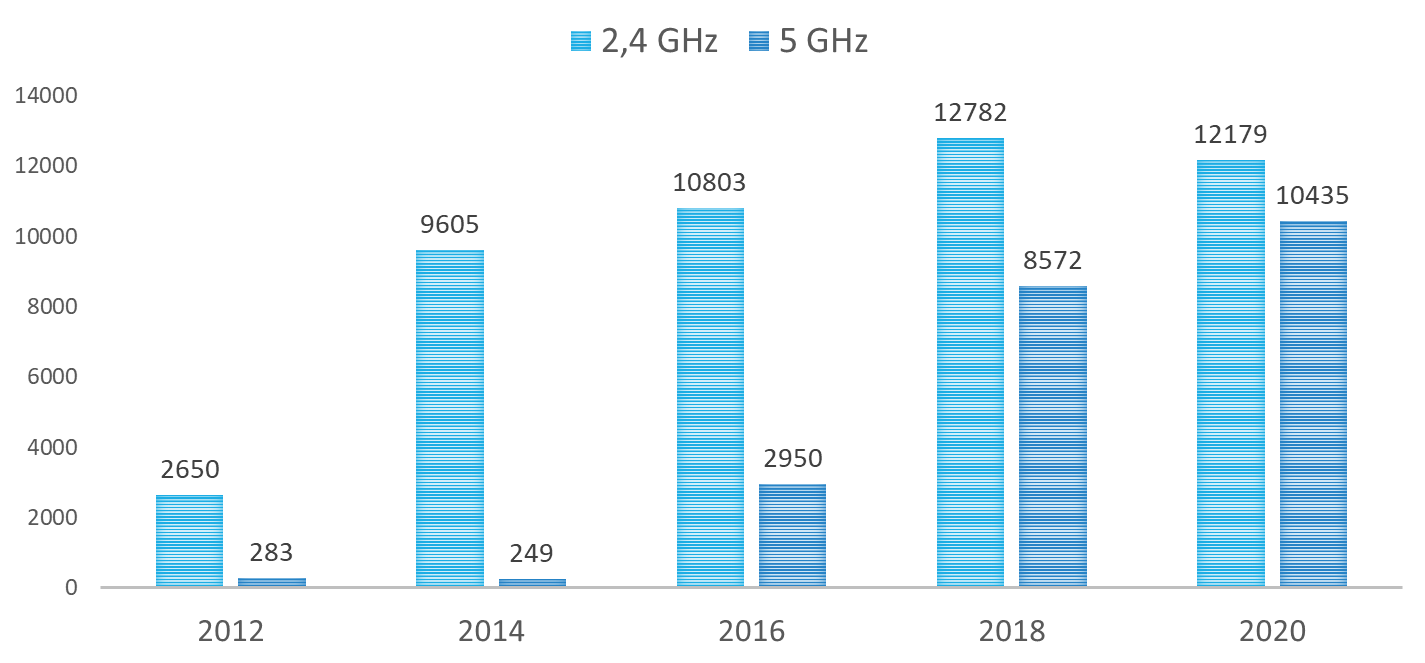
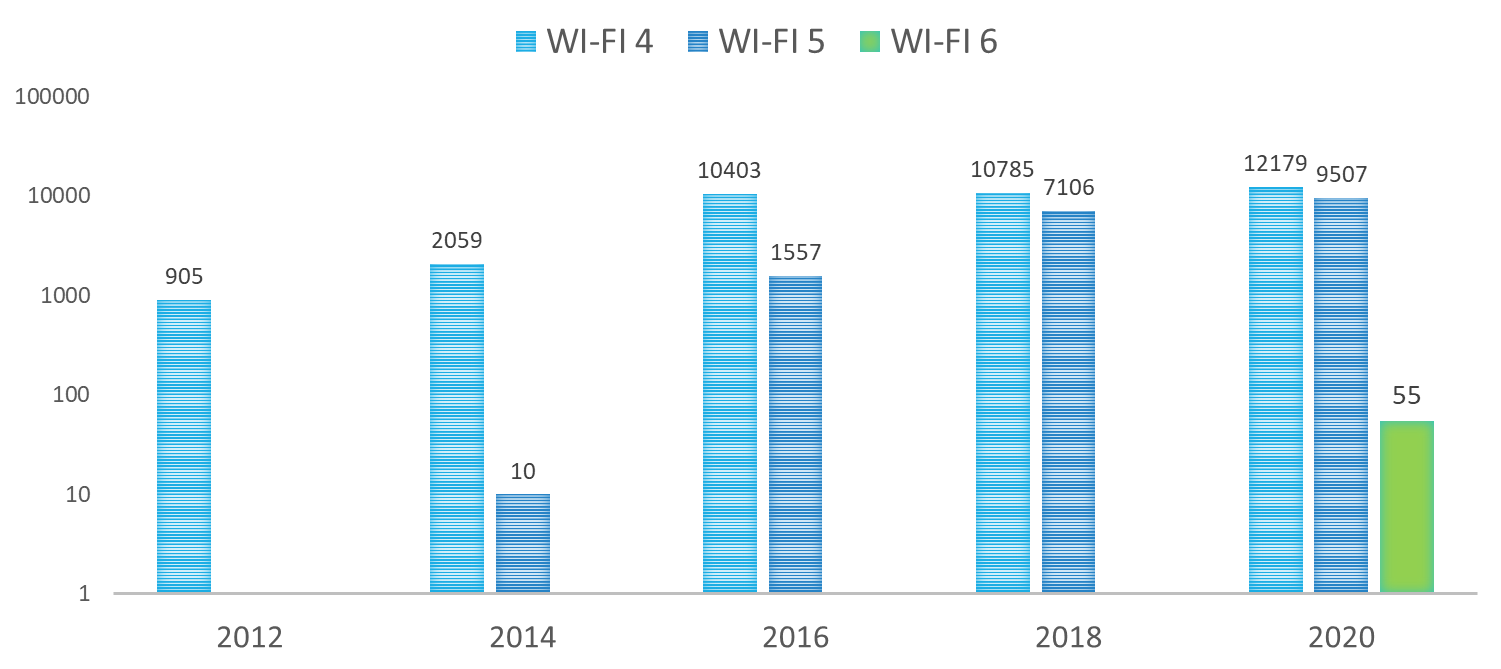
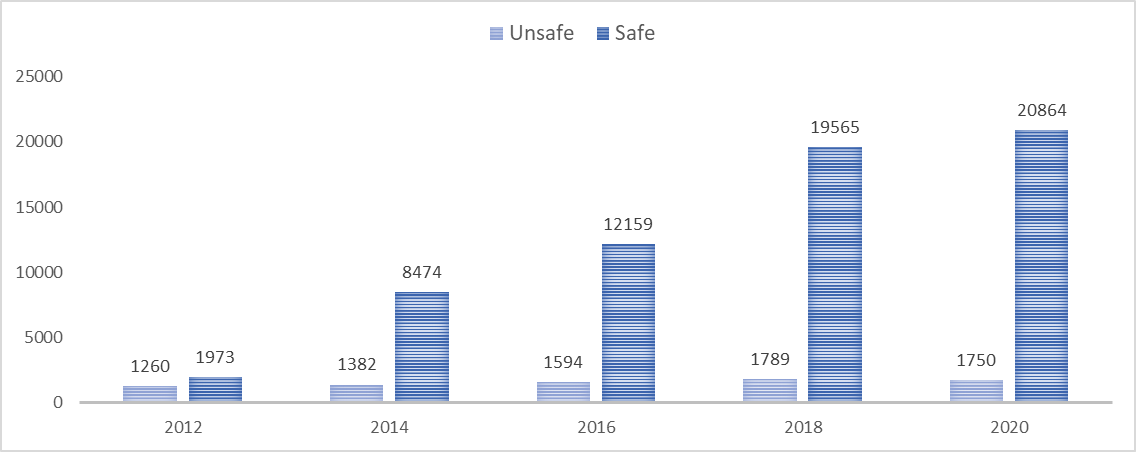
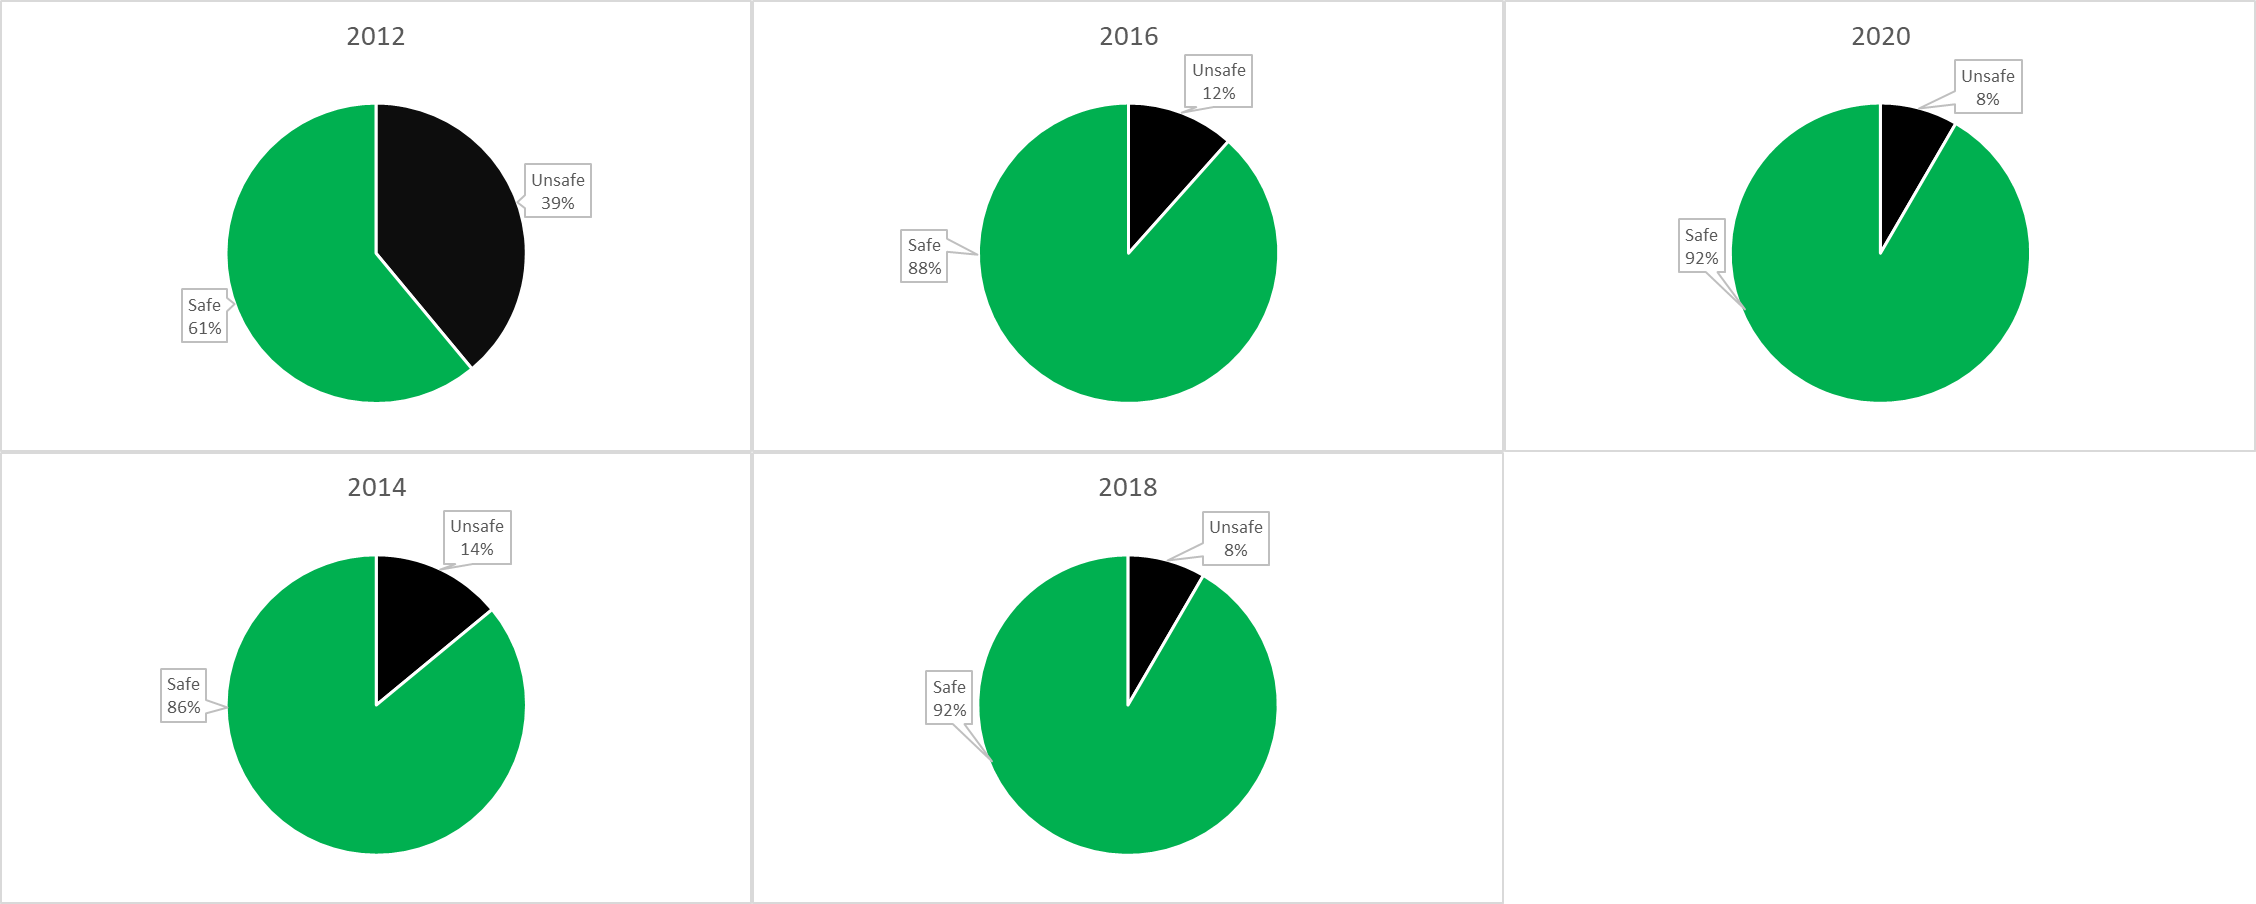
During measurement, up-to-date hardware and software tools were used every time. The hardware environment was a USB connected Wi-Fi device and a GPS receiver unit7. The software environment kept changing, depending on the actual operating system and hardware support. The collected data was compared to the Wireless Geographic Logging Engine (WIGLE) figures to get the overall picture and verify the measured numbers’ rationality. WIGLE is an open international database, which shares data about Wi-Fi devices. The following figure shows the measured and WIGLE data between 2012 and 2020. During the survey, not only the number of devices were recorded, but the following transmitted data was also collected8: SSID (Service Set Identifier), MAC Address, RSSI (Received signal strength indication), Channel, Channel Width, 802.11 standard,Security and authentication mechanisms, GPS coordinates. Based on these pieces of information, some trends and wireless network and IoT relations can be concluded. One of the possible benchmarks is the operational frequency based on the measured data. This is important because 2,4 GHz and 5GHz devices can operate with different transfer rates. 2,4 GHz has higher coverage but supports lower, several hundreds of Mbps transfer speed; meanwhile, 5 GHz supports several Gbps transfer speed at a lesser range. The following figure shows the volume trend of 2,4 GHz and 5GHz devices. The survey results indicate that the number of 5 GHz devices increased fivefold in the last four years. This tendency is demonstrated in the following figure, showing the changes in the number of Wi-Fi 4, Wi-Fi 5, and Wi-Fi 6 devices. The y-axis, on the logarithmic scale, shows the number of devices to highlight the low number of devices when a new technology is introduced to the market. By grouping the data from this perspective, the 2013 introduction and rising of Wi-Fi 5 devices are similar to the Wi-Fi 4 launching tendency, which started in 2012. In our view, Wi-Fi 6 has followed this tendency since its appearance in 2019. After one year of introducing Wi-Fi 5, only 10 of such devices were identified on the survey route. In 2020, one year after introducing Wi-Fi 6, 55 of such technology devices were found. Projecting this trend to IoT devices, it can be concluded that at the increase of the Wi-Fi 6 devices, the number of IoT devices per person can reach 9-10 in the following years. The survey data also supports defining the number of secure and insecure networks for the overall test population. The following figure shows this trend: Results show that the number of secured-closed-networks has been continually rising since 2012. However, there is another point to remember: in 2020, the number of not secured networks was still 1750. The following figure shows in percentages the changes in the number of secure and insecure networks. The above pie charts clearly describe the trend of secure/insecure network proportions from 2012. This figure also shows that in 2020 insecure network had a rate of 8 % in the overall test population. We believe that inadequate configuration and negligence is behind this poor security9. Projecting this tendency to the IoT devices, the security of 8 % (4 billion) of the total number of 50 billion devices is managed poorly and can serve as a potential attack point.OPTIONS TO INCREASE PROTECTION
The spread of insecure Wi-Fi networks and IoT devices increases the potential for attackers to find endpoints, which can be used to launch an attack against critical infrastructures. Based on the technology trends, we can estimate a significant increase in weaponised gadgets in the cyberspace. Mitigation strategies should focus on the end-users, internet service providers (ISPs) and enterprises that employ Wi-Fi networks and IoT devices. As for end-user protection, there are two main options to nudge people towards a more security-conscious attitude. Firstly, negligence needs to be addressed. Users need to be more aware of the consequences of poorly secured networks and IoT devices by increasing the liability of misconfigured or unprotected devices. However, enforcing legal liability is difficult, especially when most of the users are not technically trained. There is another option to increase security awareness for IT products by implementing a cybersecurity labelling scheme (CLS). The Cybersecurity Agency of Singapore launched a labelling scheme for smart devices, which identifies four tiers of security assessment10:
• tier 1: Security Baseline Requirements,
• tier 2: Lifecycle Requirements,
• tier 3: Software Binary Analysis,
• tier 4: Penetration Testing.
The tier sequence corresponds to the increasing level of assurance and improved cyber resilience. This model informs the public about the security resistance of devices and increases manufacturers’ competition to develop more secure appliances.
CONCLUSIONS
The evolution of smart devices increased network utilisation in both households and enterprises. We have been collecting data about Wi-Fi systems in Budapest since 2012, by scanning devices connected to them, in order to be able to assess the used technologies. In this article, we presented some utilisation trends. Based on the strongly coupled development of Wi-Fi networks and IoT devices, we showed how Wi-Fi 4, Wi-Fi 5 and Wi-Fi 6 transition happens, and what are the tendencies in change of the secure/insecure proportions of these devices. We pointed out that future IoT consumption will increase the number of misconfigured or poorly configured devices, which will increase the potential to use these against critical infrastructure. We also pointed out that some action was needed to raise the security awareness of end-users and manufacturers to reduce operational negligence.

