0 Preface
This article is dedicated to Prof Dr Sc Miljenko Lapaine on the occasion of his 70th birthday in appreciation of his outstanding merits as a cartographer and expert in geodesy and map projections as well as of being a wonderful colleague at the level of International Cartographic Association (ICA) commission chairs. For his scientific merits and his input to ICA he has been awarded the ICA Honorary Fellowship in 2019. For me, he stands also for the long line of Croatian cartographers and geographers, with whom I have cooperated from the early times of my professional career in the 1980s and whom I owe so much – starting from Zlatko Pepeonik, Petrica Novosel-Žic, Hrvoje Turk and Nikola Stražičić up to Borna Fuerst-Bjeliš, Ivo Nejasmić, Damir Magaš or Mladen Klemenčić. I will feel happy and proud to continue this relation for many years to come. I also feel the need to commemorate here the late Mirjanka Lechthaler, almost a symbol of close Croatian-Austrian relations, with whom I had the great pleasure to cooperate. She started her academic career in Zagreb with Nedjeljko Frančula and Miljenko Lapaine, moved in 1985 to Vienna and functioned there as an assistant professor at the University of Technology up to 2011 before she passed away in 2016.
1 Introduction
It should be said right at the beginning that national and ethnic groups as the features represented by ethnic maps are not facts that can be determined solely on the basis of objective characteristics. Personal affiliation to a specific nation or ethnic group is often based on objectively ascertainable characteristics such as language or religion. But family tradition, models and ideas conveyed through upbringing, prestige or even opportunity thinking also play a role. In principle, it is therefore a matter of a personal decision, a subjective assignment after weighing up various points of view. It may well contradict objective characteristics and turn out differently when political and social circumstances change (seeBrunnbauer 2002,Gellner 1983,Heller 2011,Mitchell 2005,Schermerhorn 1970,Symmons-Symonolewicz 1985,White 2000,2004).
A striking example of subjective and changing affiliations are the Roma, of whom only a small proportion identify themselves as such in official censuses, but much more frequently count themselves among the respective majority population. But even German-speaking Austrians still saw themselves as Germans throughout the interwar period. It was not until after the Second World War that the concept of an Austrian nation emerged, to which most Austrians today affiliate themselves (seePelinka 1990,Thaler 2001). Before the Second World War, Christian Slavs in what is now North Macedonia still felt predominantly to be Serbs or Bulgarians and had just some kind of a regional identity, before they found their own national identity under the auspices of a federally organized Yugoslavia that wanted to give the majority groups of its constituent republics the status of nations (seeJordan 1998).
However, despite their subjectivity and changeability, national/ethnic affiliations are of great importance and are therefore often a topic of cartographic representation. As reasons for this the following could be mentioned:
Nations in the sense of communities sharing and bound together by common cultural characteristics like language, religion or history[1] and ethnic groups in the sense of subunits of nations with cultural specifics are political actors and represent their group-specific interests.
National/ethnic awareness promotes the cohesion of a society and can be used politically to increase the sense of community and motivation, to release additional energies (even to the extreme, to violent conflict). Appeals to national consciousness are particularly common in crisis and conflict situations, which was also evident in the process of Yugoslavia’s dissolution, in the transformation crisis in post-Communist Europe and is again evident in the current war on Ukraine.
National/ethnic consciousness can be an important factor in personal and group identity – especially after the collapse of Communism, which has left an identity vacuum for some, and under the influence of cultural globalization, which often prompts reflection on one’s own identity.
It is therefore not surprising that the production of ethnic maps has increased significantly after the fall of Communism, not only but especially in and about (see, e.g.,Magocsi 2022) post-Communist Europe. Each of the many new national and thematic atlases of the transformation countries contains maps on this topic. However, national/ethnic groups are often understood there as communities of descent and not of subjective affiliation. The Geographical Atlas of Slovenia (Fridl et al. 1998), e.g., the most comprehensive thematic mapwork of and on Slovenia since its independence, contains a map of the distribution of Slovenes across the world (seeFig. 1), which also includes the descendants of those who emigrated in the 19th century as members of the Slovene nation, although they may in the meantime have adopted the national consciousness of their destination.
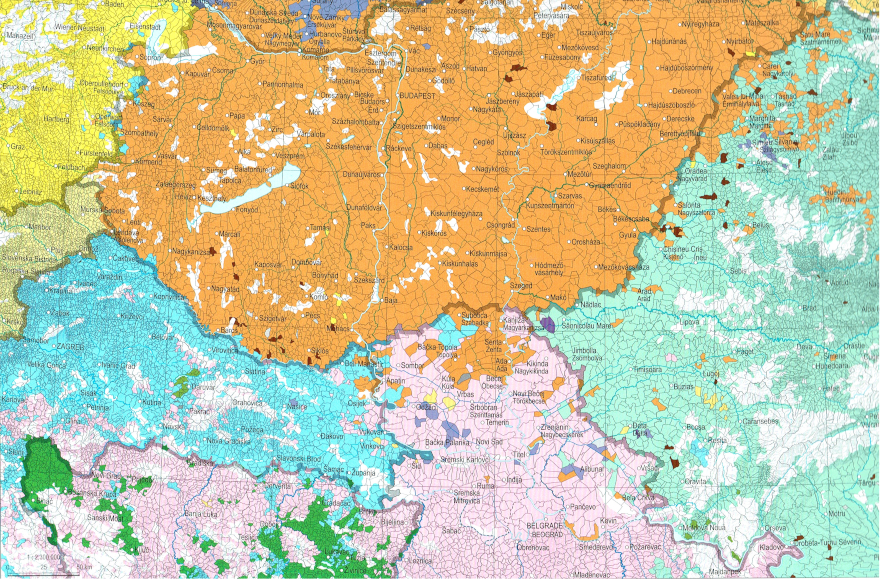
Hungarian cartography is also very rich in this regard, which, in the person of Károly Kocsis in particular (Kocsis 1994,2005a,2005b,Kocsis and Bognár 2003,Kocsis and Kicošev 2004), has endeavored to record the neighboring countries of Hungary with their partly large Hungarian minorities (seeFig. 2). But also the recently published Volume 3 ("Society") of the new Hungarian national atlas (Fig. 3) puts a strong emphasis on national/ethnic consciousness (Kocsis et al. 2021).
Also the author of this article has after 1989/90 drafted ethnic maps on demand of various school atlases and handbooks on Southeast Europe and found it necessary and informative to include several others into the Atlas of Eastern and Southeastern Europe, edited by himself (seeJordan 1994,1995a,1995b,1999b,2000,2001,2007a;Jordan and Kocsis et al. 2006,Jordan and Schappelwein 1993).
It is not the aim of this article to trace the development of ethnocartographic methodology, but to compare the principal methods of this cartographic subdiscipline highlighting their advantages and disadvantages and focusing on their ability of adequately reflecting various spatial structures of ethnicity mainly based on the author’s own experiences with drafting ethnic maps of Europe with a focus on its eastern parts.
Fig. 1. Slovenes in the world, map in the Geographical Atlas of Slovenia (Source:Fridl et al. 1998, p. 173) / Slika 1. Slovenci u svijetu, karta u Geografskom atlasu Slovenije (Izvor: Fridl i sur. 1998, str. 173)
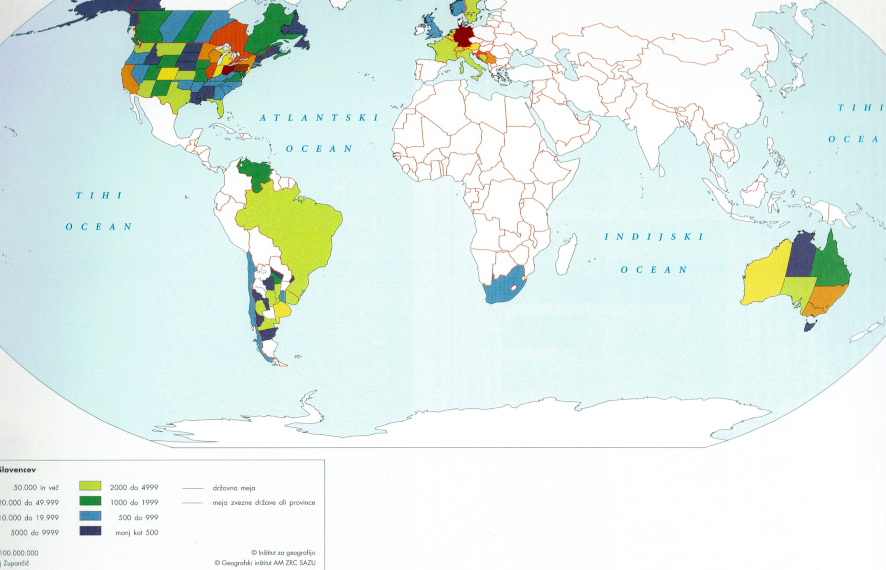
Fig. 2. Ethnic consciousness in eastern Slavonia and Baranja 2001 (Source:Kocsis 2003). Pale blue: Croats; pink: Serbs; red: Hungarians; violet: Czechs; yellow: Slovaks; brown: Rusins, Ukrainians; grey: others / Slika 2. Etnička svijest u istočnoj Slavoniji i Baranji 2001. (Izvor:Kocsis 2003). Blijedoplava: Hrvati; roza: Srbi; crvena: Mađari; ljubičasta: Česi; žuta: Slovaci; smeđa: Rusini, Ukrajinci; siva: ostali
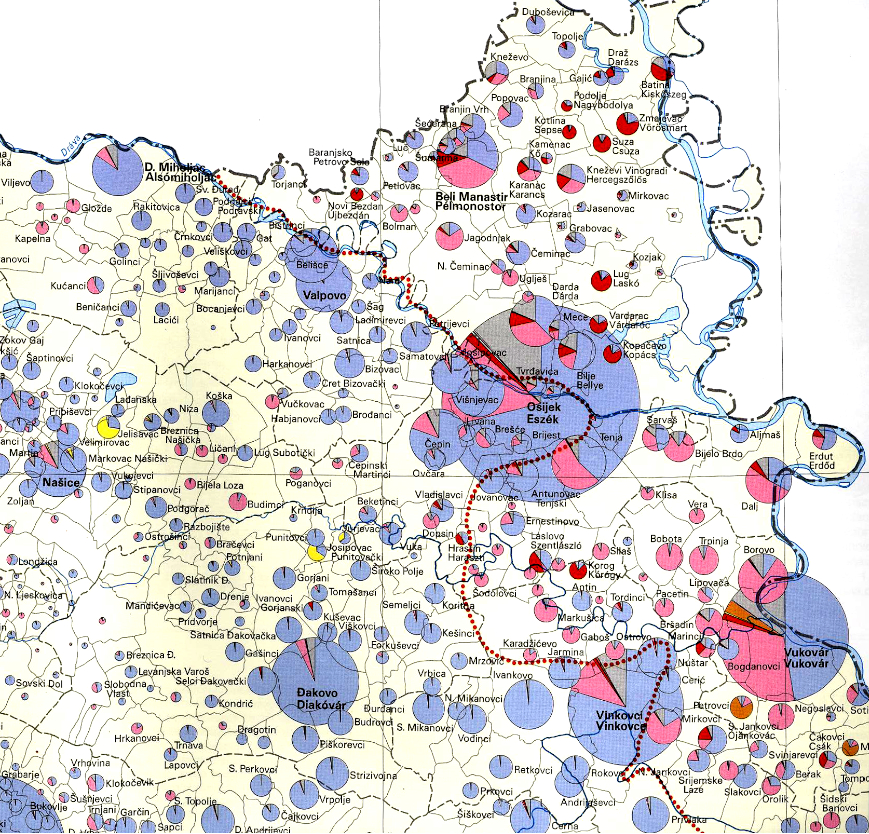
Fig. 3. Section of the "Ethnic Map of the Carpathian Basin (2011)" in the National Atlas of Hungary, Volume 3: Society (Source:Kocsis et al. 2021, p. 73). Orange: Hungarians; dark blue: Slovaks; ocher: Ukrainians, Rusins; green: Romanians; pink: Serbs; light blue: Croats, Bunjevci, Sokci, Crashovanians; pale brown: Slovenes; violet: Bulgarians; dark brown: Roma; yellow: Germans, German-speaking Austrians. / Slika 3. Dio "Etničke karte Karpatskog bazena" (2011) u Nacionalnom atlasu Mađarske, Svezak 3: Društvo (Izvor: Kocsis i sur. 2021, str. 73). Narančasta: Mađari; tamnoplava: Slovaci; oker: Ukrajinci, Rusini; zelena: Rumunji; roza: Srbi; svijetloplava: Hrvati, Bunjevci, Šokci, Krašovani; blijedosmeđa: Slovenci; ljubičasta: Bugari; tamnosmeđa: Romi; žuta: Nijemci, Austrijanci koji govore njemački.
2 Filters Between Feature and Map
An ethnic map shows the national/ethnic awareness, i.e., the subjective national/ethnic affiliation of a person (and maybe only secretly) after triple filtering.
The first filter is a person's willingness to declare national/ethnic awareness or consciousness in a census or similar official inquiries openly and honestly. This willingness can be low under repressive political circumstances or when it comes to an affiliation to groups that are not respected or are discriminated against. It can also be affected by ethnic polarization, urban-rural dichotomy, the level of education, age and the frequent phenomenon that ethnic/national consciousness is not as developed among members of the majority than of the minority, because for the latter ethnic identity is much more of a daily challenge.
The second filter is the method of counting and data analysis chosen by the authorities. In the case of counting, it can vary between the options of choosing among predefined affiliation categories and the free specification of any affiliation, between written and oral questioning.
It was, e.g., possible for the first time in censuses in Czechia after its separation from Slovakia in 1993 to specify one’s own affiliation beyond the given categories. As a result, many referred to themselves as Moravians or Silesians and not as Czechs. The oral questioning by an official census organ, which is customary in Romania, for example, can lead to those who are undecided, unsure and vacillating, being guided towards an affiliation desired or "politically correct" by the census organ.
When evaluating and documenting the data, the authority can leave the categories used in the survey unchanged or combine them into broader categories. If the latter is the case, some national/ethnic groups will no longer appear in the final result, while others will increase accordingly. Practices like these are known from Romania, where people who identified themselves as Megleno-Romanians or as Aromunians, according to their image of self at least ethnic groups, but from the official Romanian perspective parts of the Romanian nation, appear in the official documentation under "Romanians".
The third filter is the methodology of cartographic representation. In principle, maps are able to reproduce data objectively and neutrally (which, however, had to pass through the first two filters and could have been distorted by them). However, maps are always abstractions of reality necessarily reduced in terms of content. They must generalize according to their scale, and as a result often fail to capture very small units and subtle differences. This can work to the detriment of some national/ethnic groups.
However, maps also offer a wide range of possibilities for intentional (manipulative) or unintentional (caused by improper or careless application of the methodology) distortion of the data basis used. Such distortions are often difficult for the map reader to detect. They are even more dangerous, since maps, in contrast to texts, are often considered to "reflect reality" and to be more reliable. It should be sufficient to hint at some relevant works in this context:Demeter et al. (2020),Monmonier (2018),Svatek (2018),Vytautas (2011).
3 Strengths and Weaknesses of the Basic Cartographic Methods Applicable to Ethnic Maps
The main methods of mapping national/ethnic consciousness are the area method, the dot spread method and the diagram method. They can be combined and modified in many ways and are applicable to language maps in the same way (see, e.g.,Breu 1989,Kamusella 2021).
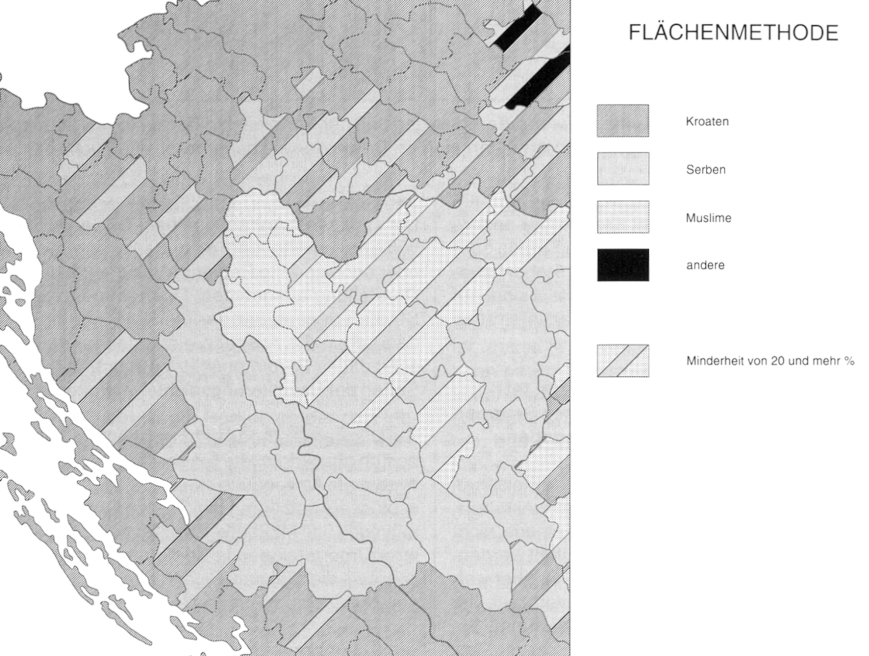
With the area method (Fig. 4), area symbols (colors, patterns) representing national/ethnic groups refer to statistically, administratively, or topographically defined spatial units.
With the dot spread method (Fig. 7), dot symbols of the same or different sizes, whose shape or color stands for national/ethnic groups, are placed as accurately as possible in the topographic map base.
With the diagram method (Fig. 8), circles or differently shaped diagram figures (e.g., squares, cubes) of different sizes, which are divided by colors or patterns according to the proportions of national/ethnic groups in the total population, are located at the center or focal point of a statistical and/or administratively defined spatial unit.
3.1 Area method
The strength of the area method (seeFig. 4) is its easy legibility and striking effect, especially when colors are used as symbols. It is therefore also the most frequently used method. However, it conveys in fact only an impression over which area a national/ethnic group is spread or in which area it has the majority. It mainly provides information about which national/ethnic group is to expect when going to a certain area, while it does not provide information on the quantitative distribution of national/ethnic groups. Densely populated urban areas are not represented differently from high mountain regions or swamp areas. This favors national/ethnic groups forming majorities in rural or sparsely populated areas. They then give the color to a relatively large area, although they are small in number, and groups of the same size do not even appear in cities on the map because they form only small minorities there. In fact, the area method is sometimes deliberately used for this purpose.
Fig. 4. Area method applied to central parts of Croatia and western parts of Bosnia-Hercegovina based on the population census of 1991 (Author’s own draft) / Slika 4. Metoda površina primijenjena na središnje dijelove Hrvatske i zapadne dijelove Bosne i Hercegovine na temelju popisa stanovništva 1991. (vlastiti crtež autora)
The major disadvantage of the area method, namely not capturing the absolute value distribution of ethnic groups, can be mitigated by (1) excluding sparsely populated or unpopulated regions from the thematic representation (seeFig. 5), (2) additionally using diagram figures (e.g., circles) for larger cities (seeFig. 5), (3) supplementing them with diagram figures or dots for minorities (seeFig. 6), or (4) incorporating population density into the map information by using different thematic color intensities for different levels of population density.
However, this always only mitigates the fundamental, conceptual shortcoming of this method, not compensates for it. It consists in the fact that the area method does not relate the population characteristic of national/ethnic affiliation to the relevant statistical reference unit, i.e., the overall population number, but to the (land surface) area, which is actually only the scene of this relationship. Strictly speaking, the area method is therefore not scientifically justifiable. However, since the other two methods lose their advantages as the map scale decreases, while the area method retains its strength of good legibility, it is widely used on smaller-scale maps (such as those in school atlases).
Another problem with the area method is that it gives the impression of sharp boundaries between national/ethnic groups and of a fixed and exclusive relationship between national/ethnic groups and territory. It is thus able to support the claim of some national/ethnic groups to an "ethnic territory" (which actually "belongs" to this group). At a time when – at least outside the Global South – closed rural societies hardly exist anymore and national/ethnic groups present themselves more often in the form of spatially interpenetrating networks than closed settlement communities because of migration, employment and education, this also seems unrealistic.
Fig. 5. The area method applied to Southeast Europe (Scale 1:5,000,000), its shortcomings mitigated by excluding sparsely populated or unpopulated regions from thematic representation and additionally using diagram figures for larger cities (Source:Jordan 1994) / Slika 5. Metoda površina primijenjena na jugoistočnu Europu (mjerilo 1:5 000 000), njezini su nedostatci ublaženi isključivanjem rijetko naseljenih ili nenaseljenih regija iz tematskog prikaza i dodatnom upotrebom dijagramskih slika za veće gradove (Izvor:Jordan 1994)
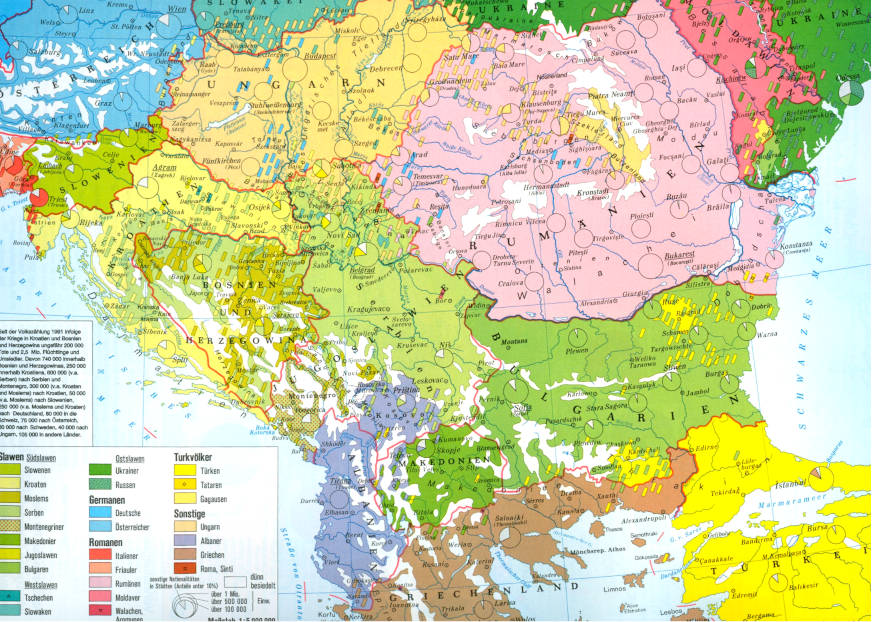
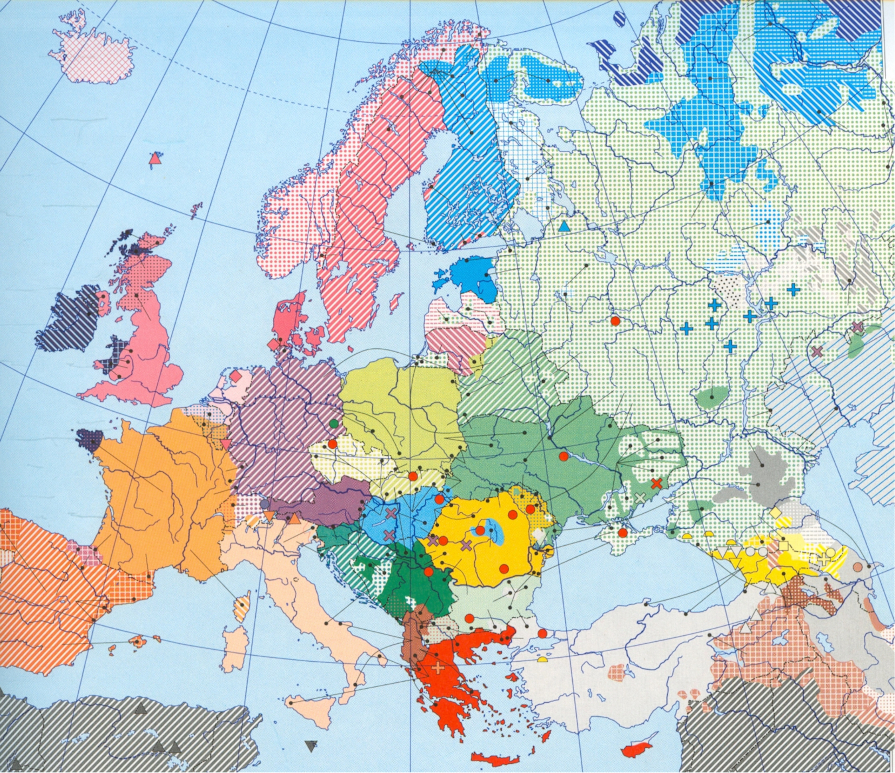
Fig. 6. Area method applied to Europe (Scale 1:20,000,000), its shortcomings mitigated by supplementing area colors with dots for minorities (Source:Jordan 1995b) / Slika 6. Metoda površina primijenjena na Europu (mjerilo 1:20 000 000), njezini su nedostatci ublaženi dodavanjem boja s točkama za manjine (Izvor:Jordan 1995b)
3.2 Dot spread method
The dot spread method (seeFig. 7) can capture the absolute number of a national/ethnic group and to topographically accurately reflect the spatial distribution of that group.
When capturing the absolute number, its additional strength is the ability to represent absolute values in an easily countable manner by means of symbols of the same size or a few size steps. However, the size gradation inherent in it only enables graduated (round) values to be read off. A sliding, non-stepped symbolization would eliminate this disadvantage, but would deprive the method of its great advantage, that it is easy to count.
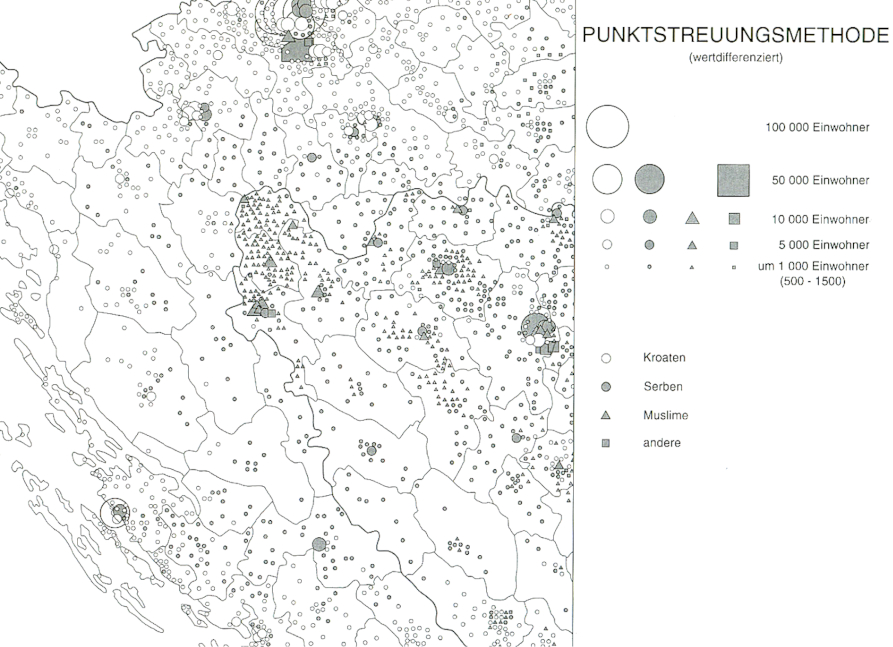
Fig. 7. Dot spread method representing graduated values applied to central parts of Croatia and western parts of Bosnia-Hercegovina based on the population census of 1991 (Author’s own draft) / Slika 7. Metoda točaka prikazuje graduirane vrijednosti primijenjene na središnje dijelove Hrvatske i zapadne dijelove Bosne i Hercegovine na temelju popisa stanovništva 1991. (vlastiti crtež autora)
The topographically accurate representation of the spatial distribution presupposes that data are available in the appropriate spatial resolution. Thus, the spatial distribution of ethnic groups within a municipality can only be shown if data are available at least by populated places. The lack of statistical data corresponding to the map scale can eventually be compensated by very good local knowledge. Not exceptionally, however, dot spread maps simulate an accuracy that is not justified by the level of detail of the data or by local knowledge.
A disadvantage of the dot spread method is that although it can represent absolute values, the size relationship between different groups is only unclearly conveyed. By counting the points within a certain area, the reader can get an idea of the relative sizes of different groups in this area. But this is cumbersome and never accurate because of the rounded values of the dots.
Another disadvantage results from the small visual body of the dotted symbols. The small body only makes it possible to keep up to five colors clearly distinguishable. The additional variation of the form of the symbol (e.g., circle, triangle, square) can certainly allow additional distinctions, but this makes the map more difficult to read. In any case, this places narrow limits on the ability to represent a larger number of national/ethnic groups.
The dot spread method is therefore primarily used for the large-scale representation of smaller areas, but not, for example, for the small-scale reflection of multi-ethnic situations in a larger region of Europe or on maps of an entire continent.
As the scale gets smaller, the great advantage of this method, namely being able to represent the spatial distribution of national/ethnic groups topographically, is lost anyway. If a map scale can no longer show the spatial distribution of mountains and valleys, of densely and sparsely populated areas, then the dot spread method has also lost its justification.
In contrast to the area method, however, it is scientifically justifiable because it relates the population characteristic "national/ethnic classification" to the overall population and thus allows population density to be clearly identified in addition to the distribution of national/ethnic groups. National/ethnic groups in sparsely populated areas are given low weight on the map, those in densely populated areas are given high weight. The method also avoids identifying "ethnic territories" because its dots stand for a specific value unit of the resident population and are missing where nobody lives. Mountains and swamps remain without symbols and are not claimed nationally/ethnically.
3.3 Diagram method
The diagram method (seeFig. 8) is the only that combines absolute and relative value representation. From the size of a diagram figure (e.g., a circle) and its division into (e.g., colored) sectors, both the absolute number of a national/ethnic group and its share in the total population of a populated place or an administrative unit can be read off precisely and at a glance. If the diagram figure is also dimensioned in such a way that its area is proportional to the number of population it represents, then a map using the diagram method also gives a visually reliable impression of the actual distribution of the population and of the national/ethnic groups. In addition, with the help of the legend it is possible to determine the feature value precisely, provided a sliding symbol key has been selected for the diagrams. In the case of interactive electronic maps, the feature value can be displayed numerically even with a tiered legend by clicking in the corresponding sector.
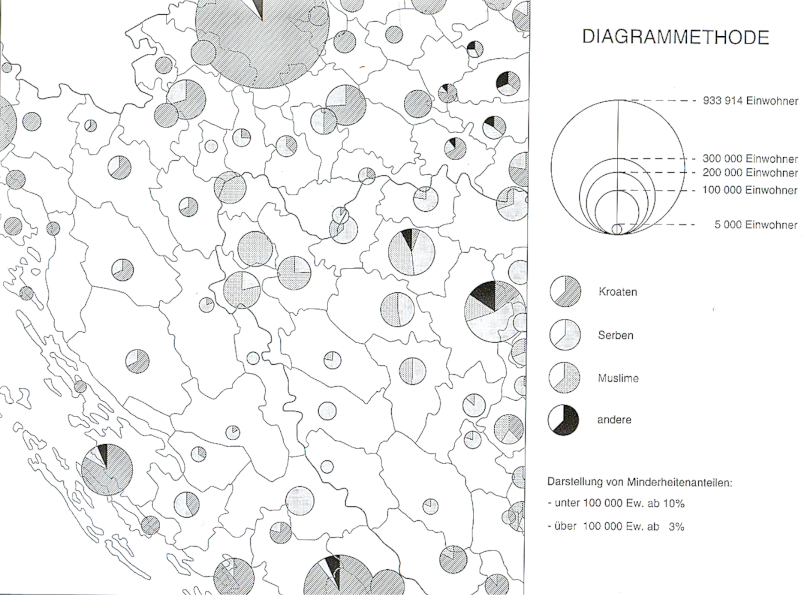
Fig. 8. Diagram method applied to central parts of Croatia and western parts of Bosnia-Hercegovina based on the population census of 1991 (Author’s own draft) / Slika 8. Metoda dijagrama primijenjena na središnje dijelove Hrvatske i zapadne dijelove Bosne i Hercegovine na temelju popisa stanovništva 1991. (vlastiti crtež autora)
The sectors of the diagram figures can usually be kept so large that many (up to 100) national/ethnic groups can be distinguished by means of colors or patterns. That is enough to show larger and nationally/ethnically very diverse parts of the world. The method can be applied both to large scales with great spatial detail and to the smallest scales.
However, the subdivision of the diagram figures into sectors sets a lower limit to what can be represented. Sectors that are too narrow can no longer be clearly distinguished by colors or patterns, especially in the case of smaller diagram figures. Depending on the value range within the thematically represented area, minorities that make up less than 3 to 5% of the total population of a spatial reference unit can hardly be represented. Their share must be distributed proportionally to the groups that can be represented. This tends to favor the respective majorities. To keep this threshold as low as possible, it makes sense to label national/ethnic groups (redundantly) with numbers in addition to colors or patterns, at least where they form small minorities. An additional way to redundantly increase reading security is to arrange the circle sectors or bars of the individual national/ethnic groups in the same order in each circle or square (seeFig. 9).
Fig. 9. Diagram method applied to Albania and its neighborhood with redundant numbers and a constant sequence of circle sectors (Source:Jordan, Kocsis et al. 2006). Brownish red (1): Albanians; grey (15): Bosniaks; grey with dot pattern (16): Muslims; light green (17): Serbs; light green with dot pattern (18): Montenegrins; dark green (19): Macedonians; dark violet (33): Vlachs, Aromunians; brown (36): Roma, Sinti; yellow (38): Turks; grey (41): others. / Slika 9. Metoda dijagrama primijenjena na Albaniju i njezino susjedstvo s redundantnim brojevima i konstantnim nizom kružnih sektora (Izvor: Jordan, Kocsis i sur. 2006). Smeđe crvena (1): Albanci; siva (15): Bošnjaci; siva s točkastim uzorkom (16): Muslimani; svijetlozelena (17): Srbi; svijetlozelena s točkastim uzorkom (18): Crnogorci; tamnozelena (19): Makedonci; tamnoljubičasta (33): Vlasi, Aromuni; smeđa (36): Romi, Sinti; žuta (38): Turci; siva (41): ostali.
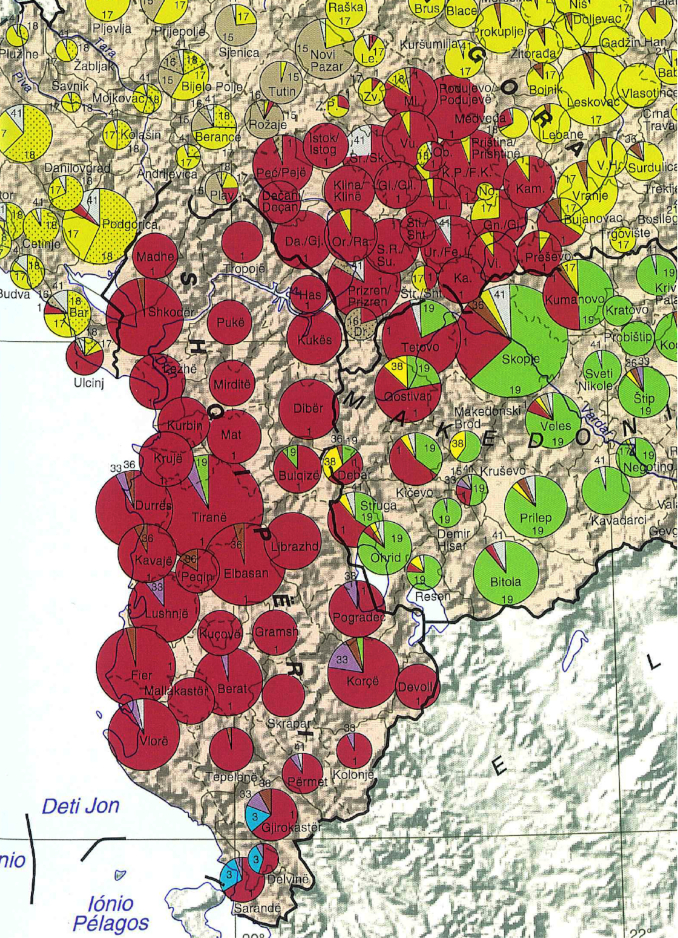
Setting the threshold makes manipulation possible. It can (as with the other two methods) be set unnecessarily high to make minorities disappear and make larger national/ethnic groups appear even more impressive (by adding the minority sector or bar to the majority sector or bar). An approach whereby all minorities that do not meet the threshold are assigned to one or several larger groups, even if their cumulative proportion of the total population exceeds the threshold, is both manipulative and easy to be concealed. A correct representation would have to show the cumulative share of all minorities as category "Other".
In addition to this disadvantage of a lower threshold value, which the diagram method shares with the area and dot spread method, the diagram method also has the specific disadvantage of not showing the spatial distribution of national/ethnic groups in more detail. The diagram figure refers to the population of a statistical and/or administrative unit and is usually placed with its center in the latter’s geometric or population center. It neither traces (like the dot spread method) the exact spatial distribution nor (like the area method) the area of occurrence of a national/ethnic group but leaves it up to the reader to interpret the information in terms of area and location. Spatial distribution and area of distribution of a national/ethnic group are thus often not clear.
This is also the basis of the widespread judgment that a map using the diagram method is "complicated" and "difficult to read". However, it also avoids any appearance of "ethnic territoriality".
4 Use of Colors
The use of colors in ethnic (and also language) maps offers ample opportunities for manipulation. However, there are only a few methods that can clearly be described as violations of cartographic objectivity.
One of these is using the most striking color to identify one's own national/ethnic group, unless it is a small minority (seeFig. 10). The violation rests in the fact that one's own group (the group of the author or publisher of the map) is a large one among those represented in the relevant area section of the map and "color-kills" smaller groups if it is marked in a particularly distinctive and bright color. If, on the other hand, it is a small minority, then a flashy color is very appropriate.
A second method of manipulation by means of color consists in "collecting" other national/ethnic groups by giving them a color that is hardly distinguishable from one's own group (seeFig. 10), or by simply making them recognizable as different only by means of an overprint pattern or labeling.
Other violations include "hiding" minorities by assigning colors no more conspicuous than those used for majority groups or using dark and "dirty" colors for national/ethnic groups intended to appear unsympathetic or threatening to the reader.
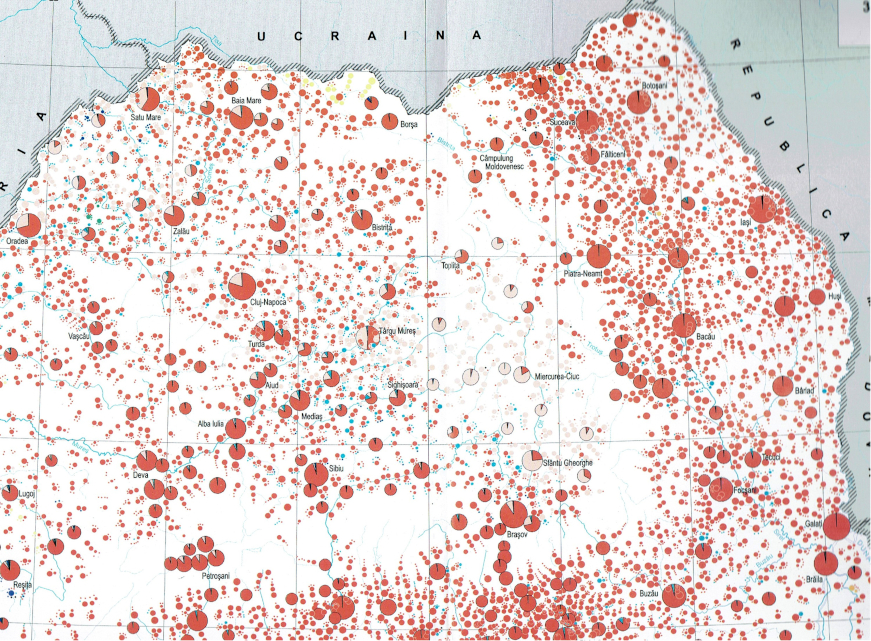
Fig. 10. Section of the map "Nationality Structure of the Population (2002)" representing Hungarians in the center of the section by a paler shade of the same color as Romanians (Source:Academia Română 2007, p. 199). Red: Romanians; pink: Hungarians; blue: Roma; light green: Ukrainians, Ruthenes; dark blue: Germans; violet: Serbs, Croats; dark green: Slovaks, Czechs; brown: Bulgarians; black: others. / Slika 10. Dio karte "Nacionalna struktura stanovništva (2002)" koji prikazuje Mađare blijedom nijansom iste boje kao i Rumunje (Izvor: Academia Română 2007., str. 199). Crveno: Rumunji; ružičasta: Mađari; plava: Romi; svijetlozelena: Ukrajinci, Rusini; tamnoplava: Nijemci; ljubičasta: Srbi, Hrvati; tamnozelena: Slovaci, Česi; smeđa: Bugari; crno: ostali.
5 Conclusion
Cartographic methodology allows ethnic maps to be objective. However, ethnic maps represent features due to subjective assessment and that go through a two-fold filter before they are implemented on the map (willingness of the officially interviewed person to provide frank information, methodology of official data collection and data analysis). The data available to the cartographer may therefore be distorted already. It is also in the nature of a map to abstract and generalize. This can work to the detriment of national/ethnic minorities.
Of the three principal cartographic methods applicable to ethnic maps, the diagram method is the only one that allows the combination of absolute and relative values. It is also applicable at all scales and in cases of major national/ethnic diversity. This elevates it significantly above the dot spread method and the area method in terms of applicability, quality and precision of information. The latter does not relate a population characteristic to the population but to the area and thus contradicts a basic rule of cartographic methodology. It is nevertheless the most frequently used because of its easy legibility and striking effect.
0. Predgovor
Ovaj je članak posvećen prof. dr. sc. Miljenku Lapaineu povodom njegovog 70. rođendana, u znak zahvalnosti za njegove iznimne zasluge kao kartografa i stručnjaka za geodeziju i kartografske projekcije te kao divnog kolege na razini predsjedavajućih povjerenstava Međunarodnog kartografskog društva (ICA). Za njegove mu je znanstvene zasluge i doprinos ICA-i dodijeljeno počasno članstvo (Honorary Fellowship ) ICA-e 2019. godine. Za mene on predstavlja i dugi niz hrvatskih kartografa i geografa s kojima sam surađivao od ranih vremena svoje profesionalne karijere 1980-ih i kojima toliko dugujem – počevši od Zlatka Pepeonika, Petrice Novosel-Žic, Hrvoja Turka i Nikole Stražičića pa do Borne Fuerst-Bjeliš, Ive Nejašmića, Damira Magaša ili Mladena Klemenčića. Bit ću sretan i ponosan budem li mogao nastaviti tu vezu još mnogo godina. Također, osjećam potrebu spomenuti pokojnu Mirjanku Lechthaler, gotovo simbola bliskih hrvatsko-austrijskih odnosa, s kojom sam imao veliko zadovoljstvo surađivati. Akademsku je karijeru započela u Zagrebu kod Nedjeljka Frančule i Miljenka Lapainea, preselila se 1985. u Beč i tamo radila kao docentica na Tehničkom sveučilištu do 2011. Preminula je 2016. godine.
1. Uvod
Odmah na početku valja reći da nacionalne i etničke skupine kao obilježja etničkih karata nisu činjenice koje se mogu odrediti samo na temelju objektivnih obilježja. Osobna pripadnost određenoj naciji ili etničkoj skupini često se temelji na objektivno utvrdivim karakteristikama poput jezika ili vjere. No ulogu igraju iobiteljska tradicija, modeli i ideje prenesene kroz odgoj, prestiž ili razmišljanje o prilikama. U principu, pitanje je to osobne odluke, subjektivnog zadatka nakon vaganja raznih gledišta. To može biti u suprotnosti s objektivnim karakteristikama i imati drukčiji rezultat kada se promijene političke i društvene okolnosti (vidiBrunnbauer 2002,Gellner 1983,Heller 2011,Mitchell 2005,Schermerhorn 1970,Symmons-Symonolewicz 1985,White 2000,2004).
Eklatantan primjer subjektivnog i promjenjivog opredjeljenja su Romi, od kojih se tek mali dio tako izjašnjava u službenim popisima stanovništva, ali se mnogo češće ubrajaju u većinsko stanovništvo. Čak su i Austrijanci koji govore njemački u međuratnom razdoblju sebe doživljavali kao Nijemce. Tek nakon Drugog svjetskog rata pojavio se koncept austrijske nacije kojoj se većina Austrijanaca danas pripisuje (vidiPelinka 1990,Thaler 2001). Prije Drugog svjetskog rata kršćanski su se Slaveni u današnjoj Sjevernoj Makedoniji još uvijek pretežno osjećali Srbima ili Bugarima i imali su samo neku vrstu regionalnog identiteta prije nego što su pronašli vlastiti nacionalni identitet pod okriljem federalno organizirane Jugoslavije koja je htjela dati većinskim skupinama svojih konstitutivnih republika status nacija (vidiJordan 1998).
No, usprkos svojoj subjektivnosti i promjenjivosti, nacionalne/etničke pripadnosti imaju veliki značaj te su stoga često tema kartografskog prikaza. Za to se mogu navesti sljedeći razlozi:
Narodi u smislu zajednica koje dijele i povezuju zajedničke kulturne karakteristike kao što su jezik, religija ili povijest[1] i etničke grupe u smislu podjedinica naroda s kulturnim specifičnostima politički su akteri i zastupaju specifične interese svoje grupe.
Nacionalna/etnička svijest promiče koheziju društva i može se politički koristiti za povećanje osjećaja zajedništva i motivacije, za oslobađanje dodatne energije (čak i do ekstrema, do nasilnog sukoba). Pozivi na nacionalnu svijest osobito su česti u kriznim i konfliktnim situacijama, što je bilo vidljivo i u procesu raspada Jugoslavije, u transformacijskoj krizi u postkomunističkoj Europi te ponovno vidljivo u aktualnom ratu protiv Ukrajine.
Nacionalna/etnička svijest može biti važan čimbenik osobnog i grupnog identiteta – osobito nakon sloma komunizma koji je za neke ostavio identitetski vakuum te pod utjecajem kulturne globalizacije koja često potiče na promišljanje o vlastitom identitetu.
Stoga, nije iznenađujuće da je proizvodnja etničkih karata značajno porasla nakon pada komunizma, ne samo u postkomunističkoj Europi, već i oko nje (vidi, npr.Magocsi 2022). Svaki od novih nacionalnih i tematskih atlasa zemalja u transformaciji sadrži karte o toj temi. No, nacionalne/etničke skupine tamo se često shvaćaju kao zajednice porijekla, a ne subjektivne pripadnosti.
Geografski atlas Slovenije (Fridl i sur. 1998), npr., najopsežniji je tematski kartografski proizvod Slovenije i o Sloveniji od njezine neovisnosti, sadrži kartu rasprostranjenosti Slovenaca diljem svijeta (vidisl. 1) koja također sadrži potomke onih koji su u 19. stoljeću emigrirali kao pripadnici slovenskog naroda, iako su možda u međuvremenu prihvatili nacionalnu svijest odredišta.
U tom je pogledu vrlo bogata i mađarska kartografija. Naime, Károly Kocsis (Kocsis 1994,2005a,2005b,Kocsis i Bognár 2003,Kocsis i Kicošev 2004) nastojao je zabilježiti mađarsku manjinu u zemljama susjednima Mađarskoj(vidisl. 2). I nedavno objavljeni svezak 3 ("Društvo") novog mađarskog nacionalnog atlasa (slika 3) stavlja snažan naglasak na nacionalnu/etničku svijest (Kocsis i sur. 2021).
Također, autor ovog članka je nakon 1989/90 izradio etničke karte na zahtjev raznih školskih atlasa i priručnika o Jugoistočnoj Europi te je smatrao potrebnim i informativnim uključiti nekoliko drugih u Atlas Istočne i Jugoistočne Europe koji je sam uredio (vidiJordan 1994,1995a,1995b,1999b,2000,2001,2007a;Jordan, Kocsis i sur. 2006,Jordan i Schappelwein 1993).
Cilj ovog članka nije pratiti razvoj etnokartografske metodologije, već usporediti glavne metode te kartografske poddiscipline ističući njihove prednosti i nedostatke te usredotočujući se na njihovu sposobnost adekvatnog odražavanja različitih prostornih struktura etničke pripadnosti, uglavnom na temelju autorovih vlastitih iskustava u izradi etničkih karata Europe s fokusom na njezine istočne dijelove.
2. Filtri između obilježja i karte
Etnička karta pokazuje nacionalnu/etničku svijest, odnosno subjektivnu nacionalnu/etničku pripadnost osobe (i to možda samo tajno) nakon trostrukog filtriranja.
Prvi filtar je spremnost osobe da se javno i pošteno izjasni o nacionalnoj/etničkoj pripadnosti ili svijesti u popisu stanovništva ili sličnim službenim ispitivanjima. Ta spremnost može biti rijetka u represivnim političkim okolnostima ili kad se radi o pripadnosti skupinama koje se ne poštuju ili su diskriminirane. Na nju mogu utjecati i etnička polarizacija, dihotomija urbano-ruralno, razina obrazovanja, dob i česta pojava da etnička/nacionalna svijest nije toliko razvijena kod pripadnika većine, nego kod pripadnika manjine jer je za potonje etnički identitet mnogo veći svakodnevni izazov.
Drugi filtar je metoda brojanja i analize podataka koju su odabrale vlasti. U slučaju prebrojavanja, može varirati između unaprijed definiranih kategorija pripadnosti i slobodnog navođenja bilo koje pripadnosti, između pisanog i usmenog ispitivanja.
U Češkoj je, primjerice, nakon njezina odvajanja od Slovačke 1993. prvi put u popisima stanovništva bilo moguće navesti vlastitu pripadnost mimo zadanih kategorija. Kao rezultat toga, mnogi su sebe nazivali Moravcima ili Šležanima, a ne Česima. Usmeno ispitivanje službenoga popisnog tijela, koje je, na primjer, uobičajeno u Rumunjskoj, može dovesti do toga da oni koji su neodlučni, nesigurni i kolebljivi budu usmjereni prema pripadnosti koju popisno tijelo želi ili bude "politički korektno".
Prilikom ocjenjivanja i dokumentiranja podataka tijelo može ostaviti nepromijenjene kategorije korištene u istraživanju ili ih kombinirati u šire kategorije. Ako je potonji slučaj, neke se nacionalne/etničke skupine više neće pojavljivati u konačnom rezultatu, dok će se druge u skladu s tim povećati. Takva je praksa poznata u Rumunjskoj gdje se ljudi koji su se identificirali kao Meglenski Vlasi ili kao Aromuni prema slici o sebi kao etničke skupine, ali iz službene rumunjske perspektive dijelovi rumunjske nacije, pojavljuju u službenoj dokumentaciji pod "Rumunji".
Treći filtar je metodologija kartografskog prikaza. U principu, karte mogu objektivno i neutralno reproducirati podatke (koji su morali proći kroz prva dva filtra i mogli su se na njima deformirati). Međutim, karte su uvijek apstrakcije stvarnosti, nužno sadržajno reducirane. Moraju generalizirati u skladu sa svojim mjerilom i kao rezultat toga često ne uspijevaju uhvatiti vrlo male jedinice i suptilne razlike. To može djelovati na štetu nekih nacionalnih/etničkih skupina.
Međutim, karte također nude širok raspon mogućnosti za namjerno (manipulativno) ili nenamjerno (uzrokovano nepravilnom ili nepažljivom primjenom metodologije) iskrivljavanje korištene baze podataka. Takva je izobličenja čitaču karte često teško detektirati. Ona su još opasnija budući da se za karte, za razliku od tekstova, često smatra da "reflektiraju stvarnost" i da su pouzdanije. Spomenimo neka relevantna djela u ovom kontekstu:Demeter i sur. (2020),Monmonier (2018),Svatek (2018),Vytautas (2011).
3. Snage i slabosti osnovnih kartografskih metoda primjenjivih na etničke karte
Glavne su metode kartografiranja nacionalne/etničke svijesti metoda areala, metoda širenja točaka i metoda dijagrama. Mogu se kombinirati i modificirati na mnogo načina i primjenjive su na karte jezika (vidi npr.Breu 1989,Kamusella 2021).
Kod metode površina, odnosno izrade površinskih kartograma ili koropletne karte (slika 4), znakovi za površine (boje, uzorci) koji prikazuju nacionalne/etničke skupine odnose se na statistički, administrativno ili topografski definirane prostorne jedinice.
Metodom točkastog širenja, odnosno izradom karte točaka (slika 7) kartografski znakovi u obliku točaka istih ili različitih veličina, čiji oblik ili boja označavaju nacionalne/etničke skupine, postavljaju se što točnije u podlogu topografske karte.
Metodom dijagrama, odnosno izradom kartodijagrama (slika 8) krugovi ili različito oblikovani objekti (npr. kvadrati, kocke) različitih veličina, koji su prikazani bojama ili uzorcima prema udjelima nacionalnih/etničkih skupina u ukupnom stanovništvu, nalaze se u središtu ili žarišnoj točki statistički i/ili administrativno definirane prostorne jedinice.
3.1. Metoda površina
Snaga je metode površina (vidisliku 4) njezina laka čitljivost i upečatljiv učinak, osobito kada se boje koriste kao kartografski znakovi. Stoga je to i najčešće upotrebljavana metoda. No, ono zapravo prenosi samo dojam na kojem je području neka nacionalna/etnička skupina rasprostranjena ili na kojem području ima većinu. Uglavnom daje informaciju o tome koju nacionalnu/etničku skupinu očekivati prilikom odlaska na određeno područje, dok ne daje informaciju o kvantitativnom rasporedu nacionalnih/etničkih skupina. Gusto naseljena urbana područja nisu prikazana drugačije od visokih planinskih područja ili močvarnih područja. To pogoduje nacionalnim/etničkim skupinama koje čine većinu u ruralnim ili rijetko naseljenim područjima. Oni tada daju boju relativno velikom prostoru, iako su malobrojni. Skupine iste veličine ne pojavljuju se na karti u gradovima jer tamo čine samo zanemarive manjine. Zapravo, metoda područja ponekad se namjerno koristi u tu svrhu.
Glavni je nedostatak metode površina nezahvaćanje apsolutne distribucije vrijednosti etničkih skupina i može se ublažiti: (1) isključivanjem rijetko naseljenih ili nenaseljenih regija iz tematskog prikaza (vidisliku 5), (2) dodatnom upotrebom dijagramskih slika (npr. krugovi) za veće gradove (vidisliku 5), (3) njihovo dopunjavanje dijagramima ili točkama za manjine (vidisliku 6), ili (4) uključivanje gustoće naseljenosti u informacije na karti korištenjem različitih intenziteta tematskih boja za različite razine gustoće naseljenosti.
No, time se temeljni, konceptualni nedostatak te metode samo ublažava, a ne kompenzira. Riječ je o tome da metoda površina ne dovodi u vezu karakteristiku stanovništva nacionalne/etničke pripadnosti s relevantnom statističkom referentnom jedinicom, tj. ukupnim brojem stanovnika, već s površinom koja je zapravo samo područje tog odnosa. Strogo govoreći, metoda površina nije znanstveno opravdana. Međutim, budući da druge dvije metode gube svoje prednosti smanjenjem mjerila karte, metoda površina zadržava svoju snagu dobre čitljivosti, široko se koristi na kartama manjeg mjerila (kao što su one u školskim atlasima).
Problem s metodom područja je i taj što ostavlja dojam oštrih granica između nacionalnih/etničkih skupina te fiksnog i isključivog odnosa između nacionalnih/etničkih skupina i teritorija. Stoga je u stanju poduprijeti zahtjeve nekih nacionalnih/etničkih skupina za "etničkim teritorijem" (teritorijem koji "pripada" ovoj skupini). U vrijeme kada, barem izvan globalnog juga,zatvorena ruralna društva gotovo više i ne postoje, a nacionalne/etničke skupine se zbog migracija, zapošljavanja i obrazovanja češće predstavljaju u obliku prostorno prožetih mreža nego zatvorenih naseljskih zajednica, to se, također, čini nerealnim.
3.2 Dot spread method
Metoda točaka (vidisliku 7) može obuhvatiti apsolutni broj nacionalne/etničke skupine i topografski točno prikazati prostornu distribuciju te skupine.
Kada se bilježi apsolutni broj, njegova je dodatna snaga sposobnost prikazivanja apsolutnih vrijednosti na lako prebrojiv način s pomoću kartografskih znakova iste veličine ili nekoliko veličina. Međutim, gradacija veličine koja mu je svojstvena omogućuje samo očitavanje stupnjevanih (okruglih) vrijednosti. Klizna bi simbolizacija bez koraka eliminirala taj nedostatak, ali bi lišila metodu njezine velike prednosti, a to je lako brojanje.
Topografski točan prikaz prostorne distribucije pretpostavlja da su podatci dostupni u odgovarajućoj prostornoj rezoluciji. Dakle, prostorni se raspored etničkih skupina unutar općine može prikazati samo ako su dostupni podatci barem po naseljenim mjestima. Nedostatak statističkih podataka koji odgovaraju mjerilu karte može se na kraju nadoknaditi vrlo dobrim lokalnim poznavanjem. Ne iznimno, međutim, karte s raspršenim točkama simuliraju točnost koja nije opravdana razinom detalja podataka ili lokalnim znanjem.
Nedostatak metode točaka je taj što se, iako može prikazivati apsolutne vrijednosti, odnos veličine između različitih skupina prenosi nejasno. Brojanjem točaka unutar određenog područja čitatelj može steći predodžbu o relativnoj veličini različitih skupina u tom području. Ali to je, zbog zaokruženih vrijednosti točaka, nespretno i nikad u potpunosti točno.
Još jedan nedostatak proizlazi iz malog vizualnog tijela točkastih znakova. Mali znakovi omogućuju jasno razlikovanje do pet boja. Dodatna varijacija oblika znakova (npr. krug, trokut, kvadrat) svakako može omogućiti prikazivanje dodatnih razlika, ali to čini kartu teže čitljivom. U svakom slučaju, takav pristup ograničava mogućnost zastupanja većeg broja nacionalnih/etničkih skupina.
Metoda točaka prvenstveno se koristi za prikaz manjih područja u krupnom mjerilu, ali ne, na primjer, za prikaz multietničkih situacija u većem dijelu Europe ili na kartama cijelog kontinenta u sitnom mjerilu.
Kako se mjerilo smanjuje, velika se prednost te metode, mogućnost topografskog prikazivanja prostorne distribucije nacionalnih/etničkih skupina, ionako gubi. Ako mjerilo karte više ne može prikazati prostorni raspored planina i dolina, gusto i rijetko naseljenih područja, onda je i metoda točaka izgubila svoje opravdanje.
Međutim, za razliku od metode površina, ona je znanstveno opravdana jer povezuje karakteristiku stanovništva "nacionalna/etnička klasifikacija" s ukupnom populacijom i tako omogućuje da se uz distribuciju nacionalnih/etničkih skupina jasno identificira gustoća naseljenosti.
Nacionalne/etničke skupine u rijetko naseljenim područjima imaju malu težinu na karti, one u gusto naseljenim područjima imaju veliku težinu. Metoda također izbjegava identificiranje "etničkih teritorija" jer njezine točke označavaju specifičnu vrijednosnu jedinicu rezidentnog stanovništva i nedostaju tamo gdje nitko ne živi. Planine i močvare ostaju bez kartografskih znakova i nisu nacionalno/etnički obojene.
3.3. Metoda dijagrama
Metoda dijagrama (vidisliku 8) jedina je koja kombinira prikaz apsolutne i relativne vrijednosti. Iz veličine dijagrama (npr. kruga) i njegove podjele na (npr. obojene) sektore može se odrediti i apsolutni broj nacionalne/etničke skupine i njezin udio u ukupnom stanovništvu naseljenog mjesta ili administrativne jedinice pročitati precizno i na prvi pogled. Ako je dijagram također dimenzioniran tako da je njegova površina proporcionalna broju stanovnika koje prikazuje, tada karta koja koristi metodu dijagrama također daje vizualno pouzdan dojam stvarnog rasporeda stanovništva i nacionalne/etničke pripadnosti. Osim toga, uz pomoć tumača znakova moguće je precizno odrediti vrijednost značajke, pod uvjetom da je za dijagrame odabran klizni ključ znakova. U slučaju interaktivnih elektroničkih karata vrijednost značajke može se prikazati numerički, čak i s višeslojnim tumačem znakova, klikom na odgovarajući sektor.
Sektori dijagrama obično mogu biti toliko veliki da se mnoge (do 100) nacionalno/etničke skupina mogu razlikovati s pomoću boja ili uzoraka. To je dovoljno za prikaz većih i nacionalno/etnički vrlo raznolikih dijelova svijeta. Metoda se može primijeniti i na krupna mjerila s velikim prostornim detaljima i na najsitnija mjerila.
Međutim, podjela dijagrama na sektore postavlja donju granicu onoga što se može prikazati. Sektori koji su preuski više se ne mogu jasno razlikovati bojama ili uzorcima, posebno u slučaju manjih dijagramskih figura. Ovisno o rasponu vrijednosti unutar tematski zastupljenog područja, manjine koje čine manje od 3 do 5% ukupnog stanovništva prostorne referentne jedinice teško mogu biti zastupljene. Njihov udio mora biti raspodijeljen proporcionalno skupinama koje mogu biti zastupljene. To ide u prilog dotičnoj većini. Kako bi taj prag bio što je moguće niži, ima smisla označavati nacionalne/etničke skupine (redundantno) brojevima uz boje ili uzorke, barem tamo gdje su male manjine. Dodatni je način redundantnog povećanja sigurnosti čitanja raspored krugova ili pruga pojedinačnih nacionalnih/etničkih skupina istim redoslijedom u svakom krugu ili kvadratu (vidisliku 9).
Postavljanje praga omogućuje manipulaciju. Može se (kao i kod drugih dviju metoda) postaviti nepotrebno visoko kako bi manjine nestale i veće nacionalne/etničke skupine izgledale još impresivnije (dodavanjem manjinskog sektora ili trake većinskom sektoru ili traci). Pristup po kojem se sve manjine koje ne prijeđu prag svrstavaju u jednu ili više većih skupina, čak i ako njihov kumulativni udio u ukupnom stanovništvu prelazi prag, manipulativan je i lako ga je prikriti. Ispravno bi predstavljanje moralo prikazati kumulativni udio svih manjina u kategoriji "Ostalo".
Uz taj nedostatak niže granične vrijednosti, koji metoda dijagrama dijeli s metodama površina i točaka, metoda dijagrama ne prikazuje detaljnije prostorni raspored nacionalnih/etničkih skupina. Slika dijagrama odnosi se na stanovništvo statističke i/ili administrativne jedinice i obično se postavlja sa svojim središtem u geometrijskom ili populacijskom središtu. Ne prati (poput metode točaka) točnu prostornu distribuciju niti (poput metode površina) područje pojavljivanja nacionalne/etničke skupine, već prepušta čitatelju da interpretira informacije u smislu područja i lokacije. Prostorni raspored i područje rasprostranjenosti nacionalne/etničke skupine, stoga, često nisu jasni.
To je također osnova raširenog mišljenja da je karta koja koristi metodu dijagrama "komplicirana" i "teška za čitanje". Međutim, ona također izbjegava svako pojavljivanje "etničke teritorijalnosti".
4. Upotreba boja
Upotreba boja u etničkim (i jezičnim) kartama nudi široke mogućnosti za manipulaciju. Međutim, samo je nekoliko metoda koje se jasno mogu opisati kao narušavanje kartografske objektivnosti.
Jedna od njih je upotreba najupečatljivije boje za identifikaciju vlastite nacionalne/etničke skupine, osim ako se ne radi o malobrojnoj manjini (vidisliku 10). Kršenje se sastoji u činjenici da je vlastita skupina (skupina autora ili izdavača karte) velika među onima koji su zastupljeni u relevantnom području na karti i "bojom ubija" manje skupine ako je označena posebno karakterističnom i svijetlom bojom. Ako se, pak, radi o maloj manjini, onda je kričava boja vrlo prikladna.
Druga metoda manipulacije bojom sastoji se u "sakupljanju" drugih nacionalnih/etničkih skupina dajući im boju koja se teško razlikuje od vlastite skupine (vidisl. 10) ili jednostavno ih prikazujući kao različite samo s pomoću uzorka pretiska ili oznake.
Ostala kršenja uključuju "skrivanje" manjina dodjeljivanjem boja koje nisu uočljivije od onih koje se koriste za većinske skupine ili korištenjem tamnih i "prljavih" boja za nacionalne/etničke skupine s namjerom da čitatelju izgledaju nesimpatično ili prijeteće.
5. Zaključak
Kartografska metodologija omogućuje da etničke karte budu objektivne. Međutim, etničke karte prikazuju obilježja koja, nakon subjektivne procjene, prolaze kroz dvostruki filtar prije nego što se stave na kartu (spremnost službeno intervjuirane osobe da da iskrenu informaciju, metodologija službenog prikupljanja podataka i analize podataka). Podatci dostupni kartografu mogu, stoga, već biti iskrivljeni. U prirodi je karte da apstrahira i generalizira, što može djelovati na štetu nacionalnih/etničkih manjina.
Od triju glavnih kartografskih metoda primjenjivih na etničke karte, metoda dijagrama je jedina koja dopušta kombinaciju apsolutnih i relativnih vrijednosti. Također, primjenjiva je na svim razinama i u slučajevima velike nacionalne/etničke raznolikosti. To je značajno izdiže iznad metode točaka i metode površina u smislu primjenjivosti, kvalitete i preciznosti informacija. Metoda površina ne povezuje karakteristiku stanovništva sa stanovništvom, nego s područjem i stoga je u suprotnosti s osnovnim pravilom kartografske metodologije. Ipak je, zbog svoje lake čitljivosti i upečatljivog učinka, najčešće upotrebljavana.
