Skoči na glavni sadržaj

Recenzija, prikaz

https://doi.org/10.32909/kg.19.34.4

Tipologija ruskih regija i gradova prema uzrocima smrti

Olga Yu. Chereshnia orcid id orcid.org/0000-0002-5446-7111 ; Lomonosov Moscow State University, Faculty of Geography Leninskie Gory 1, 119991, Moscow, Russia
Natalia A. Shartova ; Lomonosov Moscow State University, Faculty of Geography Leninskie Gory 1, 119991, Moscow, Russia
Vladimir S. Tikunov ; Lomonosov Moscow State University, Faculty of Geography Leninskie Gory 1, 119991, Moscow, Russia


Puni tekst: hrvatski pdf 5.245 Kb

str. 65-81

preuzimanja: 12

citiraj

Puni tekst: engleski pdf 5.245 Kb

str. 64-80

preuzimanja: 7

citiraj

Preuzmi JATS datoteku


Sažetak

U Rusiji je evidentan problem visoke stope smrtnosti u usporedbi sa zemljama sa sličnim životnim standardom. To se posebno uočava na regionalnoj razini gdje su razlike u smrtnosti i strukturi smrtnosti ogromne.
Regije Rusije nalaze se u različitim fazama epidemiološke tranzicije. To se izražava u razlikama u njihovoj stopi smrtnosti i razlikama u strukturi uzroka smrti.
Regije i najveći gradovi zemlje ponekad se radikalno razilaze, što uvelike komplicira istraživanje. Ovaj rad predstavlja tipologiju regija i velikih gradova Ruske Federacije prema glavnim klasama uzroka smrti u 2015. godini i njihove kartografske prikaze.
Prostorne se značajke smrtnosti prema glavnim uzrocima smrti određuju odvojeno za muškarce i žene. Procjena je izvršena klasifikacijom prema demografskim pokazateljima (uzroci smrtnosti: neke zarazne i parazitske bolesti; tumori; bolesti krvožilnog sustava; bolesti dišnog sustava; bolesti probavnog sustava; vanjski uzroci smrti).
Skup podataka obuhvaćao je 250 teritorijalnih jedinica: 85 regija (uključujući gradove od saveznog značaja) i 165 velikih gradova s populacijom većom o 100 000. Na temelju primarne statistike izračunane su standardizirane stope smrtnosti. Klasifikacija je provedena prema algoritmu koji je razvio jedan od autora.
Prikazana nam klasifikacija omogućuje isticanje specifičnih karakteristika pojedinih skupina regija i analizu s većim stupnjem točnosti.

Ključne riječi

ruske regije; stopa smrtnosti; uzroci smrti; tipologija; kartografija

Hrčak ID:

252040

URI

https://hrcak.srce.hr/252040

Datum izdavanja:

17.10.2020.

Podaci na drugim jezicima: engleski

Posjeta: 674 *


References / Literatura


Author (1997) Classifications in Geography: Renaissance or Withering? (The Experience of Formal Classifications). Smolensk: Publishing house of SSU. 367 p. (in Russian)


Authors (2016) Public health index in the Russian Federation from 1990 to 2013 in comparison with other countries. Geography, Environment, Sustainability, 9, 1, 94-108.


Barchuk A, Bespalov A, Huhtala H, Chimed T, Laricheva I, Belyaev A, Bray F, Anttila A, Auvinen A (2018) Breast and cervical cancer incidence and mortality trends in Russia 1980–2013. Cancer Epidemiology, 55, 73-80.


Brainerd E, Cutle D M (2005) Autopsy on an empire: Understanding mortality in Russia and the former Soviet Union. Journal of Economic Perspectives, 19, 107-130.


Danilova I, Shkolnikov V M, Andreev E, Leon D A (2020) The changing relation between alcohol and life expectancy in Russia in 1965-2017. Drug and Alcohol Review, 39, 790-796.


Denisenko M B, Kalmykova N M (2009) Demography. Moscow: INFRA-M.432 p.(in Russian)


Gavrilova N S, Semyonova V G, Dubrovina E, Evdokushkina G N, Ivanov A E, Gavrilov L A (2008) Russian mortality crisis and the quality of vital statistics. Population Research and Policy Review, 27, 551-574.


Grigoriev P, Jasilionis D, Klusener S, Timonin S, Andreev E, Mesle F, Vallin J (2020) Spatial patterns of male alcohol-related mortality in Belarus, Lithuania, Poland and Russia. Drug and Alcohol Review, 39, 835-845.


(2003) International Statistical Classification of Diseases and Health Problems. ICD-10. Moscow: Medicine, 1, 741-741.


Mackenbach J P (2006) Health inequalities: Europe in profile. Department of Health,London


Mackenbach J P, Kulhánová I, Menvielle G, Bopp M, Borrell C, Costa G, Deboosere P, Esnaola S, Kalediene R, Kovacs K, Leinsalu M, Martikainen P, Regidor E, Rodriguez-Sanz M, Heine Strand B, Hoffmann R, Eikemo T A, Östergren O, Lundberg O (2015) Trends in inequalities in premature mortality: a study of 3.2 million deaths in 13 European countries. J Epidemiol Community Health, 69, 207-217.


Mackenbach J P, Stirbu I, Roskam A-J R, Schaap M M, Menvielle G, Leinsalu M, Kunst A E (2008) Socioeconomic Inequalities in Health in 22 European Countries. New England Journal of Medicine, 358, 2468-2481.


Rybakovsky Ed. L L (2005) Practical demography. Textbook for universities. Moscow: TsSP, 280 p. (in Russian)


Razvodovsky Y E, Zotov P B (2016) Suicides Cancer Mortality In Russia: A Comparative Analysis Of Trends. Suicidology, 7, 54-58.


Razvodovsky Y E (2017) Suicides and cancer mortality in Russia: A comparative analysis of trends. . European Psychiatry, 41, 253-253.


Rehm J, Sulkowska U, Manczuk M, Boffetta P, Powles J, Popova S, Zatonski W (2007) Alcohol accounts for a high proportion of premature mortality in central and eastern Europe. International Journal of Epidemiology, 36, 458-467.


Repetskaya A L (2019) Murders In Russia: Method for Determining Latency of an Array. Vestnik Tomskogo Gosudarstvennogo Universiteta-Pravo-Tomsk State University Journal of Law (In Russian), 55-68.


(2018) Russian statistical yearbook. Stat. Rosstat. Moscow. 694 p. (in Russian)


Rybakovsky O L, Sudoplatova V S, Tayunova O A (2017) The Potential For Reducing Mortality in Russia (In Russian). Sotsiologicheskie Issledovaniya, 29-42.


Shkolnikov V M, Andreev E M, Tursun-Zade R, Leon D A (2019) Patterns in the relationship between life expectancy and gross domestic product in Russia in 2005–15: a cross-sectional analysis. Lancet Public Health, 4, 181-188.


Shkolnikov V M (2004) Educational differentials in male mortality in Russia and northern Europe. A comparison of an epidemiological cohort from Moscow and St. Petersburg with the male populations of Helsinki and Oslo. Demographic research. Vol. 10. Article 1, -.


(2015) The Demographic Yearbook of Russia. Statistical Handbook, Stat. Rosstat. Moscow (in Russian)


Timonin S, Danilova I, Andreev E, Shkolnikov V M (2017) Recent Mortality Trend Reversal in Russia: Are Regions Following the Same Tempo?. European Journal of Population-Revue Europeenne De Demographie, 33, 733-763.


Vishnevsky A, Andreev E, Timonin S (2016) Mortality from diseases of the circulatory system and life expectancy in Russia. Demographic Survey, 1, 6-34.


(2008) World Health Organization, Commission on Social Determinants of Health. Closing the Gap in a Generation. Health Equity through the Social Determinants of Health, Geneva, -.


Yumaguzin V V, Vinnik M V (2019) Assessment of the Real Rates of Homicides and Suicides in the Regions of Russia. Sotsiologicheskie Issledovaniya (In Russian)), 116-126.


Zaridze D, Lewington S, Boroda A, Scelo G, Karpov R, Lazarev A, Konobeevskaya I, Igitov V, Terechova T, Boffetta P, Sherliker P, Kong X L, Whitlock G, Boreham G, Brennan P, Peto R (2014) Alcohol and mortality in Russia: a prospective observational study of 151 000 adults. Lancet, 383, 1465-1473.

Zahvale

Rad je izveden kao projekt Ruske zaklade za znanost, No 20-47-01001.

Acknowledgment

The work was carried out as a project of the Russian Science Foundation, No 20-47-01001.


This display is generated from NISO JATS XML with jats-html.xsl. The XSLT engine is libxslt.


Background

To date, many studies have shown persistent or growing inequalities in public health indicators between upper and lower socioeconomic groups, between countries, and within them (Mackenbach et al. 2015,Author 2016,Mackenbach et al. 2008). As a rule, people with a lower level of education or lower professional qualifications and income die at a younger age; in these population groups, the prevalence of diseases and injuries is significantly higher (World Health Organization 2008,Mackenbach 2006). Although Russia has been characterised in recent years by decreasing mortality rates for almost all the main classes of causes of death (with the exception of tumours), the problems of great spatial inequalities in public health (16 years between the highest and lowest regional indicators of life expectancy) gender differences (in 2016, the gap between the life expectancy of men and women was 10.5 years) and difference between groups with different levels of education (Shkolnikov et al. 2004) are among the highest in the world. With current economic living standards in Russia, life expectancy may be significantly higher, and inequality lower. In 2015, life expectancy for both Russia and Moscow was lower than expectations based on the Preston curve by 6.5 years and 4.9 years, respectively (Shkolnikov et al. 2019). Vishnevsky, Andreev, and Timonin believe that high premature mortality from diseases of the circulatory system (Vishnevsky et al. 2016) and its long-term adverse dynamics is one of the main reasons why Russia lags behind other developed countries in terms of life expectancy. Another factor in the shortness of life expectancy compared to countries with a similar level of GDP per capita is high mortality from external causes in the working age population (Shkolnikov et al. 2019).

In this regard, studying regional inequality in causes of death is an urgent task. The purpose of this study is to understand regional patterns of mortality in Russia better by analysing the inter-regional inequality of mortality within the country and compiling an appropriate mathematical classification. This will highlight the leading regional factors which are aggravating spatial inequality in public health in Russia.

Methods

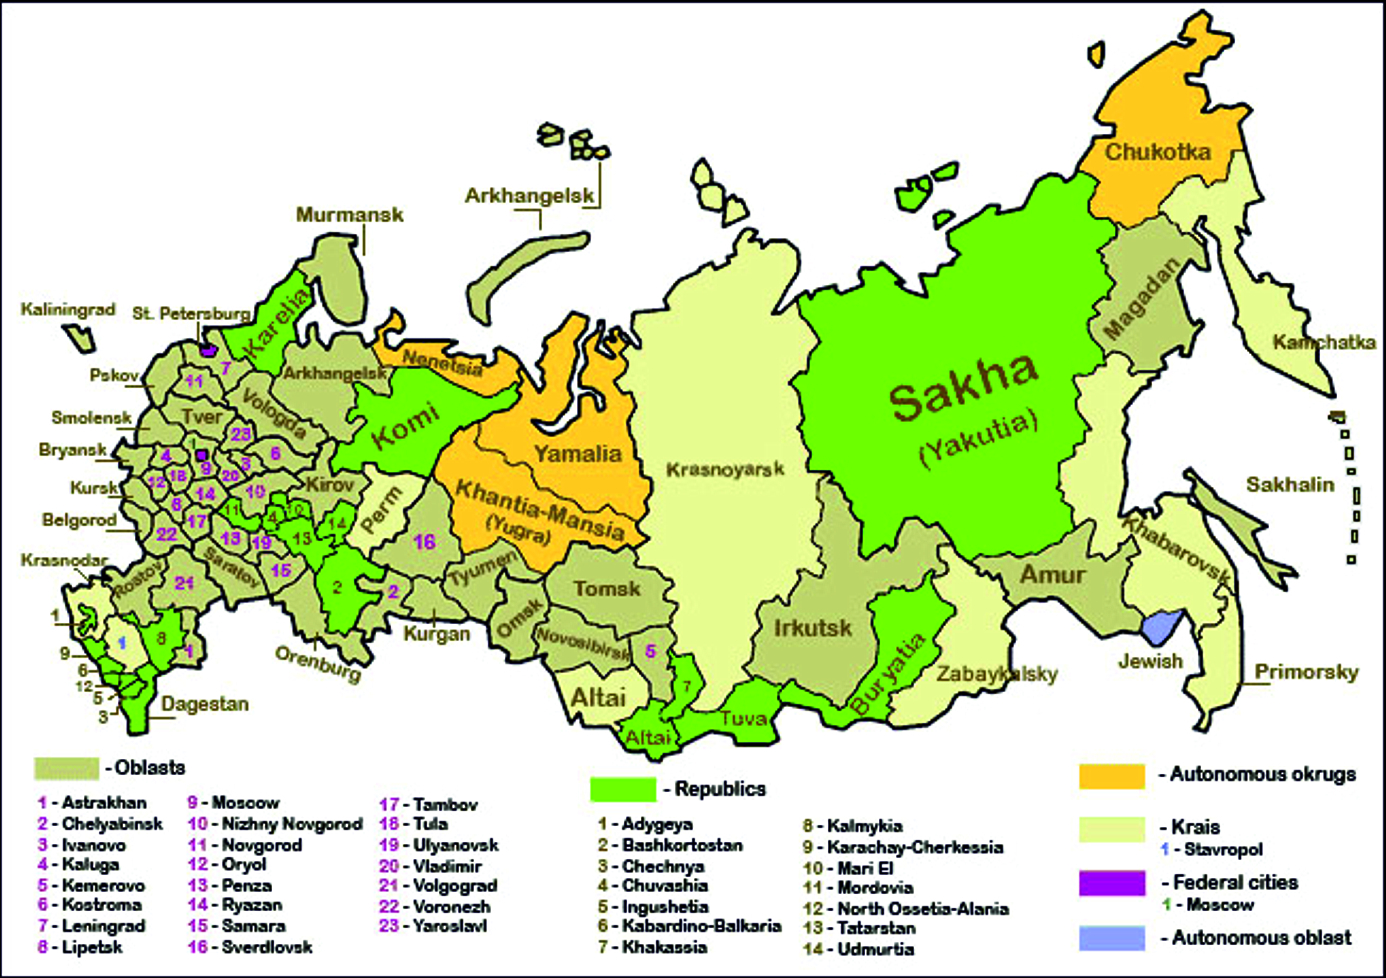
The assessment was carried out using estimated classifications by demographic indicators. The study was based on data on mortality rates published in “Regions of Russia” and “Demographic Yearbook of Russia” by the Federal State Statistics Service (Rosstat). A database of cities of the Russian Federation for 2011–2015 was created according to information provided by Rosstat upon request. The dataset included 250 territorial units: 85 regions (including cities of federal significance) and 165 large cities with populations of over 100,000 (Fig. 1). Data on cities were not excluded from regional statistics. This was done intentionally since the analysis was not carried out for all cities, but only for some of the largest, which would not have provided a clear picture of the urban/rural population.

Figure 1 Federal subjects of Russia / Slika 1. Savezne teritorijalne jedinice Rusije
kig-19-64-g1.jpg

The selection of indicators for the database was carried out based on the tenth revision of the International Classification of Diseases (ICD-10). Altogether, 306 causes of death were analysed, including disease classes according to ICD-10 and individual nosological entities. Consequently, 140 causes of death were selected and included in the database. They were of prime importance in conducting a medical-geographical analysis of the health status of the urban population.

Based on the primary statistics, standardised mortality rates were calculated using the 1975 World Health Organization European standard. The direct standardisation method was used (Practical demography 2005,Denisenko et.al. 2009). To determine the derived indicators, an algorithm for the automated calculation of standardised medico-demographic indicators using MS VisualFoxPro 9.0 DBMS was developed. The programme developed allows selecting the desired combination (year, cause of death, age group, gender, etc.) and the subsequent output of MS Excel tables containing the age-specific mortality rate, standardised mortality rate, lower and upper boundaries of the confidence interval, and the length of the confidence interval.

Thus, processing the primary material allowed us to obtain data representing the age composition of the population in 5-year groups, mortality for reasons corresponding to the classes of diseases according to ICD-10, and several pathologies for men and women separately.

Based on the obtained indicators (6 types of causes of death: some infectious and parasitic diseases; tumours; diseases of the circulatory system; respiratory diseases; diseases of the digestive system; external causes of death) classification was carried out according to an algorithm developed by one of the authors (Author 1997).

In the applied typological algorithm, the entire set of parameters for any territorial unit (TU) is denoted by X={x1,…,xN}, where xi -th ТU, N the number of TU. The initial TUs are represented in the form of a TU-sign matrix, which reflects the measurement of indicators on a TU and contains rows and columns:

[TeX:] \[X = \left( {\begin{array}{*{20}{c}} {{x_1}}\\ \cdots \\ {{x_N}} \end{array}} \right) = \left( {{x^{(1)}},{\rm{ }}...{\rm{ , }}{x^{(M)}}} \right) = \left( {\begin{array}{*{20}{c}} {x_1^{(1)}}&{ \cdots {\rm{ }}x_1^{(j)}}& \cdots &{x_1^{(M)}}\\ \cdots &{ \cdots {\rm{ }} \cdots }& \cdots & \cdots \\ {x_{N - 1}^{(1)}}&{ \cdots {\rm{ }}x_{N - 1}^{(j)}}& \cdots &{x_{N - 1}^{(M)}}\\ {x_N^{(1)}}&{ \cdots {\rm{ }}x_N^{(j)}}& \cdots &{x_N^{(M)}} \end{array}} \right),\]

where

  1. [TeX:] \[{x_i} = \left( {x_i^{(1)},{\rm{ }}...,{\rm{ }}x_i^{(M)}} \right)\]
    -i -th TU in M- dimensional space of parameters

  2. [TeX:] \[{x^{\left( j \right)}}\]
    - j -th parameter,
    [TeX:] \[{x^{\left( j \right)}} = \left( {x_1^{\left( j \right)},{\rm{ }}...{\rm{, }}x_N^{\left( j \right)}} \right),\]
    ,

  3. [TeX:] \[x_i^{^{\left( j \right)}}\]
    - the value of j -th parameter of i -th TU,

  4. [TeX:] \[i \in \left\{ {1,...,} \right.\left. N \right\},{\rm{ }}j \in \left\{ {1,...,} \right.\left. M \right\}.\]
    .

The next stage of TU classification is pre-treatment, including normalisation, weighing, and dimensionality reduction. Normalisation was carried out according to the variance and mathematical expectation. The purpose of this normalisation was to bring each indicator to a standard form (as a result, the mathematical expectation of any indicator becomes equal to zero, and the variance equal to one). Let:

  1. [TeX:] \[{\overline x ^{(j)}} = \frac{1}{N}\sum\nolimits_{i = 1}^N {x_j^{(i)}} \]
    -be the assessment of mathematical expectation of j -th parameter, and

  2. [TeX:] \[var\left( {{x^{(j)}}} \right) = \frac{1}{N}\sum\nolimits_{i = 1}^N {(x_j^{(j)}} - {\overline x ^{(j)}})\]
    - be the assessment of variance of j -th parameter.

Then normalisation means the recalculation

[TeX:] \[x_i^{(j)} = \frac{{x_i^{(j)} - {{\overline x }^{(j)}}}}{{\sqrt {{\mathop{\rm var}} ({x^{(j)}})} }}\forall j \in \left\{ {\left. {1,{\rm{ }}...{\rm{, }}M} \right\}} \right.,i \in \left\{ {\left. {1,{\rm{ }}...{\rm{, }}N} \right\}} \right.\]
, i.e.

[TeX:] \[{\Delta _1} = {\overline x ^{(j)}},{\rm{ }}{\Delta _1} = \sqrt {var\left( {{x^{(j)}}} \right)} \]

The next step includes the application of the principal component method. This method solves the problem of searching based on the existing system of attributes that describe a TU. The method of principal components should be used to correct the original feature space distorted by mutual correlations, reduce the amount of stored data without losing a significant part of information about the TU, visualize the TU in the feature space (for example, by displaying the TU in the form of points on a plane) and revealing hidden indicators, reflecting the essence of the process or phenomenon.

The simplest is the geometric interpretation of the principal component method. In a multidimensional parameter space, the TUs are considered as points whose cloud geometric arrangement, in the case of normal distribution, resembles an M-dimensional ellipsoid. The main axes of the imaginary ellipsoid are treated as the new parameters, sorted in the descending order of TU dispersion along the axes.

The most general relation is used to calculate the distance for M quantitative parameters:

[TeX:] \[{d_e}\left( {{x_i},{x_j}} \right) = \sqrt {{{\sum\nolimits_{x = 1}^M {\left( {x_i^{(x)} - x_j^{(x)}} \right)} }^2}} .\]

Our classifications aimed to obtain homogeneous TU groups in M-dimensional attribute space, i.e. possible "types" of TU. For this, the largest distance was selected from the obtained Euclidean distances, and the two territorial units that it connected became the nuclei of homogeneous clusters. Clusters were formed by the distribution of the remaining territories between the two cores according to the minimum Euclidean distances. In the case of the allocation of a larger number of clusters, to determine the third core and all subsequent ones, each remaining territorial unit was substituted in the form of a core, and the rest distributed between the three cores according to the minimum distance. The procedure for determining the 4th core and the formation of a typology with 4 types was similar to that described above, to the maximum possible value specified in advance tmax, and similarly with the minimum value tmin. The resulting number of groupings can be analysed by the absolute and relative heterogeneity coefficients and, thus, we can choose the optimal number of clusters:

[TeX:] \[{A_k} = \frac{{100\left\{ {\sum\nolimits_{k = 1}^K {\sum\nolimits_{j = 1}^n {\sum\nolimits_{i = 1}^n {{{\left[ {{{\sum\nolimits_{p = 1}^p {\left( {{x_{ip}} - {x_{jp}}} \right)} }^2}} \right]}^{1/2}}{I_{ik}}{I_{jk}}} } } } \right\}}}{{\sum\nolimits_{i = 1}^{{t_{\max }}} {{{\left[ {\sum\nolimits_{p = 1}^p {{{\left( {{x_{ip}} - {x_{jp}}} \right)}^2}} } \right]}^{1/2}}} }},\]
,

[TeX:] \[k = {t_{\min }},{t_{\min }} + 1,...,{t_{\max }}\]

[TeX:] \[{O_k} = \frac{{100\left\{ {\sum\nolimits_{k = 1}^K {\sum\nolimits_{j = 1}^n {\sum\nolimits_{i = 1}^n {{{\left[ {{{\sum\nolimits_{p = 1}^p {\left( {{x_{ip}} - {x_{jp}}} \right)} }^2}} \right]}^{1/2}}{I_{ik}}{I_{jk}}} } } } \right\}}}{{\sum\nolimits_{i = 1}^{{t_{\max }}} {\sum\nolimits_{j = 1}^n {\sum\nolimits_{i = 1}^n {{{\left[ {\sum\nolimits_{p = 1}^p {{{\left( {{x_{ip}} - {x_{jp}}} \right)}^2}} } \right]}^{1/2}}{I_{ik}}{I_{jk}}} } } }},\]
,

[TeX:] \[k = {t_{\min }},{t_{\min }} + 1,...,{t_{\max }} - 1.\]

where k is the number of identified groups, p is the number of the orthogonalised coefficients to calculate distances, tmin,tmaxtmin,tmax are the maximum and the minimum number of groups, Iik,Ijk is the indicator (binary), pointing to the presence (1) or absence (0) of TUs in group k.

A sharp increase in Ak or Ok with a decrease in the number of identifiable clusters, indicates the increase in heterogeneity within the identified clusters, while a smooth increase in the coefficients is a sign of uniform increase. The threshold followed by a sharp increase in heterogeneity can be taken optimally as the final number of clusters. In our analysis, the isolation of five clusters in all calculations turned out to be optimal (Author 1997).

As a result of the classification of cities and regions of Russia, five large groups (macro types) were identified for men and for women. At the same time, two macro types can be characterised as extremes – they included a very small number of regions (often only one region). The remaining macro types were too large for detailed analysis. Therefore, for the other three macro types, the classification algorithm was repeated separately for each, to distinguish subtypes.

Results

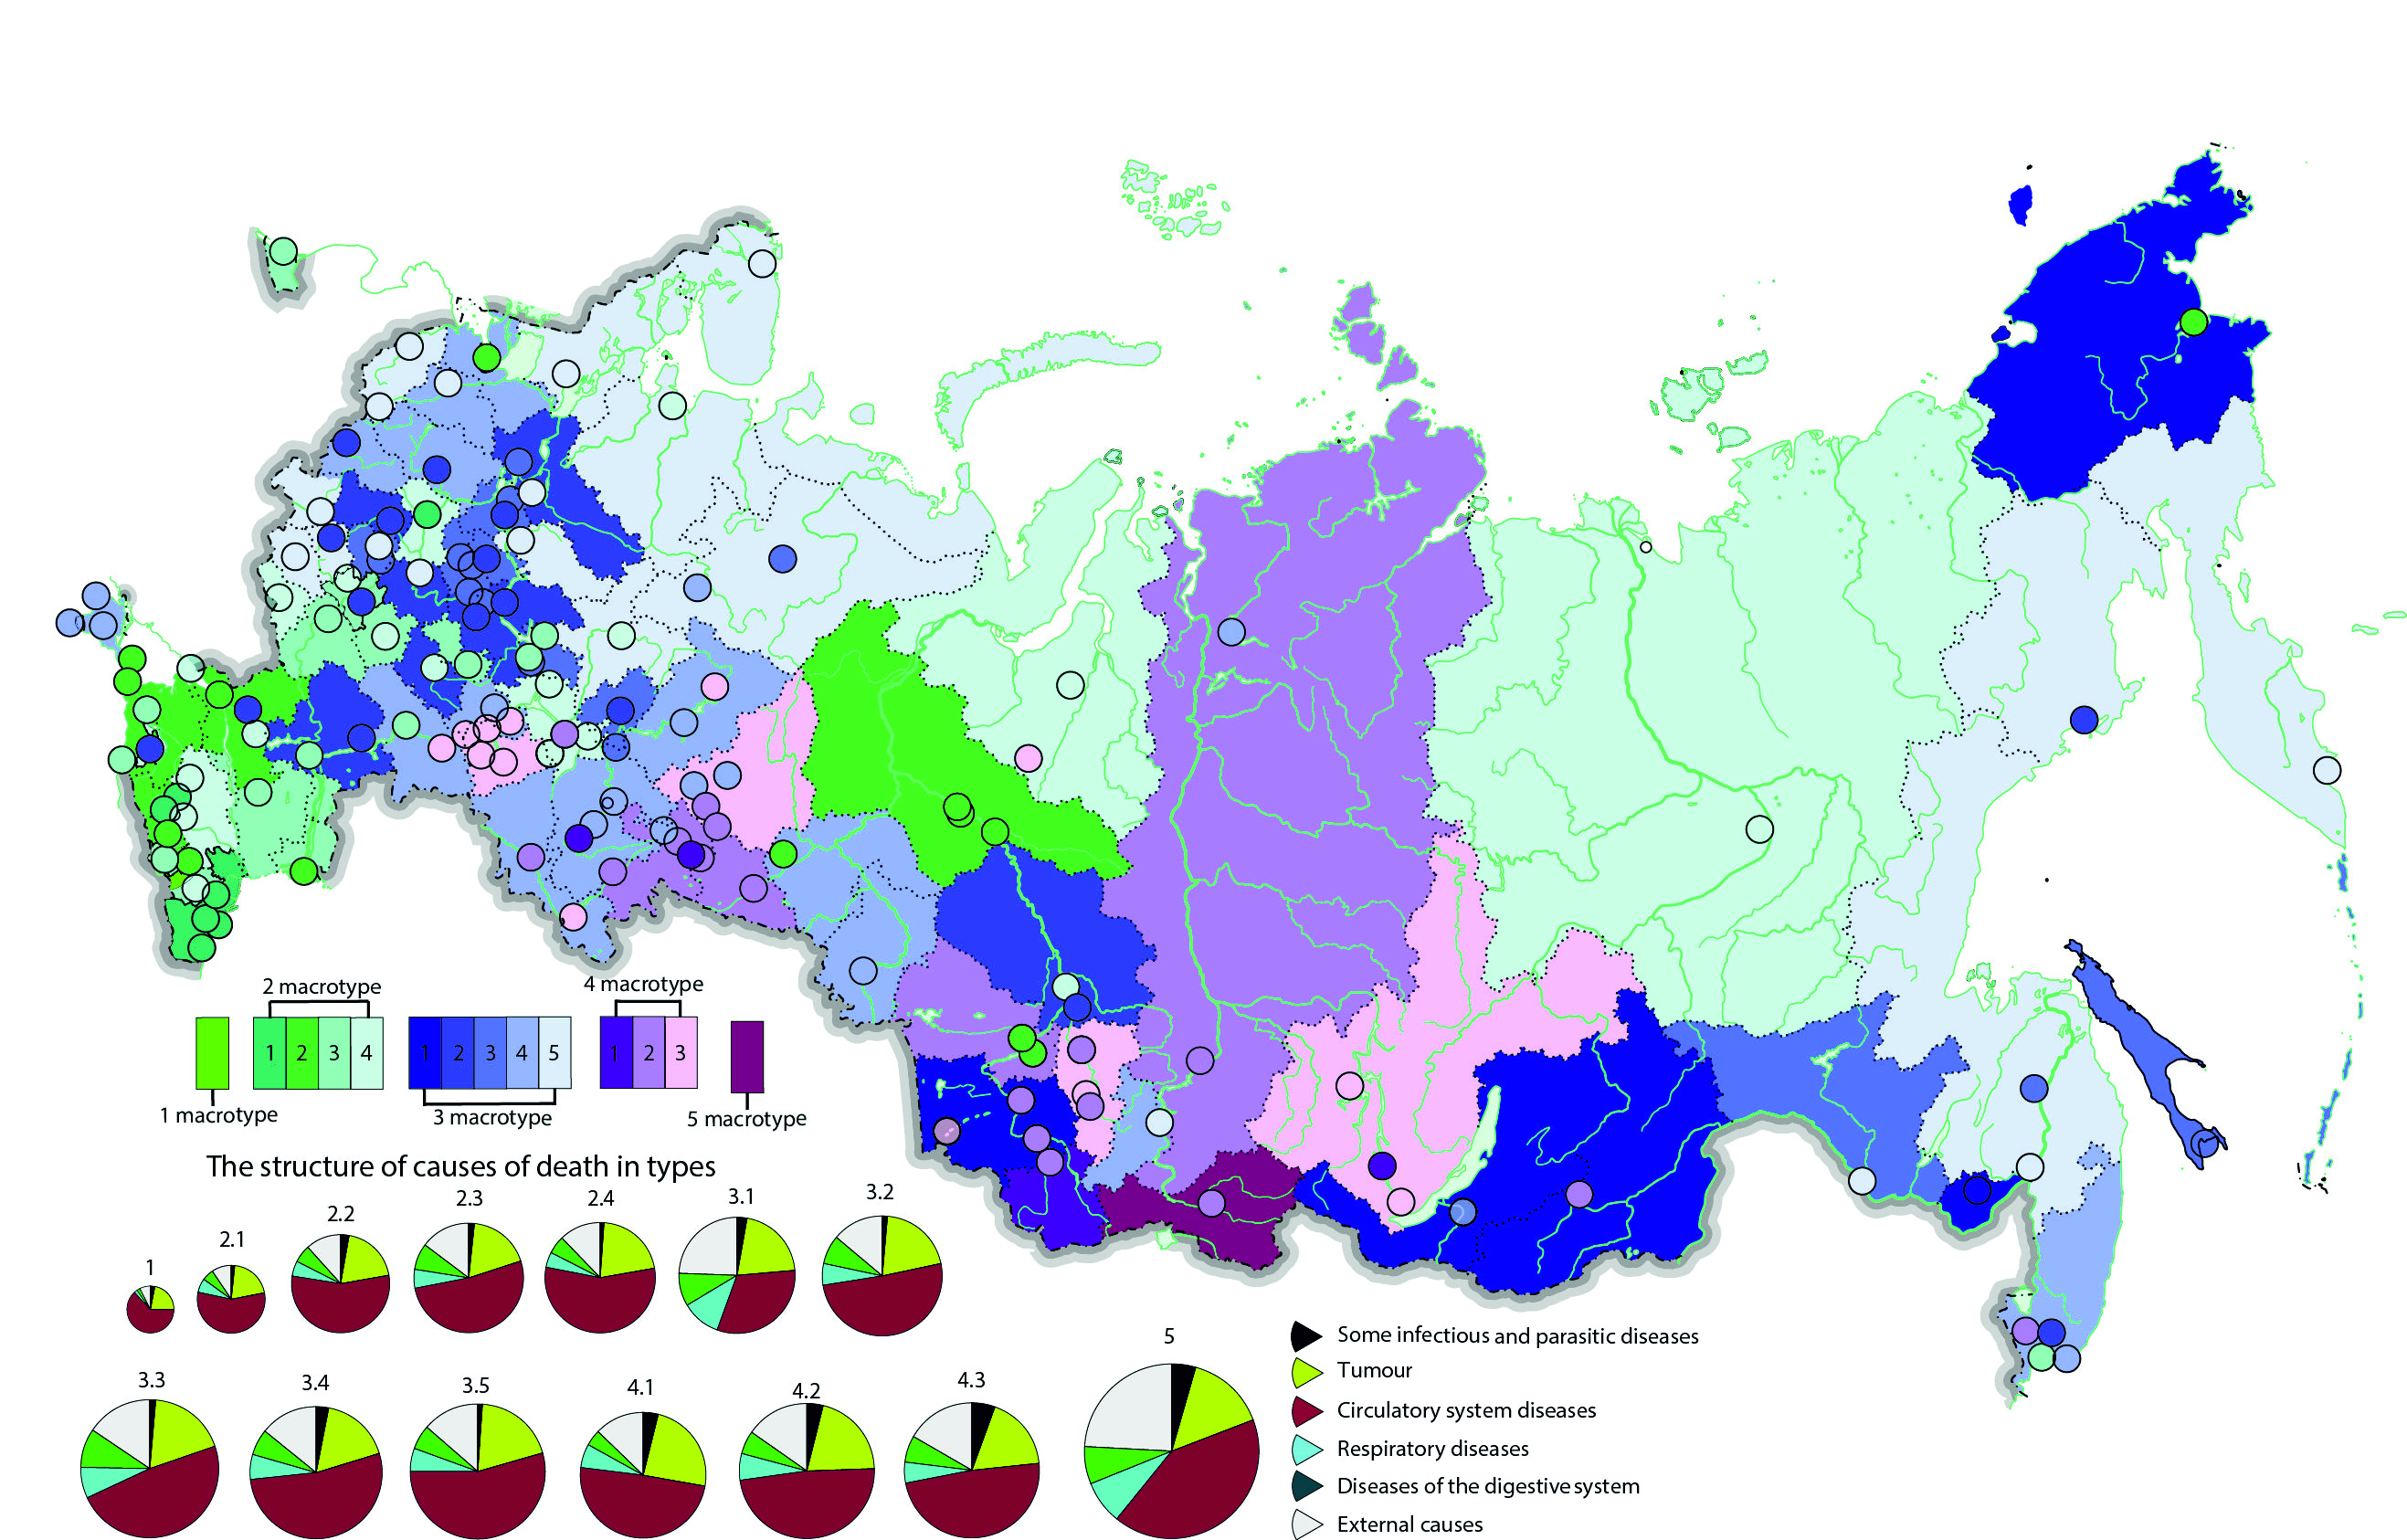
As a result of the two-stage classification of the causes of mortality in large cities and regions of Russia, 5 macro types were obtained for men and women. For men, 12 subtypes were distinguished, and 10 subtypes for women (Figs. 2 and (4). Based on the results obtained, maps were prepared (Figs. 3 and (5). Maps legends were made in different, but adjacent colours, to emphasise that the types for men and women were not the same, but that there were some general trends. For men, more shades of red were used to show that their level was worse than that of women. The size of the charts corresponded to the total mortality in the subgroups, for men and women on the same scale, which allowed them to be compared visually. Let us examine the situation among men and women separately in more detail.

Figure 2 Typology by classes of causes of death and average values of types, for males 2015 / Slika 2. Tipologija po klasama uzroka smrti i prosječnim vrijednostima vrsta, za muškarce 2015.
kig-19-64-g2.jpg
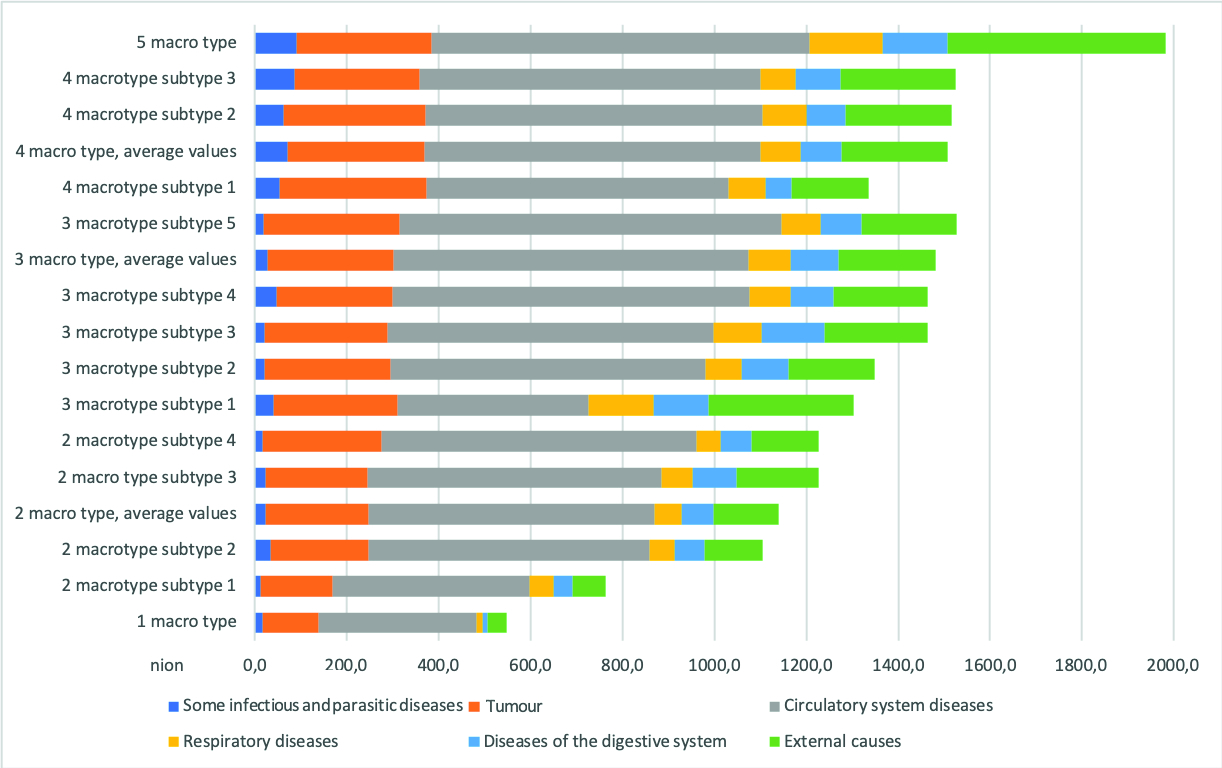
Figure 3 Typology by classes of causes of death, for males 2015 / Slika 3. Tipologija po razredima uzroka smrti za muškarce 2015.
kig-19-64-g3.jpg

As mentioned above, two macrotypes of male mortality can be attributed to extremes. Macrotype No1 is characterised by minimum mortality values for all analysed indicators and includes only one region, the Republic of Ingushetia. Macrotype No5, on the other hand, is a representative of the maximum mortality values for all indicators. It also includes only one region, the Republic of Tuva. This may be due to the actual situation in the regions and the peculiarities of collecting statistical material. An explanation of this issue requires a more detailed local study of these regions at the municipal district level.

Macrotype No2is generally low in all-male mortality indicators. Most regions of this macro type are in the central part of European Russia. They include primarily Moscow and the Moscow region, the Republic of Mordovia and Tatarstan. Outside European Russia, only the Yamal-Nenets, Khanty-Mansi Autonomous Okrug, and Republic of Yakutia belong to this macrotype. It is interesting to trace the internal heterogeneity of mortality rates in this macro type. According to the classification algorithm used, four subtypes can be distinguished, which combine 94 territorial units.

The first subtype is characterised by the lowest rates within the group for all the considered causes of death and includes the Republic of Dagestan with the cities of Derbent, Kaspiysk, Makhachkala, Khasavyurt, the cities of the Stavropol Territory (Essentuki and Kislovodsk) and the city of Moscow. The remaining three types, against the background of low mortality rates in general, are distinguished by slightly higher values for some reason.

The second subtype is specific for increased mortality from infectious diseases. Regions of this type are located mainly in the North Caucasus (Krasnodar Territory, Kabardino-Balkarian, Karachay-Cherkess, and Chechen Republics, Rostov Region), while the Khanty-Mansiysk District with all its major cities and the city of Anadyr belong to the same type.

The third subtype of macro type No2 is characterized by increased mortality from diseases of the respiratory system, digestive system, and external causes. It includes the Astrakhan region, the Republic of Kalmykia, Lipetsk, Tambov regions, and the Republic of Mordovia, as well as the Kaliningrad region. It should be noted that this group includes only one city in the Russian Far East – Vladivostok.

Despite a significant decrease in mortality from external causes over the past decade, this category remains one of the top causes of death in Russia. In comparison to other developed and emerging countries, Russia has a substantially higher level of external causes of death (Rybakovsky et al. 2017). In particular, this problem concerns premature deaths among the working age population. At the same time, there is a convergence between regions in terms of mortality from external causes, while the interregional divergence of trends is mainly determined by cardiovascular diseases (Timonin et al. 2017).

The mortality rates from homicide and suicide have shown a steady decline since the 2000s. Another group of causes of death, injuries of undetermined intent, is growing rapidly and since 2014 has exceeded the total mortality rate from homicides and suicides (Yumaguzin and Vinnik 2019).Repetskaya (2019) has shown that recorded homicides account for only 20% of actual homicides. As a result, the real data on homicides and suicides is underestimated. Mortality from ill-defined conditions in Russia also has the fastest rate of increase compared to all other major causes of death. Insufficient investigation of the circumstances of the deaths of socially isolated people contributes to trends observed in mortality from ill-defined conditions (Gavrilova et al. 2008). This can lead to the underestimation of mortality from external causes.

Traditionally, alcohol consumption is considered a risk factor for increased mortality from external causes in Russia (Brainerd and Cutler 2005). For example, Russia had more than ten times the rate of male alcohol-attributable premature deaths compared with Sweden (Rehm et al. 2007). Despite the decline in alcohol-related mortality, alcohol is still the leading cause of the high risk of premature death among Russian adults (Zaridze et al. 2014). This risk factor is characterised by significant fluctuations over time. For example, the strongest negative correlation between changes in life expectancy and alcohol poisoning was found between 1984 and 2003. From 2003 to 2017, a consistent positive life expectancy trend was statistically independent of alcohol poisoning (Danilova et al. 2020). Hot spots of alcohol-related mortality mainly located in the territories of north-western and western Russia (Grigoriev et al. 2020). Despite the positive trends, these changes have not yet been sufficient to change radically the situation regarding external causes of death.

The fourth subtype is characterised by increased mortality from tumours and diseases of the circulatory system. It includes the Stavropol Territory with the cities of Stavropol and Pyatigorsk, and the Moscow Region with the cities nearest to the capital – Korolev, Mytishchi, Odintsovo, Podolsk and Ramenskoye. Of the remaining regions of the Russian Federation, only five regions belong to this subtype: the Republic of Adygea and the Belgorod region (with Belgorod and Stary Oskol), the Republic of Tatarstan (with Kazan, Naberezhnye Chelny, Nizhnekamsk), the Yamalo-Nenets Autonomous Okrug, and the Republic of Sakha. In addition, some cities in the southern regions are attributed to this type: Grozny, Volgodonsk and Taganrog. The only northern city of this type is Severodvinsk in the Arkhangelsk region, and the most eastern cities are Novy Urengoy, Yakutsk and Seversk in Tomsk region.

The macrotypes No3 and No4are generally close in terms of their average mortality rates, which is quite high. However, macrotype No4 is sharply distinguished by a higher mortality rate from infectious diseases (if we exclude the values of macrotype No5, these are the maximum mortality values for the entire sample). This is most clearly demonstrated in the third subtype, which includes three regions of the Urals and Siberia: Sverdlovsk, Irkutsk region (including the cities of Irkutsk and Bratsk) and Kemerovo region (including the city of Prokopyevsk), as well as one part of the Volga region – Samara (including Samara, Novokuybyshevsk, Syzran and Tolyatti). This corresponds quite well to the distribution of mortality from tuberculosis, one of the main causes of death from infectious diseases in the territory of the Russian Federation. The first subtype of macro type No4 is distinguished by the highest mortality rates from tumours among all the selected groups. Only the Altai Territory and the cities of Chelyabinsk, Salavat (Republic of Bashkiria), Noyabrsk (Yamalo-Nenets Autonomous Area), and Angarsk (Irkutsk Region) belong to it. This macro type includes other Ural (Chelyabinsk and Kurgan regions) and Siberian (Novosibirsk region and Krasnoyarsk Territory) regions. In general, this is a fairly small macro type in composition, uniting only 43 analysed administrative units, predominantly the regions and cities of the Urals and Siberia.

Macrotype No3 is the most differentiated: in total, five subtypes were distinguished. Of greatest interest is its first subtype, characterised by high mortality from respiratory diseases and external causes. It includes the Jewish Autonomous Region with Birobidzhan, Trans-Baikal Territory, the Altai Republic, Buryatia, and the Chukotka Autonomous Region.

Next, the fifth subtype should be distinguished, characterised by high mortality from diseases of the circulatory system and uniting the regions and cities of the European North (Arkhangelsk, Kostroma, Murmansk, Pskov regions, Nenets Autonomous Okrug, the Republic of Karelia and Komi) and the Russian Far East (Kamchatka, Khabarovsk Territory and the Magadan region).

Finally, the third subtype is characterised by high rates of mortality from diseases of the digestive system, also uniting the regions and cities of European Russia (Yaroslavl, Vladimir, Ivanovo, Tula regions, the Republic of Mari El, Udmurtia and Chuvash) and the Russian Far East (Amur and Sakhalin regions).

In general, it can be noted that macrotype No3 includes regions characterised by the most unfavourable situation in terms of mortality for almost all the reasons analysed, except mortality from infectious diseases. This is the most prevalent macro type and covers 116 analysed cities and regions.

It is interesting to note that macro types No2 and No4 are mainly characterised by the coincidence of the current mortality situation in the region and its cities. However, there are exceptions. So, the Moscow region is distinguished by significant spatial differentiation.

The difference in mortality between cities and regions is more noticeable in macro type No3. A striking example is Primorsky Krai, where the nearby cities of Artem, Ussuriysk, Nakhodka, and Vladivostok belong to completely different types of mortality.

Next, we consider the situation with mortality among women. Here we can distinguish only one macro type related to extrema. This is macrotype No5, where extremely high mortality rates from all the causes considered are recorded. Again, this macro type includes only one region – the Republic of Tuva.

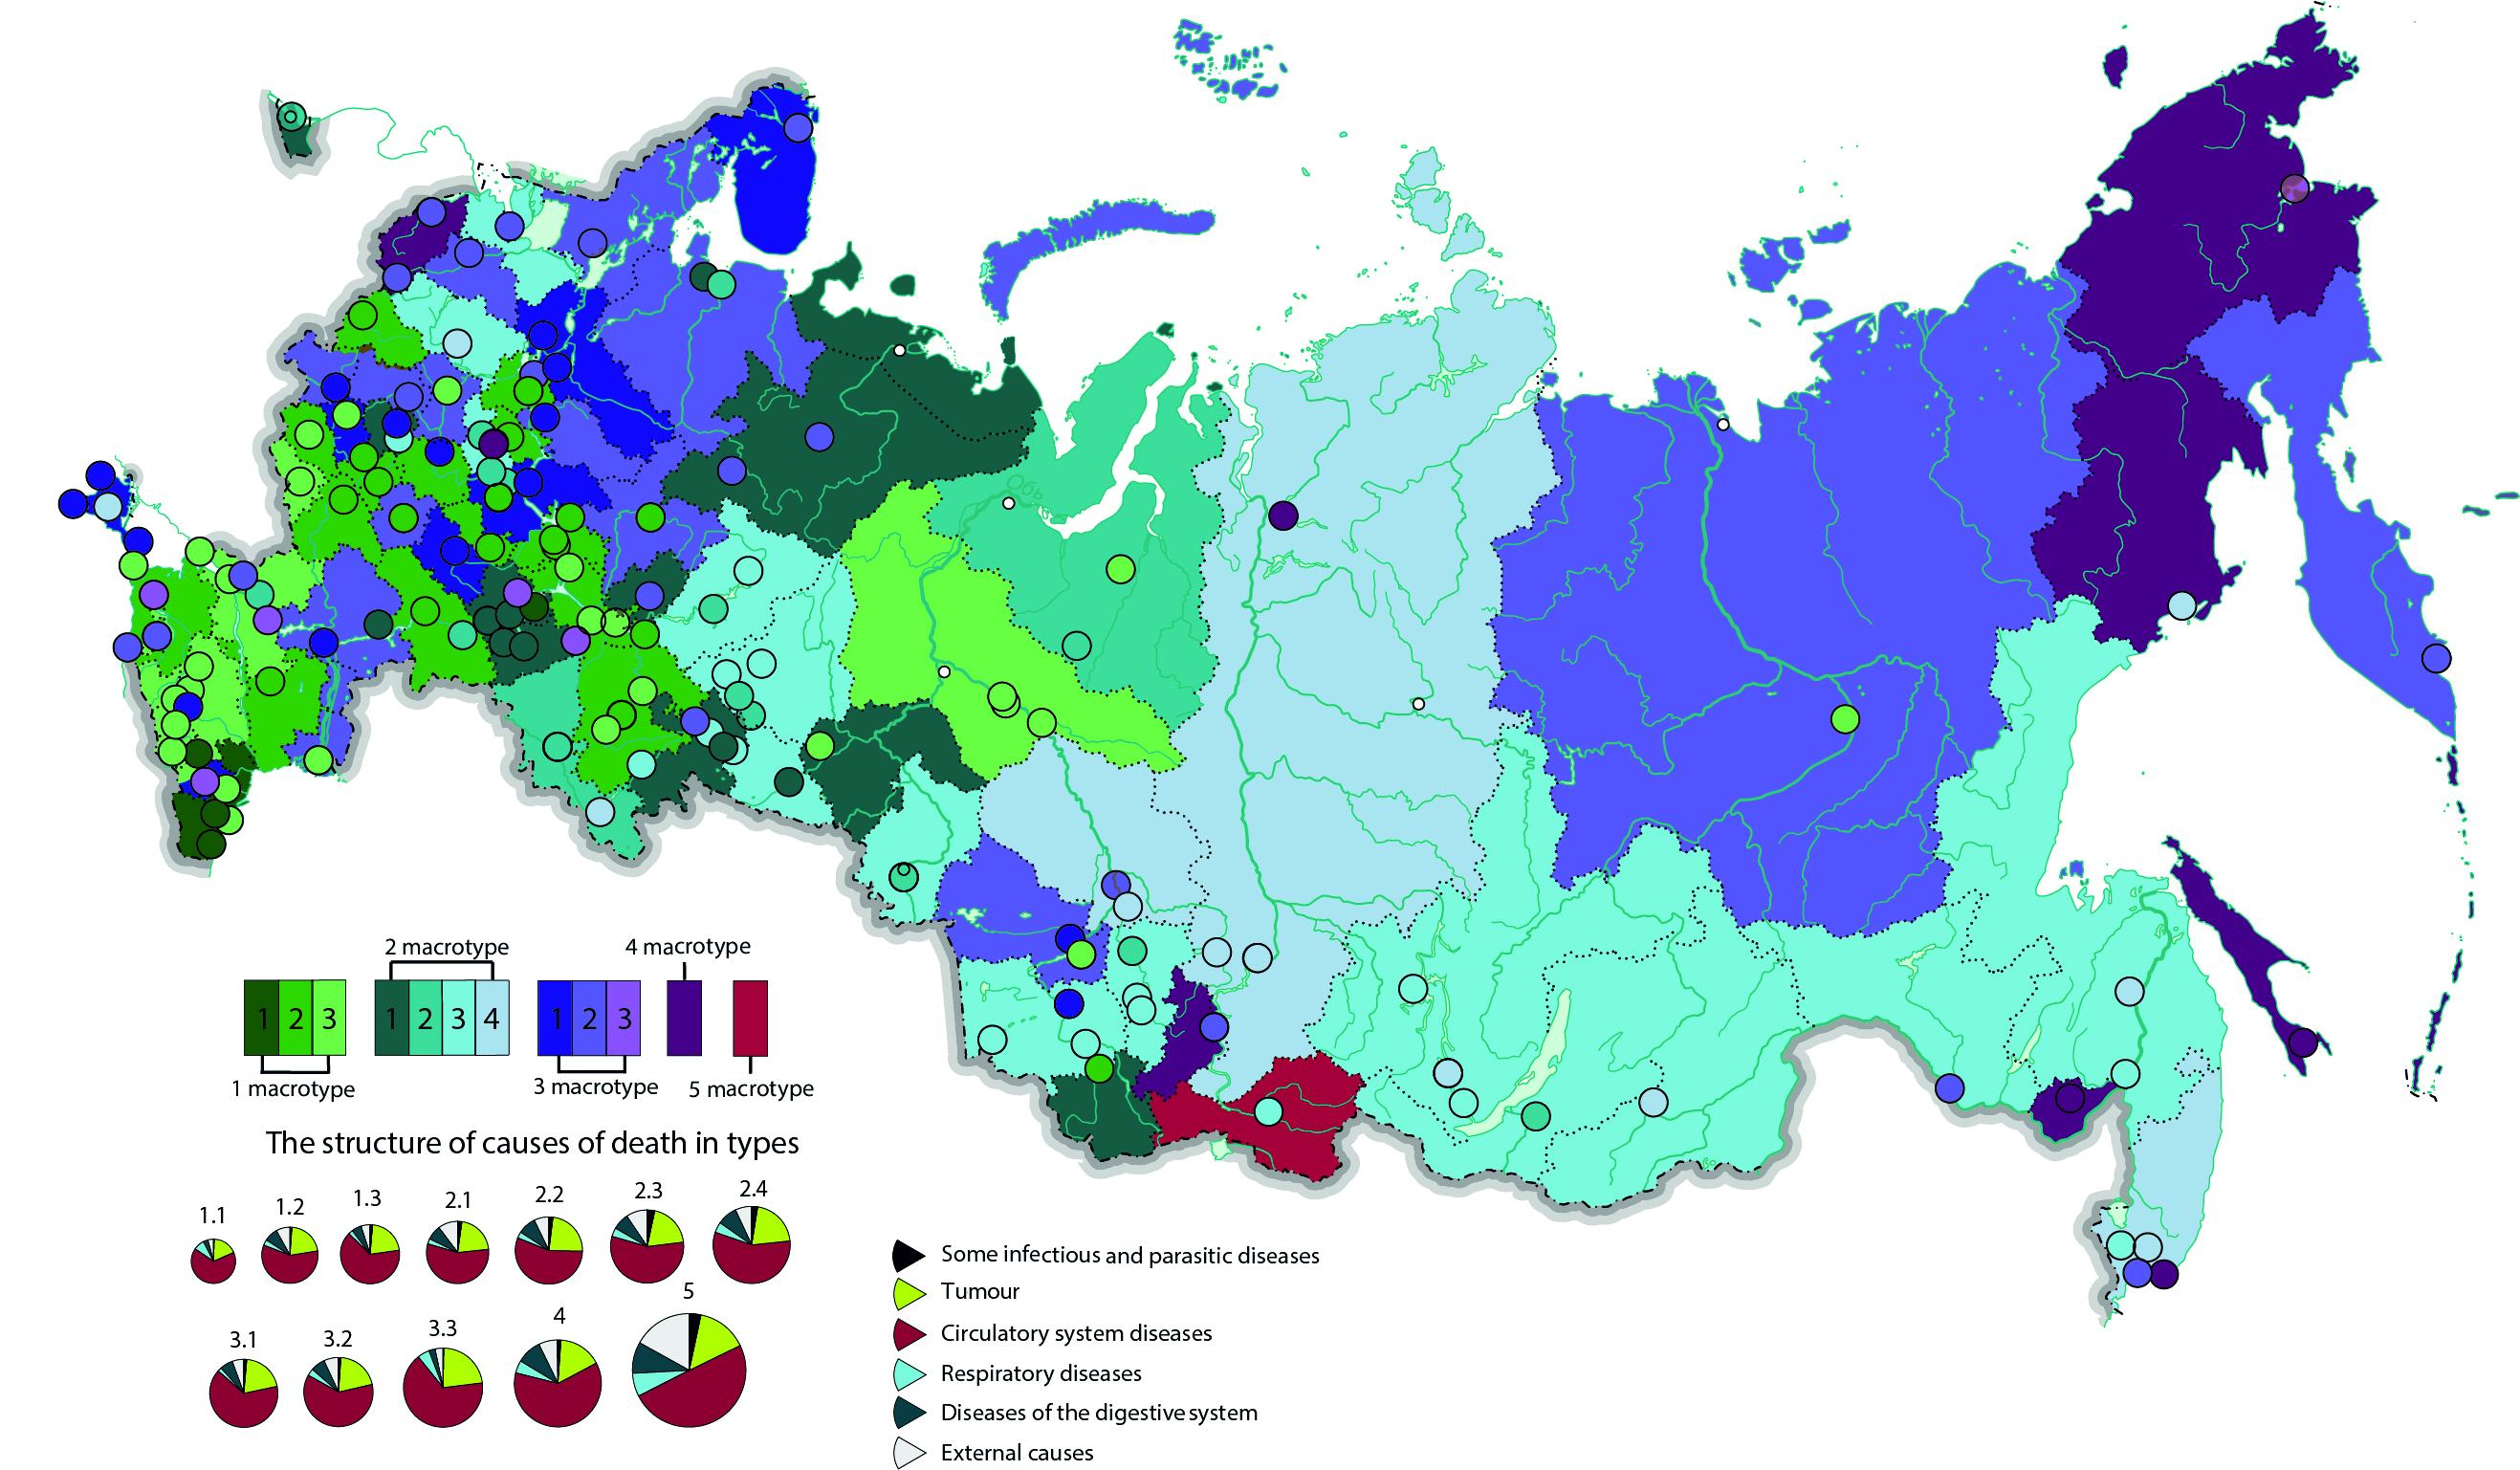
Figure 4 Typology by classes of causes of death and average values of types, for females 2015 / Slika 4. Tipologija po klasama uzroka smrti i prosječnim vrijednostima vrsta, za žene 2015.
kig-19-64-g4.jpg
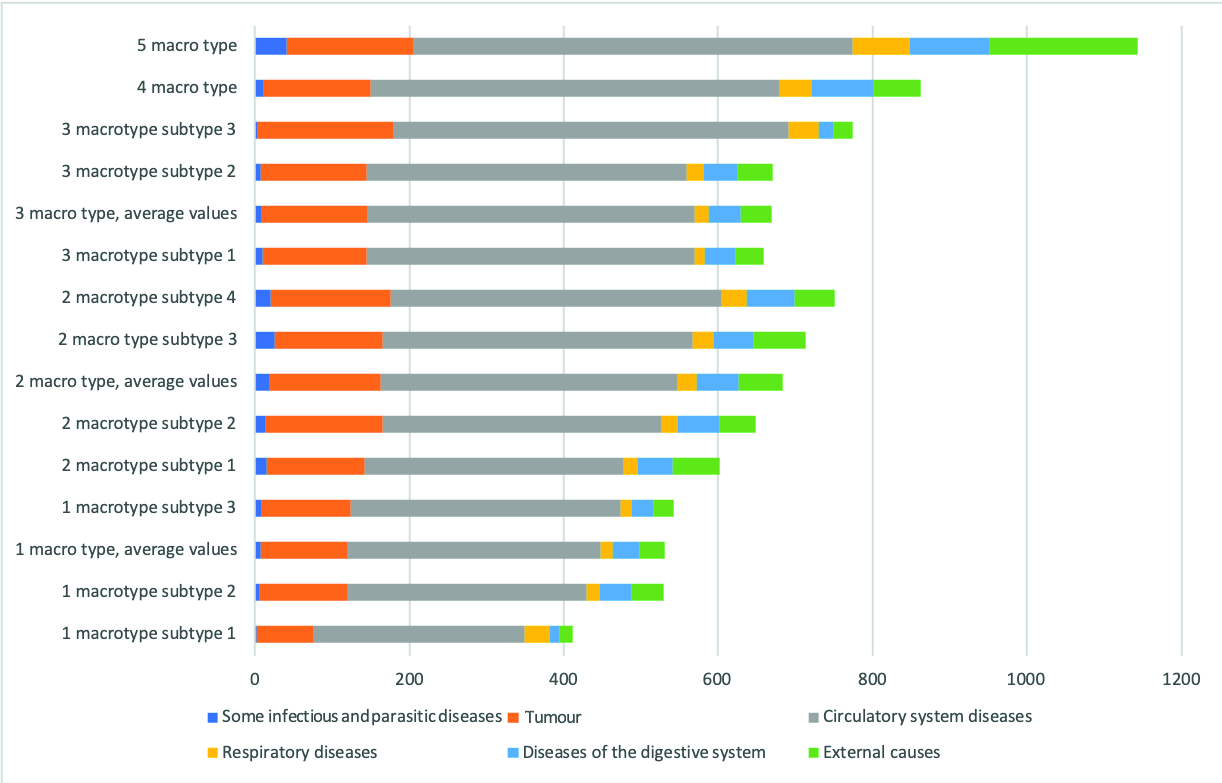
Figure 5 Typology by classes of causes of death, for females 2015 / Slika 5. Tipologija po razredima uzroka smrti, za žene 2015.
kig-19-64-g5.jpg

Macrotype No1 unites the regions and cities with the lowest female mortality for all reasons. The first subtype of this macrotype is noteworthy, because it is characterised by minimal mortality rates for all reasons and increased mortality from respiratory diseases. This type includes only the Republic of Dagestan with the cities of Makhachkala and Derbent, and the city of Nazran (Republic of Ingushetia).

The second and third subtypes of macro type 1 form two equal groups according to the number of territorial objects included (42 and 41, respectively). The second subtype is characterised by slightly higher mortality rates from diseases of the digestive system and external causes. It includes only cities and regions of the European part, stretching from the Republic of Kalmykia and the Krasnodar Territory to the Smolensk and Yaroslavl Regions in the north and the Republic of Bashkortostan in the east. In general, macrotype No1 is characterised by territorial confinement to the European part of the Russian Federation. Beyond it, low mortality rates are observed only in the regions of oil and gas production and in some large cities.

The third subtype, besides the background of low mortality rates, is characterised by a predominance of mortality from tumours and diseases of the circulatory system. These are the republics of the North Caucasus - Ingushetia, Kabardino-Balkar, Karachay-Cherkess, North Ossetia and Adygea, and the Stavropol Territory and Rostov Region. The Belgorod region with the city of Belgorod, the region that should probably be recognised as the most prominent in terms of mortality among women among the European regions of the Russian Federation, as well as the oil and gas production region, the Khanty-Mansi Autonomous Okrug, with all its major cities and the city of Tyumen, belong to the same type. Many cities in the European part of the Russian Federation belong to this type; not only the cities of the North Caucasus but also the southern European part (Astrakhan and Taganrog), the Volga region (Kazan, NaberezhnyeChelny and Nizhnekamsk), and Moscow with adjacent Balashikha and Korolev. It should be noted that some cities have severe climatic conditions - NovyUrengoy and Yakutsk.

Macro types No2 and No3 combine territorial groups with predominantly high mortality rates. Moreover, they are very close to each other in terms of mortality from tumours, diseases of the circulatory system, and respiratory diseases, but differ from each other in mortality from infectious diseases, digestive diseases, and external causes. Macrotype No3 is distinguished by rather low mortality from infectious diseases and lower mortality from diseases of the digestive system and external causes than macrotype No2.

The first subtype of macrotype No3 is characterized by low mortality rates from respiratory diseases against the background of rather high mortality rates from tumours and diseases of the circulatory system and includes 31 subjects. These are the regions within the European part of the Russian Federation - Vologda, Murmansk, Nizhny Novgorod, Oryol, Ulyanovsk Regions, and the Republics of Chechen and Crimea. Among the cities belonging to this type outside European Russia, Barnaul and Novosibirsk should be noted.

The second subtype includes a slightly larger number of subjects (38) characterised by a rather high mortality rate from diseases of the digestive system and external causes. These are not only European regions, but also the territories of Siberia and the Russian Far East – Novosibirsk Region, the Republic of Yakutia, Kamchatka Territory, and Petropavlovsk-Kamchatsky. St. Petersburg and many cities in the Moscow region (Domodedovo, Kolomna, Mytishchi, Noginsk and Odintsovo) and the Russian Far East (Blagoveshchensk and Vladivostok) should be noted.

The third subtype of macro type No3 includes only three cities – Grozny, Krasnodar, and Anadyr. In terms of mortality from tumours, circulatory system diseases, and respiratory diseases, this subtype is close to macro type No4, characterised by high mortality rates from all causes. However, lower mortality rates from infectious diseases, diseases of the digestive system, and external causes do not allow it to be attributed to this macro type.

In macrotype No2, the fourth subtype (high mortality rates from tumours, circulatory system diseases, respiratory and digestive organs) includes four regions that are not geographically related to each other (Vladimir, Tomsk Regions, Krasnoyarsk and Primorsky Territories) and 15 cities. These are many industrial cities (Achinsk, Angarsk and Krasnoyarsk), cities with severe climatic conditions (Magadan and Chita), and also the cities of the Moscow region (Orekhovo-Zuevo, Pushkino, Sergiev-Posad and Schelkovo), as well as Simferopol (Republic of Crimea). This type, along with macrotype No4, can be described as the most unfavourable in terms of mortality among women.

It is interesting to note that the third subtype, macro type No2, is characterised by a high mortality rate from infectious diseases and external causes. It is confined mainly to the territory of Siberia (Trans-Baikal Territory, Irkutsk (including Irkutsk, Bratsk), Kemerovo (including Novokuznetsk, Prokopyevsk), Omsk Region, Altai Republic and Buryatia), the Urals (Kurgan, Sverdlovsk Region (including Nizhny Tagil, Pervouralsk), and the cities of the Chelyabinsk region – Kopeisk, Magnitogorsk, Miass) and the Far East (Amur Region, the cities of Ussuriysk and Khabarovsk), but territories belonging to this type are also found in the European part of the country – the Leningrad, Tver, and Perm regions.

Macrotype No4 is characterized by high mortality rates for all analysed parameters (especially diseases of the circulatory system, respiratory system, and digestive system); the exception is mortality from infectious diseases. First, the Russian Far Eastern regions and cities are distinguished – Chukotka Autonomous Okrug, Magadan Oblast, Sakhalin Oblast, including Yuzhno-Sakhalinsk, Jewish Autonomous Oblast, including Birobidzhan, and also the city of Nakhodka, Primorsky Krai. In the Siberian regions, the Republic of Khakassia and the city of Norilsk should be attributed to the same macrotype, while in the European ones, only the Pskov region is included.

As among men, female mortality in most cities and regions of the Russian Federation is characterised by high rates. Territories with low mortality are traditionally primarily the regions of the North Caucasus. However, in the case of female mortality, this rule is not always applicable.

Unlike many high-income countries, Russia has yet to make an epidemiological transition and control mortality from cardiovascular diseases. Ischemic heart disease and cerebrovascular diseases are still the leading causes of death in all regions of Russia.

As for cancer, positive trends are associated with a decrease in mortality from lung cancer. This may be due to both a change in lifestyle (the reduction in the number of people using tobacco) and a change in the quality of tobacco products (the reduction of tar in cigarettes). The temporal patterns of breast cancer mortality in Russia are in line with other countries in Europe, although cervical cancer rates and the rate of occurrence in recent generations are rapidly increasing (Barchuk et al. 2018). The association between suicide and cancer presents a significant problem and can be considered as an indicator of social disintegration. There is a positive relationship between trends in suicides and all types of cancer in men and women, apart from cancer of the small intestine and prostate cancer in men (Razvodovsky and Zotov 2016). The real occurrence of suicide in cancer patients is considered to be under-reported (Razvodovsky 2017).

Regional differences in causes of death can be influenced by lifestyles that are difficult to consider at the national level due to significant cultural differences and income levels. Regional practices for coding causes of death can also significantly distort the structure of mortality.

Conclusion

The situation concerning male mortality in the country as a whole can be described as unfavourable, since the vast majority of cities and regions are included in groups with high mortality rates (macro types No3 and No4).

As a result of the classification, compact groups of cities and regions are distinguished quite well, characterised by specific situations in terms of mortality. So, we can distinguish the group of the North Caucasus, the southern group, and the Ural-Siberian groups of cities and regions. At the same time, this classification makes it possible to single out individual regions with a highly differentiated intraregional mortality situation, for example, the Moscow Region and the Primorsky Territory.

It is also interesting that the classification revealed a certain homogeneity in the unfavourable mortality situation between cities and regions of European Russia (mainly the north) and the Russian Far East. They are distinguished by high mortality rates from diseases of the circulatory system and digestive organs.

It is difficult to judge the cause-effect relationships that determine a particular situation by mortality. So, for men, macrotype No2is common to cities and regions with rather low mortality rates for all reasons, but is different in terms of their socio-economic development, environmental status, and environmental conditions. Low mortality rates are probably determined not by one single factor for all regions, but by separate factors in each case.

When conducting a typological classification of mortality among women, less distinct territorial groups are distinguished compared with men. Even though territories with a low mortality rate also mainly belong to the regions of the North Caucasus, there are exceptions (for example, the Chechen Republic and the city of Grozny). At the same time, several regions are quite stable in terms of mortality among men and women. First, the Republic of Tuva is confirmed as a region with extremely high mortality rates among both men and women. To the same extent, this applies to the disadvantaged cities of the Moscow region – Orekhovo-Zuevo, Pushkino, Sergiev-Posad and Schelkovo. However, the spatial picture of women's mortality does not always coincide with the distribution of mortality rates among men, which is most pronounced in St. Petersburg, where there is a high mortality rate among men and a low one among women.

Another feature of the distribution of mortality among women is often a different picture of mortality in cities and regions, which was much less frequently observed in the analysis of male mortality. For example, the unfavourable situation in the Tyumen region is countered by a better situation in the city of Tyumen. A similarly pattern is seen in the Republic of Yakutia and Yakutsk, the Astrakhan region and Astrakhan, and elsewhere.


Uvod

Do danas su mnoga istraživanja pokazala trajne ili rastuće nejednakosti u pokazateljima javnoga zdravlja između gornjih i donjih socioekonomskih skupina, između zemalja i unutar njih (Mackenbach i sur. 2015,Autor 2016,Mackenbach i sur. 2008). U pravilu, ljudi s nižom razinom obrazovanja ili nižom stručnom spremom i primanjima umiru u mlađoj dobi. U tim je populacijskim skupinama prevalencija bolesti i ozljeda znatno veća (World Health Organization 2008,Mackenbach 2006). Iako je Rusija posljednjih godina karakterizirana smanjenjem stope smrtnosti za gotovo sve glavne klase uzroka smrti (s izuzetkom tumora), problemi velikih prostornih nejednakosti u javnom zdravstvu (16 godina između najvišeg i najnižeg regionalnog pokazatelja očekivanog trajanja života), razlike u spolu (u 2016. je razlika između očekivanog životnog vijeka muškaraca i žena bila 10,5 godina) i razlike između skupina s različitim stupnjem obrazovanja (Shkolnikov i sur. 2004) među najvišima su na svijetu. S trenutnim ekonomskim životnim standardom u Rusiji očekivano trajanje života može biti znatno veće, a nejednakost manja. U 2015. godini trajanje života i za Rusiju i za Moskvu bilo je niže od očekivanja na osnovu Prestonove krivulje za 6,5, odnosno 4,9 godina (Shkolnikov i sur. 2019). Višnjevski, Andrejev i Timonin smatraju da je visoka prijevremena smrtnost od bolesti krvožilnog sustava (Vishnevsky i sur. 2016) i njezina dugotrajna nepovoljna dinamika jedan od glavnih razloga zbog kojega Rusija zaostaje za ostalim razvijenim zemljama u pogledu očekivanog trajanja života. Još je jedan čimbenik kratkoće očekivanog trajanja života u usporedbi sa zemljama sa sličnom razinom BDP-a po stanovniku - visoka smrtnost od vanjskih uzroka radno sposobnog stanovništva (Shkolnikov i sur. 2019).

S tim u vezi, proučavanje regionalne nejednakosti u uzrocima smrti hitan je zadatak. Svrha je ove studije bolje razumjeti regionalne obrasce smrtnosti u Rusiji analizom međuregionalne nejednakosti smrtnosti u zemlji i sastavljanjem odgovarajuće matematičke klasifikacije. To će istaknuti vodeće regionalne čimbenike koji pogoršavaju prostornu nejednakost u javnom zdravstvu u Rusiji.

Metode

Procjena je provedena s pomoću procijenjenih klasifikacija prema demografskim pokazateljima. Studija se temelji na podatcima o stopama smrtnosti objavljenima u publikacijama „Regije Rusije“ i „Demografski godišnjak Rusije“ Federalne državne službe za statistiku (Rosstat).

Baza podataka gradova Ruske Federacije za razdoblje 2011–2015 izrađena je prema podatcima koje je Rosstat dostavio na zahtjev. Skup podataka obuhvaćao je 250 teritorijalnih jedinica: 85 regija (uključujući gradove od saveznog značaja) i 165 velikih gradova s populacijom većom od 100 000 (slika 1). Podatci o gradovima nisu isključeni iz regionalne statistike. To je učinjeno namjerno jer analiza nije provedena za sve gradove, već samo za neke od najvećih, što ne bi dalo jasnu sliku urbanog / ruralnog stanovništva.

Odabir pokazatelja za bazu podataka proveden je na temelju desete revizije Međunarodne klasifikacije bolesti (International Classification of Diseases – ICD-10). Ukupno je analizirano 306 uzroka smrti, uključujući klase bolesti prema ICD-10 i pojedinačne nozološke cjeline. Slijedom toga, odabrano je i u bazu podataka uključeno 140 uzroka smrti. Oni su bili od iznimne važnosti u provođenju medicinsko-geografske analize zdravstvenog stanja gradskog stanovništva.

Na temelju primarne statistike, a koristeći europsku normu Svjetske zdravstvene organizacije iz 1975. godine, izračunane su normirane stope smrtnosti. Upotrijebljena je izravna metoda standardizacije (Practical demography 2005,Denisenko i sur. 2009). Da bi se odredili izvedeni pokazatelji, razvijen je algoritam za automatizirano računanje standardiziranih medicinsko-demografskih pokazatelja s pomoću MS VisualFoxPro 9.0 DBMS-a. Razvijeni program omogućuje odabir željene kombinacije (godina, uzrok smrti, dobna skupina, spol itd.) i naknadni izlaz MS Excel tablica koje sadrže dobnu stopu smrtnosti, standardiziranu stopu smrtnosti, donju i gornju granicu pouzdanosti, interval i duljinu intervala pouzdanosti.

Dakle, obrada primarnog materijala omogućila nam je dobivanje podataka koji predstavljaju dobni sastav stanovništva u petogodišnjim skupinama, smrtnost iz razloga koji odgovaraju klasama bolesti prema ICD-10 i nekoliko patologija za muškarce i žene odvojeno.

U primijenjenom tipološkom algoritmu, cjelokupni se skup parametara za bilo koju teritorijalnu jedinicu (TU) označava s X={x1,…,xN}, gdje je xi -ti TU, N broj TU-ova. Početne su TU predstavljene u obliku matrice TU-znakova koja odražava mjerenje pokazatelja na TU i sadrži retke i stupce:

[TeX:] \[X = \left( {\begin{array}{*{20}{c}} {{x_1}}\\ \cdots \\ {{x_N}} \end{array}} \right) = \left( {{x^{(1)}},{\rm{ }}...{\rm{ , }}{x^{(M)}}} \right) = \left( {\begin{array}{*{20}{c}} {x_1^{(1)}}&{ \cdots {\rm{ }}x_1^{(j)}}& \cdots &{x_1^{(M)}}\\ \cdots &{ \cdots {\rm{ }} \cdots }& \cdots & \cdots \\ {x_{N - 1}^{(1)}}&{ \cdots {\rm{ }}x_{N - 1}^{(j)}}& \cdots &{x_{N - 1}^{(M)}}\\ {x_N^{(1)}}&{ \cdots {\rm{ }}x_N^{(j)}}& \cdots &{x_N^{(M)}} \end{array}} \right),\]
,

gdje

  1. [TeX:] \[{x_i} = \left( {x_i^{(1)},{\rm{ }}...,{\rm{ }}x_i^{(M)}} \right)\]
    -i -ti TU u M- dimenzionalnom prostoru parametara

  2. [TeX:] \[{x^{\left( j \right)}}\]
    - j -ti parametar,
    [TeX:] \[{x^{\left( j \right)}} = \left( {x_1^{\left( j \right)},{\rm{ }}...{\rm{, }}x_N^{\left( j \right)}} \right),\]
    ,

  3. [TeX:] \[x_i^{^{\left( j \right)}}\]
    - vrijednost j -tog parametra i -te TU,

  4. [TeX:] \[i \in \left\{ {1,...,} \right.\left. N \right\},{\rm{ }}j \in \left\{ {1,...,} \right.\left. M \right\}.\]
    .

Sljedeća faza klasifikacije TU-ova je predradnja koja uključuje normalizaciju, određivanje težina i smanjenje dimenzionalnosti. Normalizacija je provedena prema varijanci i matematičkom očekivanju. Svrha normalizacije bila je dovesti svaki pokazatelj u standardni oblik (kao rezultat, matematičko očekivanje bilo kojeg pokazatelja postaje jednako nuli, a varijanca jednaka jedinici). Neka je:

  1. [TeX:] \[{\overline x ^{(j)}} = \frac{1}{N}\sum\nolimits_{i = 1}^N {x_j^{(i)}} \]
    - procjena matematičkog j -tog parametra, a

  2. [TeX:] \[var\left( {{x^{(j)}}} \right) = \frac{1}{N}\sum\nolimits_{i = 1}^N {(x_j^{(j)}} - {\overline x ^{(j)}})\]
    - procjena varijance j -tog parametra.

Normalizacija znači ponovno računanje

[TeX:] \[x_i^{(j)} = \frac{{x_i^{(j)} - {{\overline x }^{(j)}}}}{{\sqrt {{\mathop{\rm var}} ({x^{(j)}})} }}\forall j \in \left\{ {\left. {1,{\rm{ }}...{\rm{, }}M} \right\}} \right.,i \in \left\{ {\left. {1,{\rm{ }}...{\rm{, }}N} \right\}} \right.\]
, tj.

[TeX:] \[{\Delta _1} = {\overline x ^{(j)}},{\rm{ }}{\Delta _1} = \sqrt {var\left( {{x^{(j)}}} \right)} \]

Sljedeći korak uključuje primjenu metode glavne komponente. Ta metoda rješava problem pretraživanja na temelju postojećeg sustava atributa koji opisuju TU-ove. Metodu glavnih komponenata treba koristiti za ispravljanje izvornog prostora značajki iskrivljenog međusobnim korelacijama, smanjenje količine pohranjenih podataka bez gubitka značajnog dijela podataka o TU-ovima, vizualizaciju TU-ova u prostoru značajki (na primjer, prikazivanjem TU-ova u obliku točaka u ravnini) i otkrivaju skrivene pokazatelje koji odražavaju bit procesa ili pojave.

Najjednostavnija je geometrijska interpretacija metode glavnih komponenata. U višedimenzionalnom prostoru parametara TU-ovi se smatraju točkama čiji geometrijski raspored oblaka, u slučaju normalne raspodjele, nalikuje M-dimenzionalnom elipsoidu. Glavne se osi zamišljenog elipsoida tretiraju kao novi parametri poredani silaznim redoslijedom disperzije TU-ova uzduž osi.

Najopćenitiji se odnos koristi za računanje udaljenosti za M kvantitativnih parametara:

[TeX:] \[{d_e}\left( {{x_i},{x_j}} \right) = \sqrt {{{\sum\nolimits_{x = 1}^M {\left( {x_i^{(x)} - x_j^{(x)}} \right)} }^2}} .\]

Cilj je naših klasifikacija bio dobiti homogene skupine TU-ova u M-dimenzionalnom prostoru atributa, tj. moguće "tipove" TU-ova. Za to je odabrana najveća od dobivenih euklidskih udaljenosti, a dvije su teritorijalne jedinice koje je povezao postale jezgre homogenih nakupina. Klasteri su nastali raspodjelom preostalih teritorija između dviju jezgri prema minimalnim euklidskim udaljenostima. U slučaju dodjele većeg broja klastera, za određivanje treće jezgre i svih sljedećih, svaka je preostala teritorijalna jedinica zamijenjena u obliku jezgre, a ostatak raspodijeljen između triju jezgri prema minimalnoj udaljenosti. Postupak za određivanje četvrte jezgre i formiranje tipologije s četirima tipovima bio je sličan prethodno opisanom, do maksimalno moguće vrijednosti naznačene unaprijed tmax, i slično minimalnoj vrijednosti tmin.

Rezultirajući se broj grupiranja može analizirati apsolutnim i relativnim koeficijentima heterogenosti i na taj način možemo odabrati optimalan broj klastera:

[TeX:] \[{A_k} = \frac{{100\left\{ {\sum\nolimits_{k = 1}^K {\sum\nolimits_{j = 1}^n {\sum\nolimits_{i = 1}^n {{{\left[ {{{\sum\nolimits_{p = 1}^p {\left( {{x_{ip}} - {x_{jp}}} \right)} }^2}} \right]}^{1/2}}{I_{ik}}{I_{jk}}} } } } \right\}}}{{\sum\nolimits_{i = 1}^{{t_{\max }}} {{{\left[ {\sum\nolimits_{p = 1}^p {{{\left( {{x_{ip}} - {x_{jp}}} \right)}^2}} } \right]}^{1/2}}} }},\]
,

[TeX:] \[k = {t_{\min }},{t_{\min }} + 1,...,{t_{\max }}\]

[TeX:] \[{O_k} = \frac{{100\left\{ {\sum\nolimits_{k = 1}^K {\sum\nolimits_{j = 1}^n {\sum\nolimits_{i = 1}^n {{{\left[ {{{\sum\nolimits_{p = 1}^p {\left( {{x_{ip}} - {x_{jp}}} \right)} }^2}} \right]}^{1/2}}{I_{ik}}{I_{jk}}} } } } \right\}}}{{\sum\nolimits_{i = 1}^{{t_{\max }}} {\sum\nolimits_{j = 1}^n {\sum\nolimits_{i = 1}^n {{{\left[ {\sum\nolimits_{p = 1}^p {{{\left( {{x_{ip}} - {x_{jp}}} \right)}^2}} } \right]}^{1/2}}{I_{ik}}{I_{jk}}} } } }},\]
,

[TeX:] \[k = {t_{\min }},{t_{\min }} + 1,...,{t_{\max }} - 1.\]

gdje je k broj identificiranih skupina, p broj ortogonaliziranih koeficijenata za izračunavanje udaljenosti, tmin,tmaxtmin,tmax maksimalni i minimalni broj grupa IikIjk indikator (binarni) koji ukazuje na prisutnost (1) ili odsutnost (0) TU-a u grupi k.

Nagli porast Ak ili Ok uz smanjenje broja prepoznatljivih klastera ukazuje na porast heterogenosti unutar identificiranih klastera, dok je glatko povećanje koeficijenata znak jednolikog povećanja.

Prag praćen naglim porastom heterogenosti može se optimalno uzeti kao konačni broj klastera. U našoj se analizi izolacija pet klastera u svim proračunima pokazala optimalnom (Autor 1997).

Kao rezultat klasifikacije gradova i regija Rusije identificirano je pet velikih skupina (makrotipova) za muškarce i za žene. Istodobno, dva se makrotipa mogu okarakterizirati kao ekstremi – obuhvaćali su vrlo mali broj regija (često samo jednu regiju). Preostali su makrotipovi bili preveliki za detaljnu analizu. Stoga se za ostala tri makrotipa, kako bi se razlikovali podtipovi, algoritam klasifikacije ponovio za svaki zasebno.

Rezultati

Kao rezultat dvostupanjske klasifikacije uzroka smrtnosti u velikim gradovima i regijama Rusije, dobiveno je 5 makrotipova za muškarce i žene. Za muškarce je izdvojeno 12, a za žene 10 podtipova (slika 2 i (4). Na temelju dobivenih rezultata pripremljene su karte (slike 3 i (5). Tumači znakova na kartama izrađeni su u različitim, ali susjednim bojama kako bi se naglasilo da tipovi za muškarce i žene nisu isti, ali da postoje neki opći trendovi. Za muškarce se koristilo više nijansi crvene da bi se pokazalo da je njihova razina lošija od one u žena. Veličina grafikona odgovara ukupnoj smrtnosti u podskupinama, za muškarce i žene na istoj ljestvici, što omogućava vizualnu usporedbu. Ispitajmo detaljnije i zasebno situaciju među muškarcima i ženama.

Kao što je prije spomenuto, dva se makrotipa muške smrtnosti mogu pripisati krajnostima. Makrotip No1 karakteriziraju minimalne vrijednosti smrtnosti za sve analizirane pokazatelje i uključuje samo jednu regiju - Republiku Ingušetiju. Makrotip No5, s druge je strane, predstavnik maksimalnih vrijednosti smrtnosti za sve pokazatelje. Također uključuje samo jednu regiju - Republiku Tuvu. To je možda zbog stvarne situacije u regijama i osobitosti prikupljanja statističkog materijala. Objašnjenje toga pitanja zahtijeva detaljnije lokalno proučavanje tih regija na razini općinskog okruga.

Makrotip No2 općenito je nizak u pokazateljima smrtnosti svih muškaraca. Većina se regija toga makrotipa nalazi u središnjem dijelu europske Rusije. Uključuju prvenstveno Moskvu i Moskovsku regiju, Republiku Mordoviju i Tatarstan. Izvan europske Rusije tom makrotipu pripadaju samo Jamalskonenečki i Hantijsko-Mansijki autonomni okruzi i Jakutska Republika. Zanimljivo je pratiti unutarnju heterogenost stopa smrtnosti kod toga makrotipa. Prema upotrijebljenom algoritmu klasifikacije mogu se razlikovati četiri podtipa koji kombiniraju 94 teritorijalne jedinice.

Prvi podtip karakteriziraju najniže stope unutar skupine za sve razmatrane uzroke smrti i uključuje Republiku Dagestan s gradovima Derbent, Kaspijsk, Mahačkala, Hasavjurt, gradove teritorija Stavropol (Jesentuki i Kislovodsk) i grad Moskvu. Preostala tri tipa, u pozadini općenito niskih stopa smrtnosti, iz nekog se razloga odlikuju nešto većim vrijednostima.

Drugi je podtip specifičan za povećanu smrtnost od zaraznih bolesti. Regije toga tipa uglavnom se nalaze na Sjevernom Kavkazu (Krasnodarski teritorij, Kabardino-Balkarska, Karačajsko-Čerkeška i Čečenska Republika, Rostovska regija), dok Hantijsko-Mansijski okrug sa svim svojim većim gradovima i grad Anadir pripadaju istom tipu.

Treći podtip makrotipa No2 karakterizira povećana smrtnost od bolesti dišnog sustava, probavnog sustava i vanjskih uzroka. Obuhvaća regiju Astrahan, Republiku Kalmikiju, Lipeck, Tambov i Republiku Mordoviju, kao i Kalinjingradsku regiju. Treba napomenuti da ta skupina sadrži samo jedan grad na ruskom Dalekom istoku – Vladivostok.

Unatoč značajnom smanjenju smrtnosti od vanjskih uzroka tijekom proteklog desetljeća, ta je kategorija i dalje jedan od glavnih uzroka smrti u Rusiji. U usporedbi s drugim razvijenim zemljama i zemljama u razvoju, Rusija ima znatno višu razinu vanjskih uzroka smrti (Rybakovsky i sur. 2017). Taj se problem posebno odnosi na prijevremene smrti među radno sposobnim stanovništvom. Istodobno, postoji konvergencija među regijama u smislu smrtnosti od vanjskih uzroka, dok su međuregionalne razlike u trendovima uglavnom određene kardiovaskularnim bolestima (Timonin i sur. 2017).

Stope smrtnosti od ubojstava i samoubojstava pokazuju stalni pad od 2000-ih. Druga skupina uzroka smrti, ozljede neodređene namjere, brzo raste i 2014. je premašila ukupnu stopu smrtnosti od ubojstava i samoubojstava (Yumaguzin i Vinnik 2019).Repetskaya (2019) je pokazala da evidentirana ubojstva čine samo 20% stvarnih ubojstava. Zbog toga su stvarni podaci o ubojstvima i samoubojstvima podcijenjeni. Smrtnost iz loše definiranih uvjeta u Rusiji također ima najbrži rast u usporedbi sa svim ostalim glavnim uzrocima smrti. Nedovoljna istraga okolnosti smrti socijalno izoliranih osoba pridonosi trendovima smrtnosti iz loše definiranih uvjeta (Gavrilova i sur. 2008). To može dovesti do podcjenjivanja smrtnosti iz vanjskih uzroka.

Tradicionalno se u Rusiji konzumacija alkohola smatra čimbenikom rizika za povećanu smrtnost od vanjskih uzroka (Brainerd i Cutler 2005). Tako je Rusija imala više od deset puta veću stopu prijevremenih smrtnih slučajeva zbog muškog alkohola u odnosu na Švedsku (Rehm i sur. 2007). Unatoč padu smrtnosti zbog alkohola, alkohol je i dalje vodeći uzrok visokog rizika od prerane smrti kod odraslih Rusa (Zaridze i sur. 2014). Ovaj faktor rizika karakteriziraju značajne fluktuacije tijekom vremena. Primjerice, najjača negativna korelacija između promjena u očekivanom životu i trovanja alkoholom pronađena je između 1984. i 2003. godine. Od 2003. do 2017. konstantan pozitivan trend očekivanog života bio je statistički neovisan o trovanju alkoholom (Danilova i sur. 2020). Žarišta smrtnosti zbog alkohola uglavnom se nalaze na teritorijima sjeverozapadne i zapadne Rusije (Grigoriev i sur. 2020). Unatoč pozitivnim trendovima te promjene još uvijek nisu dovoljne da bi se radikalno promijenila situacija s vanjskim uzrocima smrti.

Četvrti podtip karakterizira povećana smrtnost od tumora i bolesti krvožilnog sustava. Uključuje teritorij Stavropol s gradovima Stavropol i Pjatigorsk te Moskovsku regiju s gradovima najbližim glavnom gradu – Korolev, Mytišči, Odincovo, Podolsk i Ramenskoje. Od preostalih regija Ruske Federacije samo pet regija pripada toj podvrsti: Republika Adigeja i regija Belgorod (s Belgorodom i Starim Oskolom), Republika Tatarstan (s Kazanom, Naberežnye Čelny, Nižnjekamsk), Jamalskonenečki autonomni okrug i Jakutska Republika. Osim toga, neki se gradovi u južnim regijama pripisuju tom tipu: Grozni, Volgodonsk i Taganrog. Jedini sjeverni grad toga tipa je Severodvinsk u regiji Arhangelsk, a najistočniji su gradovi Novi Urengoj, Jakutsk i Seversk u regiji Tomsk.

Makrotipovi No3 i No4uglavnom su bliski u smislu prosječne stope smrtnosti koja je prilično visoka. Međutim, makrotip No4 oštro se razlikuje po višoj stopi smrtnosti od zaraznih bolesti (ako izuzmemo vrijednosti makrotipa No5, to su maksimalne vrijednosti smrtnosti za cijeli uzorak). To se najjasnije očituje u trećem podtipu koji uključuje tri regije Urala i Sibira: Sverdlovsk, Irkutsk (uključujući gradove Irkutsk i Bratsk) i Kemerovsku regiju (uključujući grad Prokopjevsk), kao i jedan dio regije Volga – Samaru (uključujući Samaru, Novokujbiševsk, Syzran i Toljati). To prilično dobro odgovara raspodjeli smrtnosti od tuberkuloze, jednog od glavnih uzroka smrti od zaraznih bolesti na teritoriju Ruske Federacije.

Prvi podtip makrotipa No4 odlikuje se najvišom stopom smrtnosti od tumora među svim odabranim skupinama. Pripadaju mu samo teritorij Altaj i gradovi Čeljabinsk, Salavat (Republika Baškirija), Nojabrsk (autonomno područje Jamalo-Nenec) i Angarsk (regija Irkutsk). Taj makrotip uključuje ostale uralske (Čeljabinske i Kurganske regije) i sibirske regije (Novosibirska regija i Krasnojarski kraj). Općenito, to je prilično mali makrotip po sastavu koji ujedinjuje samo 43 analizirane administrativne jedinice, pretežno regije i gradove Urala i Sibira.

Makrotip No3 najdiferenciraniji je – ukupno je izdvojeno pet podtipova. Najzanimljiviji je njegov prvi podtip koji karakterizira velika smrtnost od respiratornih bolesti i vanjskih uzroka. Uključuje Židovsku autonomnu regiju s Birobidžanom, Zabajkalski teritorij, Republiku Altaj, Burjatiju i Autonomnu oblast Čukotka.

Nadalje, treba razlikovati peti podtip koji karakterizira visoka smrtnost od bolesti krvožilnog sustava i koji ujedinjuje regije i gradove europskoga sjevera (Arhangelsk, Kostroma, Murmansk, Pskovska regija, Nenecki autonomni okrug, Republiku Kareliju i Komi) te ruski Daleki istok (Kamčatka, teritorij Habarovsk i regija Magadan).

Konačno, treći podtip karakteriziraju visoke stope smrtnosti od bolesti probavnoga sustava. Taj podtip također ujedinjuje regije i gradove europske Rusije (regije Jaroslavl, Vladimir, Ivanovo, Tula, Republika Mari El, Udmurtija i Čuvaš) i Ruski Daleki istok (regije Amur i Sahalin).

Općenito se može primijetiti da makrotip No3 uključuje regije karakterizirane najnepovoljnijom situacijom u pogledu smrtnosti iz gotovo svih analiziranih razloga, osim smrtnosti od zaraznih bolesti. Zanimljivo je primijetiti da makrotipove No2 i No4 uglavnom karakterizira podudarnost sadašnje smrtnosti u regiji i njezinim gradovima. Međutim, postoje iznimke. Dakle, Moskovsku regiju odlikuje značajna prostorna diferencijacija.

Razlika u smrtnosti između gradova i regija uočljivija je kod makrotipa No3. Zapanjujući primjer je Primorski kraj, gdje obližnji gradovi Artem, Usurijsk, Nahodka i Vladivostok pripadaju potpuno različitim vrstama smrtnosti.

U razmatranju situacije sa smrtnošću među ženama možemo razlikovati samo jedan makrotip koji se odnosi na ekstreme. Riječ je o makrotipu No5 gdje su zabilježene izuzetno visoke stope smrtnosti iz svih razmatranih uzroka. Opet, taj makrotip uključuje samo jednu regiju – Republiku Tuvu.

Makrotip No1 ujedinjuje regije i gradove s najmanjom smrtnošću žena iz svih razloga. Zanimljiv je prvi podtip tog makrotipa jer ga karakteriziraju minimalne stope smrtnosti iz svih razloga i povećana smrtnost od respiratornih bolesti. Taj tip uključuje samo Republiku Dagestan s gradovima Mahačkala i Derbent te grad Nazran (Republika Ingušetija).

Drugi i treći podtip makrotipa 1 čine dvije jednake skupine prema broju uključenih teritorijalnih objekata (42 odnosno 41). Drugi podtip karakteriziraju nešto veće stope smrtnosti od bolesti probavnog sustava i vanjskih uzroka. Obuhvaća samo gradove i regije europskog dijela protežući se od Republike Kalmikije i Krasnodarskog teritorija do Smolenske i Jaroslavske regije na sjeveru i Baškirske Republike na istoku. Općenito, makrotip No1 karakterizira teritorijalna ograničenost na europski dio Ruske Federacije. Osim toga, niske se stope smrtnosti primjećuju samo u regijama proizvodnje nafte i plina te u nekim velikim gradovima.

Treći podtip, osim pozadine niskih stopa smrtnosti, karakterizira i prevladavanje smrtnosti od tumora i bolesti krvožilnog sustava. To su republike Sjevernog Kavkaza – Ingušetija, Kabardino-Balkar, Karačaj-Čerkes, Sjeverna Osetija i Adigeja, te Stavropoljski teritorij i Rostovska oblast. Regija Belgorod s gradom Belgorodom, regija koju bi u pogledu smrtnosti među ženama vjerojatno trebalo prepoznati kao najistaknutiju među europskim regijama Ruske Federacije, kao i regija proizvodnje nafte i plina, okrug Hanti-Mansi, sa svim svojim glavnim gradovima i gradom Tjumenjem, pripadaju istom tipu. Mnogi gradovi u europskom dijelu Ruske Federacije pripadaju tom tipu; ne samo gradovi Sjevernog Kavkaza, već i južnoeuropski dio (Astrahan i Taganrog), Povolžje (Kazanj, Naberežne Čelni i Nižnjekamsk) i Moskva sa susjednim Balašihom i Korolevom. Treba napomenuti da neki gradovi imaju teške klimatske uvjete – Novi Urengoj i Jakutsk.

Makrotipovi No2 i No3kombiniraju teritorijalne skupine s pretežno visokom stopom smrtnosti. Štoviše, međusobno su vrlo bliski u pogledu smrtnosti od tumora, bolesti krvožilnog sustava i bolesti dišnog sustava, ali se međusobno razlikuju u smrtnosti od zaraznih bolesti, probavnih bolesti i vanjskih uzroka. Makrotip No3razlikuje se po prilično niskoj smrtnosti od zaraznih bolesti i nižoj smrtnosti od bolesti probavnog sustava i vanjskih uzroka od makrotipa No2.

Prvi podtip makrotipa No3 karakterizira niska stopa smrtnosti od respiratornih bolesti, nasuprot prilično visokim stopama smrtnosti od tumora i bolesti krvožilnog sustava i uključuje 31 ispitanika. To su regije unutar europskog dijela Ruske Federacije – regije Vologda, Murmansk, Nižnji Novgorod, Oriol, Uljanovsk te Republike Čečenije i Krim. Među gradovima koji pripadaju tom tipu izvan europske Rusije treba istaknuti Barnaul i Novosibirsk.

Drugi podtip uključuje nešto veći broj subjekata (38) koje karakterizira prilično visoka stopa smrtnosti od bolesti probavnog sustava i vanjskih uzroka. To nisu samo europske regije, već i teritoriji Sibira i ruskog Dalekog istoka – Novosibirska regija, Republika Jakutija, Kamčatski teritorij i Petropavlovsk-Kamčatski. Treba istaknuti Sankt Peterburg i mnoge gradove u moskovskoj regiji (Domodedovo, Kolomna, Mytišči, Noginsk i Odincovo) i ruski Daleki istok (Blagoveščensk i Vladivostok).

Treća podvrsta makrotipa No3 uključuje samo tri grada – Grozni, Krasnodar i Anadir. Što se tiče smrtnosti od tumora, bolesti krvožilnog sustava i bolesti dišnog sustava, ta je podvrsta bliska makrotipu No4koju karakteriziraju visoke stope smrtnosti iz svih uzroka. Međutim, niže stope smrtnosti od zaraznih bolesti, bolesti probavnog sustava i vanjskih uzroka ne dopuštaju da se to pripiše ovome makrotipu.

U makrotipu No2, četvrti podtip (visoke stope smrtnosti od tumora, bolesti krvožilnog sustava, respiratornih i probavnih organa) uključuje četiri regije koje nisu geografski međusobno povezane (Vladimir, regije Tomsk, Krasnojarsk i Primorski kraj) i 15 gradova. To su mnogi industrijski gradovi (Ačinsk, Angarsk i Krasnojarsk), gradovi s teškim klimatskim uvjetima (Magadan i Čita), a također i gradovi Moskovske regije (Orehovo-Zuevo, Puškino, Sergijev Posad i Ščolkovo), kao i Simferopol (Republika Krim). Taj tip, zajedno s makrotipom No4, može se opisati kao najnepovoljniji u pogledu smrtnosti među ženama.

Zanimljivo je primijetiti da treći podtip makrotipa No2 karakterizira visoka stopa smrtnosti od zaraznih bolesti i vanjskih uzroka. Ograničena je uglavnom na teritorij Sibira (Trans-Bajkalski teritorij, Irkutsk (uključujući Irkutsk, Bratsk), Kemerovo (uključujući Novokuznjeck, Prokopjevsk), regiju Omsk, Republiku Altai i Burjatsku), Ural (Kurgan, regiju Sverdlovsk (uključujući Nižnij Tagil, Pervouralsk), te gradove regije Čeljabinsk - Kopeisk, Magnitogorsk, Mias) i Dalekog istoka (Amurska regija, gradovi Usurijsk i Habarovsk), ali teritoriji koji pripadaju tom tipu nalaze se i u europskom dijelu zemlje - Lenjingradska, Tverska i Permska regija.

Makrotip No4 karakterizira visoka stopa smrtnosti za sve analizirane parametre (posebno bolesti krvožilnog sustava, dišnog sustava i probavnog sustava); iznimka je smrtnost od zaraznih bolesti. Prvo se razlikuju ruske daleke istočne regije i gradovi – Čukotski autonomni okrug, Magadanska oblast, Sahalinska oblast, uključujući Južno-Sahalinsk, Židovska autonomna oblast, uključujući Birobidžan, a također i grad Nahodka, Primorski kraj.

Kao i među muškarcima, smrtnost žena u većini gradova i regija Ruske Federacije karakterizira visoka stopa. Teritoriji s niskom smrtnošću tradicionalno su prvenstveno regije Sjevernog Kavkaza. Međutim, u slučaju smrtnosti žena ovo pravilo nije uvijek primjenjivo.

Za razliku od mnogih zemalja s visokim dohotkom, Rusija još nije izvršila epidemiološku tranziciju i kontrolirala smrtnost od kardiovaskularnih bolesti. Ishemijska bolest srca i cerebrovaskularne bolesti i dalje su vodeći uzroci smrti u svim regijama Rusije.

Što se tiče karcinoma, pozitivni trendovi povezani su sa smanjenjem smrtnosti od raka pluća. To može biti posljedica promjene načina života (smanjenje broja ljudi koji koriste duhan) i promjene kvalitete duhanskih proizvoda (smanjenje katrana u cigaretama). Vremenski obrasci smrtnosti od raka dojke u Rusiji u skladu su s ostalim europskim zemljama, iako se stopa raka vrata maternice i stopa pojavnosti u posljednjim generacijama brzo povećavaju (Barchuk i sur., 2018). Povezanost samoubojstva i raka predstavlja značajan problem i može se smatrati pokazateljem društvene dezintegracije. Postoji pozitivna veza između trendova samoubojstava i svih vrsta karcinoma kod muškaraca i žena, osim raka tankog crijeva i karcinoma prostate kod muškaraca (Razvodovsky i Zotov 2016). Stvarna pojava samoubojstva u bolesnika s karcinomom smatra se premalo prijavljenom (Razvodovsky 2017).

Na regionalne razlike u uzrocima smrti mogu utjecati životni stilovi koje je teško razmotriti na nacionalnoj razini zbog značajnih kulturnih razlika i razine dohotka. Regionalne prakse za kodiranje uzroka smrti mogu također značajno narušiti strukturu smrtnosti.

Zaključak

Situaciju smrtnosti muškaraca u zemlji u cjelini možemo opisati kao nepovoljnu jer je velika većina gradova i regija uključena u skupine s visokim stopama smrtnosti (makrotipovi No3 i No4).

Kao rezultat klasifikacije prilično se dobro razlikuju kompaktne skupine gradova i regija koje karakteriziraju specifične situacije u smislu smrtnosti. Dakle, možemo razlikovati skupinu Sjevernog Kavkaza, južnu skupinu i uralsko-sibirske skupine gradova i regija. Istodobno, ta klasifikacija omogućuje izdvajanje pojedinih regija s visokodiferenciranom situacijom unutarregionalne smrtnosti, na primjer, Moskovske regije i Primorskoga kraja.

Zanimljivo je i da je klasifikacija otkrila određenu homogenost u nepovoljnoj situaciji smrtnosti između gradova i regija europske Rusije (uglavnom sjevera) i ruskog Dalekog istoka. Odlikuje ih visoka smrtnost od bolesti krvožilnog sustava i probavnih organa.

Teško je procijeniti uzročno-posljedične veze koje određuju neku situaciju prema smrtnosti. Dakle, za muškarce je makrotip No2uobičajen za gradove i regije s prilično niskim stopama smrtnosti iz svih razloga, ali je različit u pogledu njihovog socio-ekonomskog razvoja, stanja okoliša i uvjeta okoliša. Niske stope smrtnosti vjerojatno nisu određene jednim čimbenikom za sve regije, već zasebnim čimbenicima u svakom slučaju.

Kada se provodi tipološka klasifikacija smrtnosti među ženama, razlikuju se manje različite teritorijalne skupine u usporedbi s muškarcima. Iako teritoriji s niskom stopom smrtnosti također uglavnom pripadaju regijama Sjevernog Kavkaza, postoje iznimke (na primjer, Čečenska Republika i grad Grozni). Istodobno, nekoliko je regija prilično stabilno u pogledu smrtnosti muškaraca i žena. Prvo, Republika Tuva je potvrđena kao regija s izuzetno visokim stopama smrtnosti i među muškarcima i među ženama. U istoj se mjeri to odnosi na gradove u nepovoljnom položaju u moskovskoj regiji:Orehovo-Zuevo, Puškino, Sergijev Posad i Šelkovo. Međutim, prostorna se slika smrtnosti žena ne podudara uvijek s raspodjelom stopa smrtnosti među muškarcima, što je najizraženije u Sankt Peterburgu, gdje je visoka stopa smrtnosti među muškarcima, a niska među ženama.

Druga značajka raspodjele smrtnosti među ženama često je različita analizi muške smrtnosti. Primjerice, nepovoljnoj situaciji u Tjumenjskoj oblasti suprotstavlja se bolja situacija u gradu Tjumenju. Sličan je obrazac uočen u Republici Jakutiji i Jakutsku, Astrahanskoj oblasti i Astrahanu i drugdje.